. 2023 Dec 12:12:e85279.
doi: 10.7554/eLife.85279.

Cystatin F (Cst7) drives sex-dependent changes in microglia in an amyloid-driven model of Alzheimer's disease

Affiliations

Cystatin F (Cst7) drives sex-dependent changes in microglia in an amyloid-driven model of Alzheimer's disease

Michael J D Daniels et al. Elife. .

Abstract

Microglial endolysosomal (dys)function is strongly implicated in neurodegenerative disease. Transcriptomic studies show that a microglial state characterised by a set of genes involved in endolysosomal function is induced in both mouse Alzheimer's disease (AD) models and human AD brain, and that the emergence of this state is emphasised in females. Cst7 (encoding cystatin F) is among the most highly upregulated genes in these microglia. However, despite such striking and robust upregulation, the function of Cst7 in neurodegenerative disease is not understood. Here, we crossed Cst7-/- mice with the AppNL-G-F mouse to test the role of Cst7 in a model of amyloid-driven AD. Surprisingly, we found that Cst7 plays a sexually dimorphic role regulating microglia in this model. In females, Cst7-/-AppNL-G-F microglia had greater endolysosomal gene expression, lysosomal burden, and amyloid beta (Aβ) burden in vivo and were more phagocytic in vitro. However, in males, Cst7-/-AppNL-G-F microglia were less inflammatory and had a reduction in lysosomal burden but had no change in Aβ burden. Overall, our study reveals functional roles for one of the most commonly upregulated genes in microglia across disease models, and the sex-specific profiles of Cst7-/--altered microglial disease phenotypes. More broadly, the findings raise important implications for AD including crucial questions on sexual dimorphism in neurodegenerative disease and the interplay between endolysosomal and inflammatory pathways in AD pathology.

Keywords: Alzheimer's disease; human; immunology; inflammation; lysosome; microglia; mouse; neuroscience; phagocytosis; sexual dimorphism.


Conflict of interest statement

MD, LL, SS, AD, LM, MT, JB, OD, XH, MM, HS, TS, TS, TS, BM No competing interests declared

Figures

Figure 1.
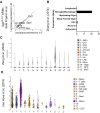
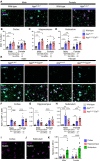
Figure 1.. Cst7/cystatin F is upregulated in microglia in murine models of Alzheimer’s disease (AD).
(A) Analysis of publicly available microglial RNASeq databases for Cst7 expression in amyloid-driven models. Background-matched control (grey) or relevant disease model (blue). (B) Brightfield slide-scanned images of wild-type (left) and AppNL-G-F (right) sagittal brain sections stained by in situ hybridisation for Cst7 (red). (C) Example image from Cst7 fluorescence in situ hybridisation (FISH) experiment stained with IBA1 (green), 6E10 (magenta), and Cst7 (cyan). (D) Quantification of (C) showing % Cst7+ area in areas within 25 µm (blue) of 6E10+ plaques or outside (grey). (E) Hi-mag confocal microscopy maximum intensity projection showing co-localisation of Cst7 with IBA1 around plaques. (F) Quantification of (E) showing % Cst7 overlap with IBA1. n=3–7. **p<0.01, ***p<0.001 by unpaired t-test or two-way ANOVA with Tukey’s multiple comparisons post hoc test. #p<0.05 by paired t-test. Scale bars are 20 µm.
Figure 1—figure supplement 1.
Figure 1—figure supplement 1.. Investigating expression of Cst7.
(A) Sub-set analysis of activated response microglia (ARM) cluster from Sala-Frigerio et al. expression of genes in females vs. males. Selected genes annotated. (B–D) Cst7 expression from published datasets. Data plotted using web tools on https://www.brainrnaseq.org/ (B), https://singlecell.broadinstitute.org (C), and https://www.brainimmuneatlas.org/ (D).
Figure 2.
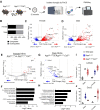
Figure 2.. Cst7 deletion leads to sex-dependent transcriptomic changes in microglia in the AppNL-G-F model of amyloid-driven Alzheimer’s disease (AD).
(A) Study design schematic. (B) Differentially expressed genes (DEGs) between wild-type and AppNL-G-F microglia in male and female mice. (C) Volcano plot of RNASeq from wild-type vs. AppNL-G-F female microglia. Points in red are significantly upregulated in disease. Points in blue are significantly downregulated. Selected genes are annotated. (D) Volcano plot of RNASeq from wild-type vs. AppNL-G-FCst7+/+ male microglia. (E) Volcano plot of RNASeq from female AppNL-G-FCst7+/+ vs. AppNL-G-FCst7-/- microglia. Points in red are significantly upregulated in AppNL-G-FCst7-/-. Points in blue are significantly downregulated. Selected genes are annotated. (F) Selected GO:BP (Gene Ontology:biological process) terms that are significantly enriched in the upregulated genes from (E) and corresponding significance p-value. (G) Volcano plot of RNASeq from male AppNL-G-FCst7+/+ vs. AppNL-G-FCst7-/- microglia. (H) Selected GO:BP terms that are significantly enriched in the upregulated genes from (G) and corresponding significance p-value. (I and J) Example gene expression (fpkm) from RNASeq of microglia isolated from male and female wild-type, AppNL-G-FCst7+/+, and AppNL-G-FCst7-/- mice. Selected genes are Lilrb4 (I) and Cxcl2 (J).
Figure 2—figure supplement 1.
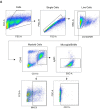
Figure 2—figure supplement 1.. Gating strategy for microglia fluorescence-activated cell sorting (FACS).
Microglia/BAMs were defined as single cells, Zombie NIR- live cells, CD11b+CD45+ myeloid cells, Ly6C- microglia/BAMs. Phenotypic markers MHCII and CD11c were also tested. All gates were set using fluorescence minus one (FMO) controls.
Figure 2—figure supplement 2.
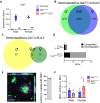
Figure 2—figure supplement 2.. Gene expression from RNASeq data.
(A) Example expression (fpkm) of Cst7 from RNASeq of microglia isolated from male and female wild-type, AppNL-G-FCst7+/+, and AppNL-G-FCst7-/- mice. (B) Venn diagram showing differentially expressed genes (DEGs) in AppNL-G-F microglia that are male only (left), shared between male and female (middle), or female only (right). (C) Venn diagram showing DEGs in Cst7-/- microglia that are male only (left), shared between male and female (middle), or female only (right). (D) DEGs in male vs. female AppNL-G-F or AppNL-G-FCst7-/- mice. (E) Example image from Lilrb4a fluorescence in situ hybridisation (FISH) experiment stained with IBA1 (green), 6E10 (magenta), and Lilrb4a (cyan) showing co-localisation of Lilrb4a with IBA1 around plaques. (F) Quantification of (E) showing Lilrb4a expression in IBA1+ cells in male and female AppNL-G-F and AppNL-G-FCst7-/- brains. n=6. *p<0.05 by two-way ANOVA with Sidak’s multiple comparisons post hoc test.
Figure 2—figure supplement 3.
Figure 2—figure supplement 3.. Gene expression from RNASeq data compared to qPCR from naïve (non-diseased) mice.
(A) Expression (fpkm) of Lilrb4a and Il1b from RNASeq of wild-type (grey), AppNL-G-F (blue), or AppNL-G-FCst7-/- (red) microglia from male and female mice. (B) Relative expression (ddCt vs. mean of male wild-type) of Lilrb4a and Il1b from naïve (non-diseased) wild-type (grey) and Cst7-/- (red) microglia. n=3–4. Analysed by DESeq2 (A) or by two-way ANOVA with Sidak’s multiple comparisons post hoc test (B).
Figure 3.
Figure 3.. Cst7 deletion leads to region and sex-dependent changes in lysosomes in AppNL-G-F mice.
(A) Example images from male and female wild-type and AppNL-G-F cortex stained with IBA1 (green), 6E10 (magenta), and LAMP2 (cyan). (B–D) IBA1 % coverage from images taken of wild-type, AppNL-G-FCst7+/+, and AppNL-G-FCst7-/- brains in cortex (B), hippocampus (C), and dorsal subiculum (D). (E) Example images from AppNL-G-FCst7+/+ and AppNL-G-FCst7-/- subicula in male and female mice. Top panel shows LAMP2 (cyan) and bottom panel shows IBA1 (green), 6E10 (magenta), and LAMP2 (cyan) merge. Scale bars are 50 μm. (F–H) Ratio of IBA1/LAMP2 double positive staining vs. IBA1 total staining in the cortex (F), hippocampus (G), and dorsal subiculum (H) of wild-type, AppNL-G-FCst7+/+, and AppNL-G-FCst7-/- mice. (I and J) Example images from the cortex (I) and subiculum (J) of an AppNL-G-F mouse stained with 6E10 (magenta) and MeX04 (white). (K) Ratio of MeX04 total staining vs. 6E10 total staining in cortex (blue), hippocampus (red), and subiculum (green) of male and female AppNL-G-F mice. Scale bars are 50 μm. Data points are average from 2 fields of view/mouse (1 for subiculum) and bars are plotted as mean + SEM. n=5–12. *p<0.05, **p<0.01, ***p<0.001 by two-way ANOVA with Tukey’s multiple comparisons post hoc test.
Figure 3—figure supplement 1.
Figure 3—figure supplement 1.. Immunohistochemistry supplementary information.
(A) Whole slide scan of an AppNL-G-F brain stained with 6E10 (red) and MeX04 (white) to illustrate regions of interest taken for analysis. Example regions are cortex (blue square), hippocampus (red square), and subiculum (green square). (B–D) % 6E10 burden in cortex (B), hippocampus (C), and subiculum (D) of male and female wild-type, AppNL-G-FCst7+/+, and AppNL-G-FCst7-/- mice. (E) % LAMP2 burden vs. % IBA1 burden scatter plot from all mice in study with linear regression. n=5–12. ***p<0.001 by two-way ANOVA with Tukey’s multiple comparisons post hoc test.
Figure 4.
Figure 4.. Cst7 regulates microglial Aβ burden in female AppNL-G-F mice.
(A) Study design schematic. (B) % MeX04+ microglia of total microglia in male and female wild-type (grey), AppNL-G-FCst7+/+ (blue), and AppNL-G-FCst7-/- (red) brains. (C) Median fluorescence intensity (MFI) of MeX04 in microglia. (D) MFI of CD45 on microglia. (E) % CD11c+ microglia of total microglia. (F) % MHC-II+ microglia of total microglia. (G) MFI of P2Y12 on microglia. Bars are plotted as mean + SEM. n=5–12. *p<0.05, **p<0.01, ***p<0.001 by two-way ANOVA with Sidak’s multiple comparisons post hoc test.
Figure 4—figure supplement 1.
Figure 4—figure supplement 1.. Validating MeX04 to measure Aβ-containing microglia.
Fluorescence-activated cell sorting (FACS) plots of microglia gated by MeX04 and SSC-A. Plots show data from a wild-type mouse injected with MeX04 (left), an aged AppNL-G-F mouse injected with vehicle (middle), and an aged AppNL-G-F mouse injected with MeX04 (right).
Figure 5.
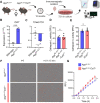
Figure 5.. Cst7 negatively regulates phagocytosis in microglia from female AppNL-G-F mice.
(A) Study design schematic. (B–C) qPCR data for Cst7 (B) and Tmem119 (C) RNA expression from female wild-type and AppNL-G-F microglia isolated by CD11b beads and cultured for 3 days in vitro. Bars represent mean fold change calculated by ΔΔCt. n=4. *p<0.05, ***p<0.001 by two-way t-test. (D–E) Cathepsin L (D) and C (E) activity from female AppNL-G-FCst7+/+ (blue) and AppNL-G-FCst7-/- (red) microglia measured by probe-based assay. Bars represent mean relative fluorescence units (RFU) + SEM. n=4–5. (F) Example images from myelin phagocytosis assays with female AppNL-G-FCst7+/+ (blue) and AppNL-G-FCst7-/- (red) microglia taken immediately before (t=0) and 2 hr 45 min after (t=2 hr 45 min) addition of pHrodo-tagged myelin. (G) Quantification of (F). Data shown are mean RFU (calculated as total integrated intensity of pHrodo Red normalised to cell confluence) ± SEM. n=4. *p<0.05 calculated by unpaired t-test on area under curve (AUC) of data.
Figure 5—figure supplement 1.
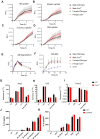
Figure 5—figure supplement 1.. Investigating Cst7 knockout in vitro.
(A–D) Uptake of various tagged substrates from male (solid lines/symbols) and female (dotted lines/symbols) wild-type (black) and Cst7-/- (red) microglia. Substrates tested were HiLyte647-tagged Aβ1-42(A), pHrodo-tagged myelin (B), pHrodo-tagged S. aureus (C), and pHrodo-tagged human Alzheimer’s disease (AD) synaptoneurosomes (D). (E) Uptake and degradation of HiLyte647-tagged Aβ1-42 from male (solid lines/symbols) and female (dotted lines/symbols) wild-type (black) and Cst7-/- (red) microglia and microglia treated with pan-cathepsin inhibitor K777 (10 µM, blue lines/symbols). (F) Lysosomal proteolysis measured by de-quenching of DQ-BSA from male (solid lines/symbols) and female (dotted lines/symbols) wild-type (black) and Cst7-/- (red) microglia and microglia treated with pan-cathepsin inhibitor K777 (10 µM, blue lines/symbols). Data are mean signal measured by relative fluorescence units (RFU) ± SEM. n=4. All statistics were p>0.05 calculated by one-way ANOVA on area under curve (AUC) of data with Dunnett’s multiple comparison’s test. (G–I) qPCR data showing gene expression (relative to wild-type untreated) of male wild-type (black) and Cst7-/- (red) microglia stimulated with LPS (100 ng/mL, 24 hr), IL-4 (20 ng/mL, 24 hr) or apoptotic SH-SH5Y cells (2:1 ratio, 24 hr). Genes tested were Arg1 (G), Il1b (H), and Trem2 (I). (K and J) IL-1β secretion from male wild-type (black) and Cst7-/- (red) microglia treated with LPS (1 µg/mL, 4 hr) or LPS+silica (varying dose, 4 hr (K) or 300 µg/mL, varying time (J)) to activate the NLRP3 inflammasome. Data are mean secretion/expression + SEM. n=4.
Figure 5—figure supplement 2.
Figure 5—figure supplement 2.. Investigating Cst7 knockout on microglial cytokine secretion.
Multiplex bead-based ELISA data from male wild-type (black) and Cst7-/- (red) microglia stimulated with LPS (100 ng/mL, 24 hr) or IL-4 (20 ng/mL, 24 hr). Data are mean ± SEM. n=4.
Figure 5—figure supplement 3.
Figure 5—figure supplement 3.. Investigating Cst7 knockdown in BV-2 cells vitro.
(A) qPCR data of Cst7 expression in BV-2 cells treated with scrambled control siRNA (black) or siRNA targeting Cst7 (red). (B) IL-6 secretion from BV-2 cells treated with scrambled control siRNA (black) or siRNA targeting Cst7 (red) following stimulation with LPS (100 ng/mL, 24 hr) or IL-4 (20 ng/mL, 24 hr). (C–E) qPCR data of gene expression in BV-2 cells treated with scrambled control siRNA (black) or siRNA targeting Cst7 (red) before stimulation with LPS (100 ng/mL, 24 hr) or IL-4 (20 ng/mL, 24 hr). Genes tested were Arg1 (C), Il1b (D), and Trem2 (E). Data are shown as mean + SEM. n=5. **p<0.01 by one-sample t-test against hypothetical value of 100.
Figure 5—figure supplement 4.
Figure 5—figure supplement 4.. Investigating Cst7 knockout from AppNL-G-F mice in vitro.
(A) Yield of isolated microglia from AppNL-G-FCst7+/+ (blue) and AppNL-G-FCst7-/- (red) mice. (B) IL-6 secretion from AppNL-G-FCst7+/+ (blue) and AppNL-G-FCst7-/- (red) cultured microglia treated with LPS (100 ng/mL, 24 hr). (C) IL-1β secretion from AppNL-G-FCst7+/+ (blue) and AppNL-G-FCst7-/- (red) cultured microglia treated with LPS (100 ng/mL, 24 hr) or LPS (1 µg/mL, 4 hr)+silica (300 µg/mL, 4 hr) to activate the NLRP3 inflammasome. (D) TNFα secretion from AppNL-G-FCst7+/+ (blue) and AppNL-G-FCst7-/- (red) cultured microglia treated with LPS (100 ng/mL, 24 hr). Data are presented as mean cytokine concentration in pg/mL + SEM. (E) Uptake and degradation of HiLyte647-tagged Aβ1-42 from female AppNL-G-FCst7+/+ (blue) and AppNL-G-FCst7-/- (red) cultured microglia. (F) Uptake and degradation of HiLyte647-tagged Aβ1-42 from BV-2 cells treated with vehicle (0.5% DMSO, black), K777 (10 µM, green), or Ca074Me (100 µM, orange). (G) Lysosomal proteolysis measured by de-quenching of DQ-BSA from female AppNL-G-FCst7+/+ (blue) and AppNL-G-FCst7-/- (red) cultured microglia. (H) Uptake of HiLyte647-tagged Aβ1-42 from female AppNL-G-FCst7+/+ (blue) and AppNL-G-FCst7-/- (red) cultured microglia. Data are shown as mean ± SEM. n=4–5. ***p<0.001 calculated by one-way ANOVA on area under curve (AUC) of data with Dunnett’s multiple comparison’s test.
Figure 6.
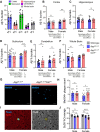
Figure 6.. Investigating the effect of Cst7 deletion on disease pathology.
(A) % Aβ coverage measured by 6E10 3,3'-diaminobenzidine (DAB) staining in cortex (blue), hippocampus (red), subiculum (green), cerebellum (magenta), and whole brain (grey) of male and female AppNL-G-F brains. (B–F) % Aβ coverage in the cortex (B), hippocampus (C), subiculum (D), cerebellum (E), and whole brain (F) of male and female AppNL-G-FCst7+/+ (blue) and AppNL-G-FCst7-/- (red) mice. Points are measured by thresholding of whole region area in sagittal section. Bars represent mean + SEM % coverage. n=10–12. *p<0.05, **p<0.01 calculated by two-way ANOVA with Sidak’s multiple comparisons post hoc test. (G) Example images from subicula of female AppNL-G-FCst7+/+ (left) and AppNL-G-FCst7-/- (right) mice stained with MeX04 (blue). Scale bars are 50 μm. (H) Quantification of (G). MeX04+ plaque count in the subicula of female AppNL-G-FCst7+/+ (blue) and AppNL-G-FCst7-/- (red) mice. Points are number of plaques from a single field of view for each mouse. Bars are mean plaque count + SEM. n=10–12. $p<0.05 calculated by two-way Mann-Whitney test. (I) Example image of a plaque with Thio S (blue) and synapses stained with synaptophysin (red) in AppNL-G-F brain. Plaque border is highlighted in yellow. (J) Quantification of (I) measuring coverage of synaptophysin. Bars represent mean + SEM % coverage. n=5–12. *p<0.05 calculated by two-way ANOVA with Tukey’s multiple comparisons post hoc test.
Figure 6—figure supplement 1.
Figure 6—figure supplement 1.. Investigating the role of Cst7 in plaque burden.
Area of MeX04+ plaques in the subiculum of male and female AppNL-G-FCst7+/+ (blue) and AppNL-G-FCst7-/- (red) brains. Bars are mean plaque area + SEM. n=10–12.
Author response image 1.

Update of

  • doi: 10.1101/2022.11.18.516922

References

    1. Alexa A, Rahnenführer J, Lengauer T. Improved scoring of functional groups from gene expression data by decorrelating GO graph structure. Bioinformatics. 2006;22:1600–1607. doi: 10.1093/bioinformatics/btl140. - DOI - PubMed
    1. Altmann A, Tian L, Henderson VW, Greicius MD. Sex modifies the APOE-related risk of developing Alzheimer disease. Annals of Neurology. 2014;75:563–573. doi: 10.1002/ana.24135. - DOI - PMC - PubMed
    1. Bankhead P, Loughrey MB, Fernández JA, Dombrowski Y, McArt DG, Dunne PD, McQuaid S, Gray RT, Murray LJ, Coleman HG, James JA, Salto-Tellez M, Hamilton PW. QuPath: Open source software for digital pathology image analysis. Scientific Reports. 2017;7:16878. doi: 10.1038/s41598-017-17204-5. - DOI - PMC - PubMed
    1. Blasi E, Barluzzi R, Bocchini V, Mazzolla R, Bistoni F. Immortalization of murine microglial cells by a v-raf/v-myc carrying retrovirus. Journal of Neuroimmunology. 1990;27:229–237. doi: 10.1016/0165-5728(90)90073-v. - DOI - PubMed
    1. Chen WT, Lu A, Craessaerts K, Pavie B, Sala Frigerio C, Corthout N, Qian X, Laláková J, Kühnemund M, Voytyuk I, Wolfs L, Mancuso R, Salta E, Balusu S, Snellinx A, Munck S, Jurek A, Fernandez Navarro J, Saido TC, Huitinga I, Lundeberg J, Fiers M, De Strooper B. Spatial transcriptomics and in situ sequencing to study alzheimer’s disease. Cell. 2020;182:976–991. doi: 10.1016/j.cell.2020.06.038. - DOI - PubMed

Publication types

Associated data