. 2023 Dec 19;120(51):e2309325120.
doi: 10.1073/pnas.2309325120. Epub 2023 Dec 12.

Quantifying fire-specific smoke exposure and health impacts

Affiliations

Quantifying fire-specific smoke exposure and health impacts

Jeff Wen et al. Proc Natl Acad Sci U S A. .

Abstract

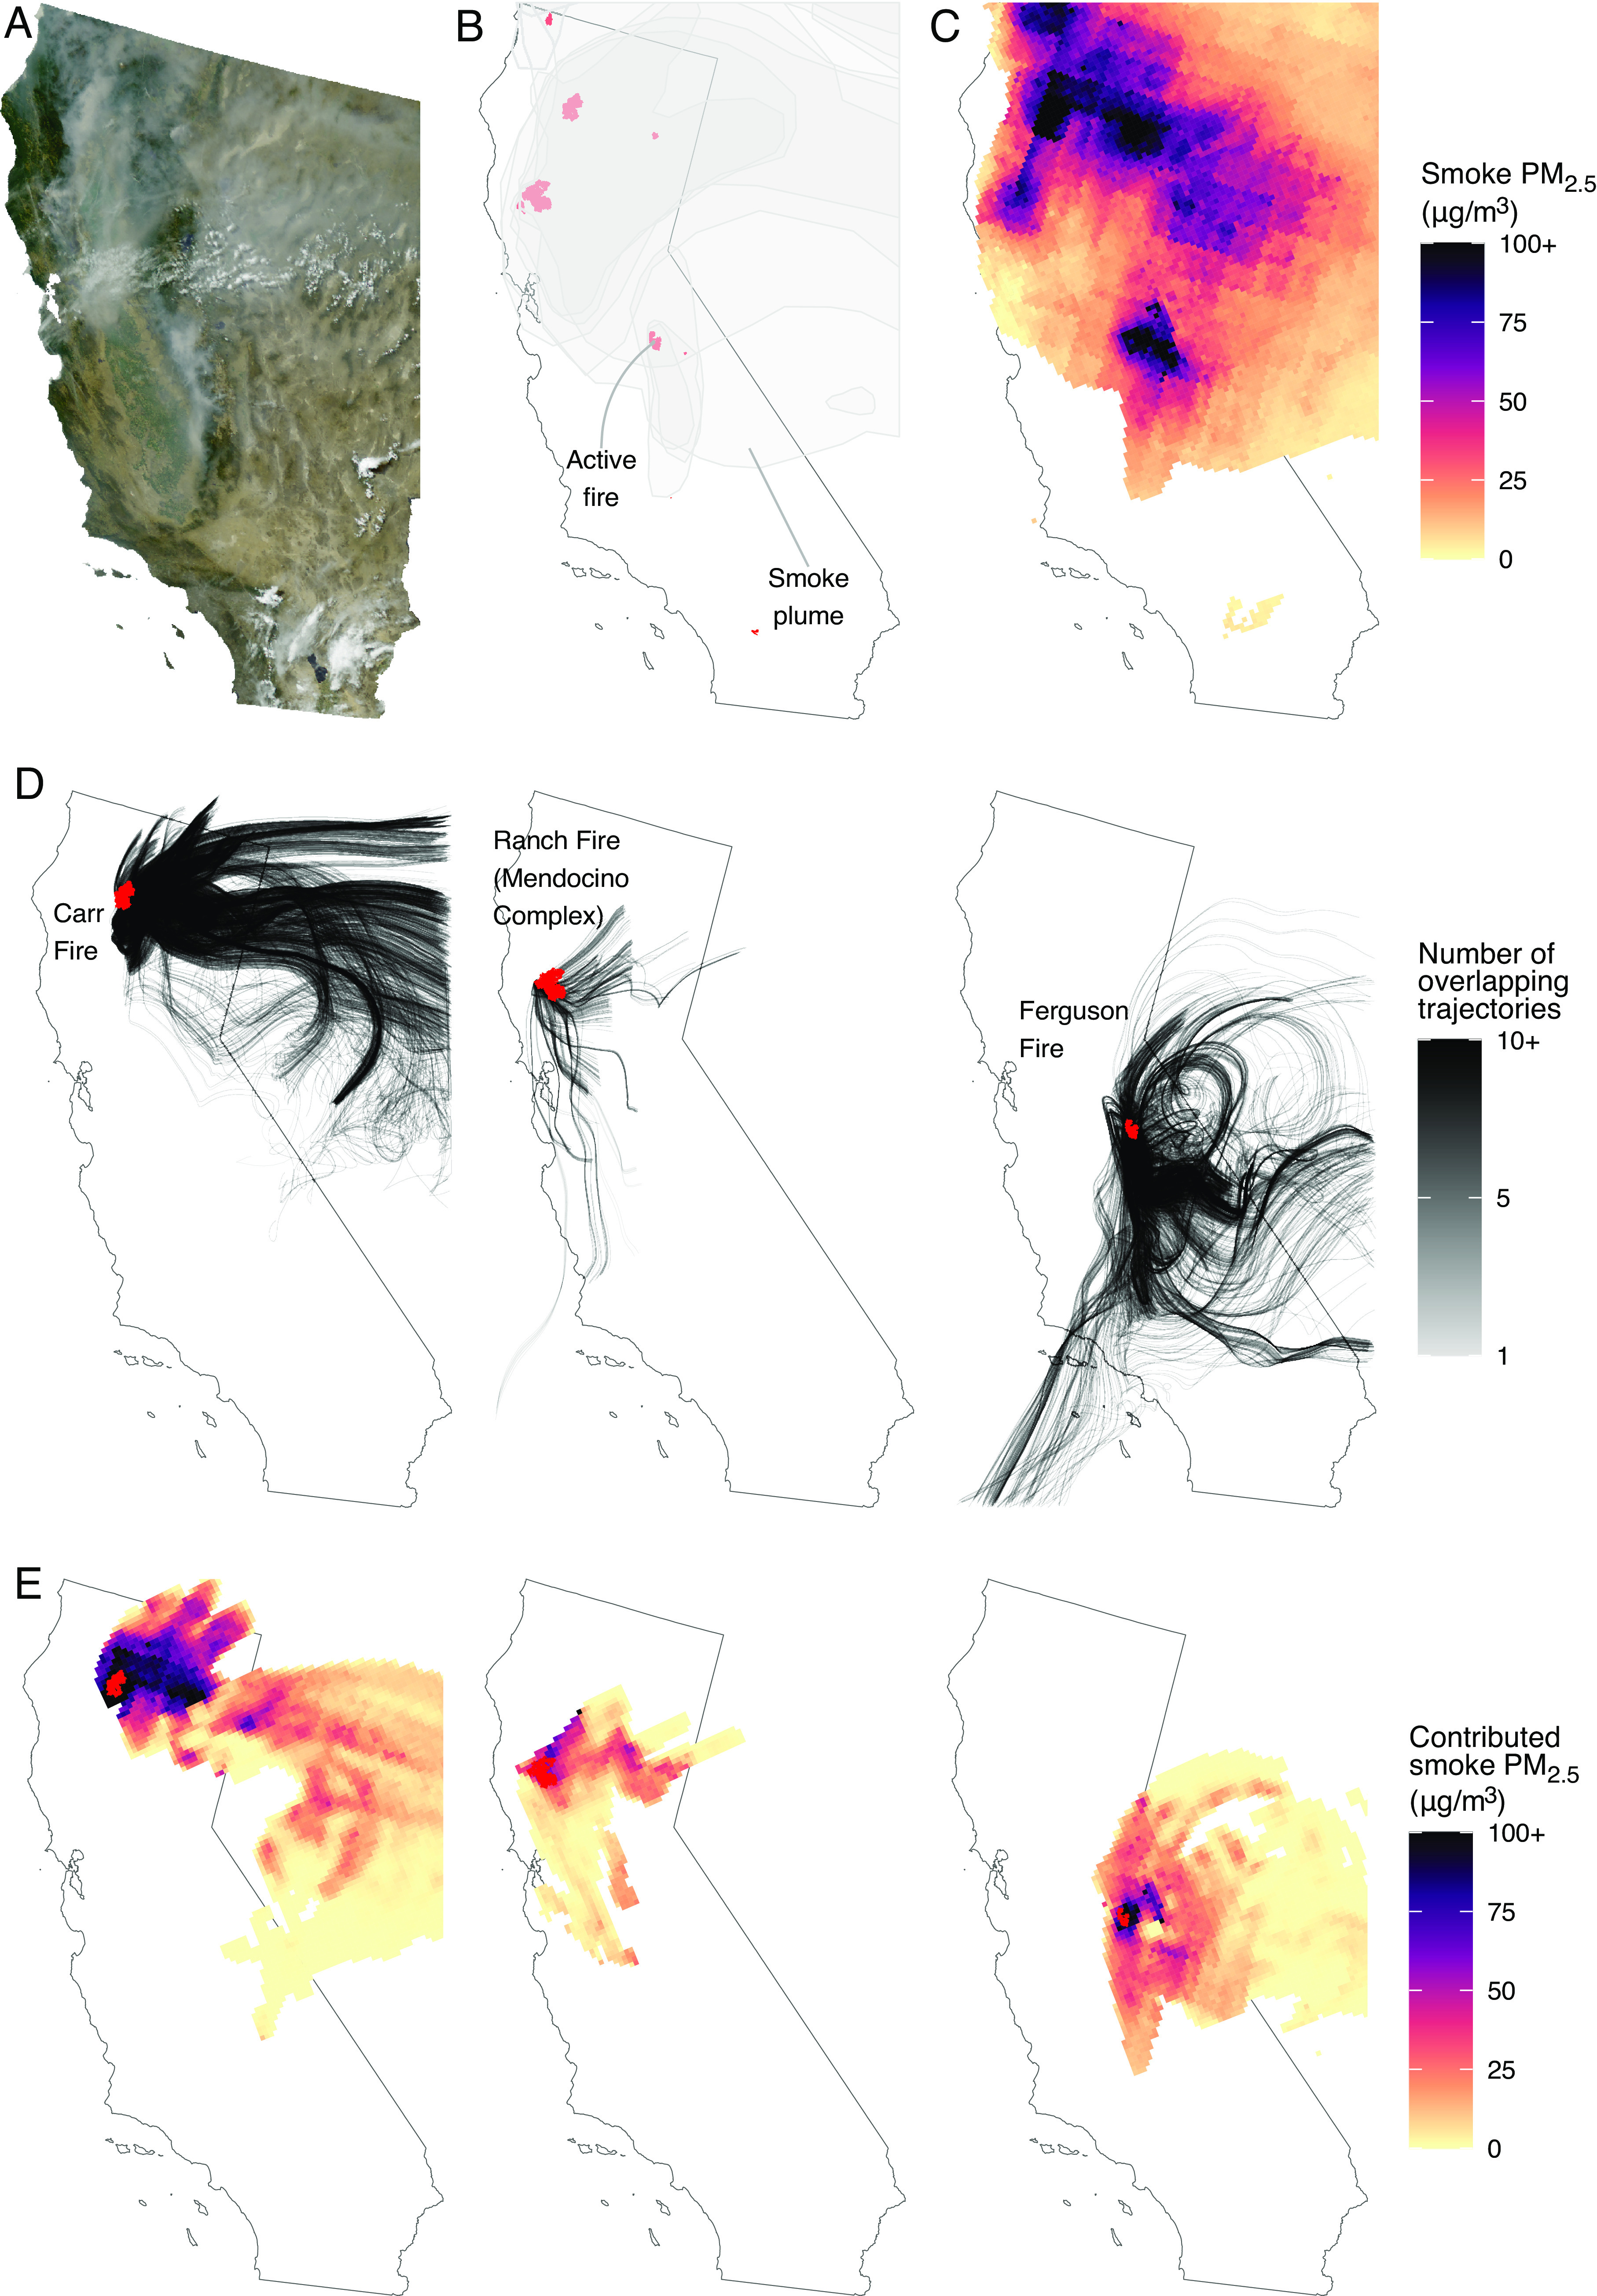
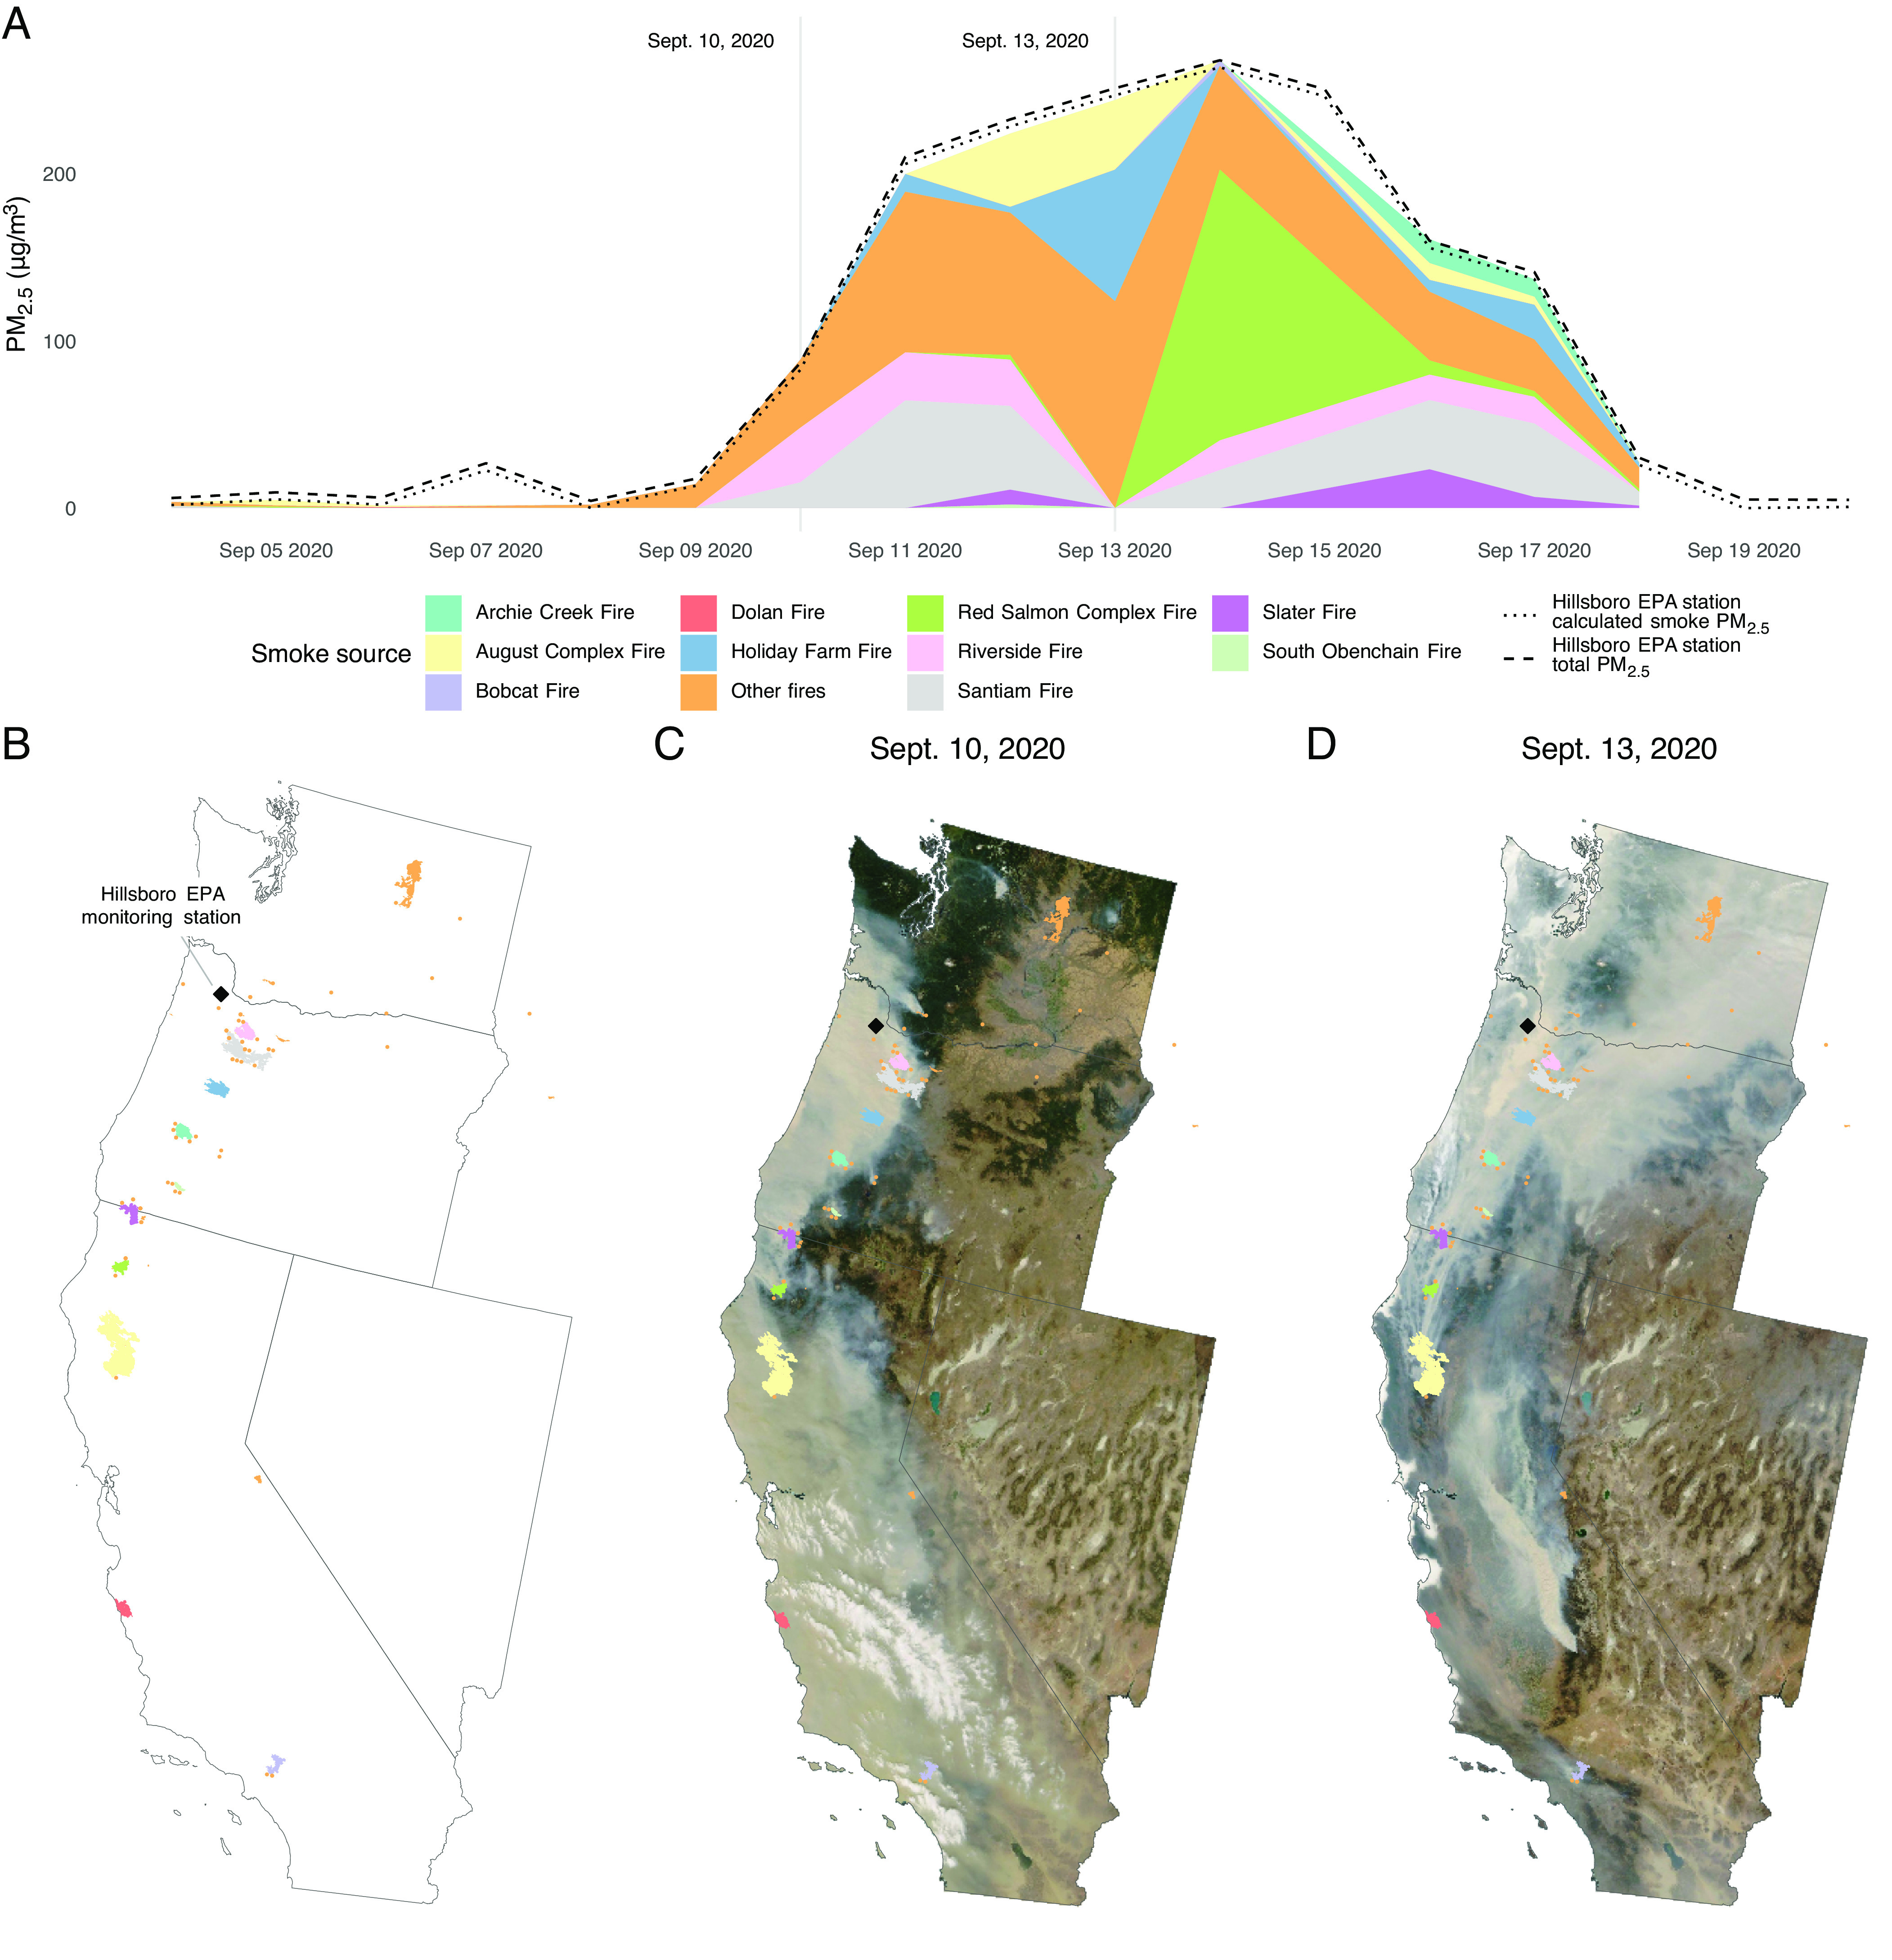
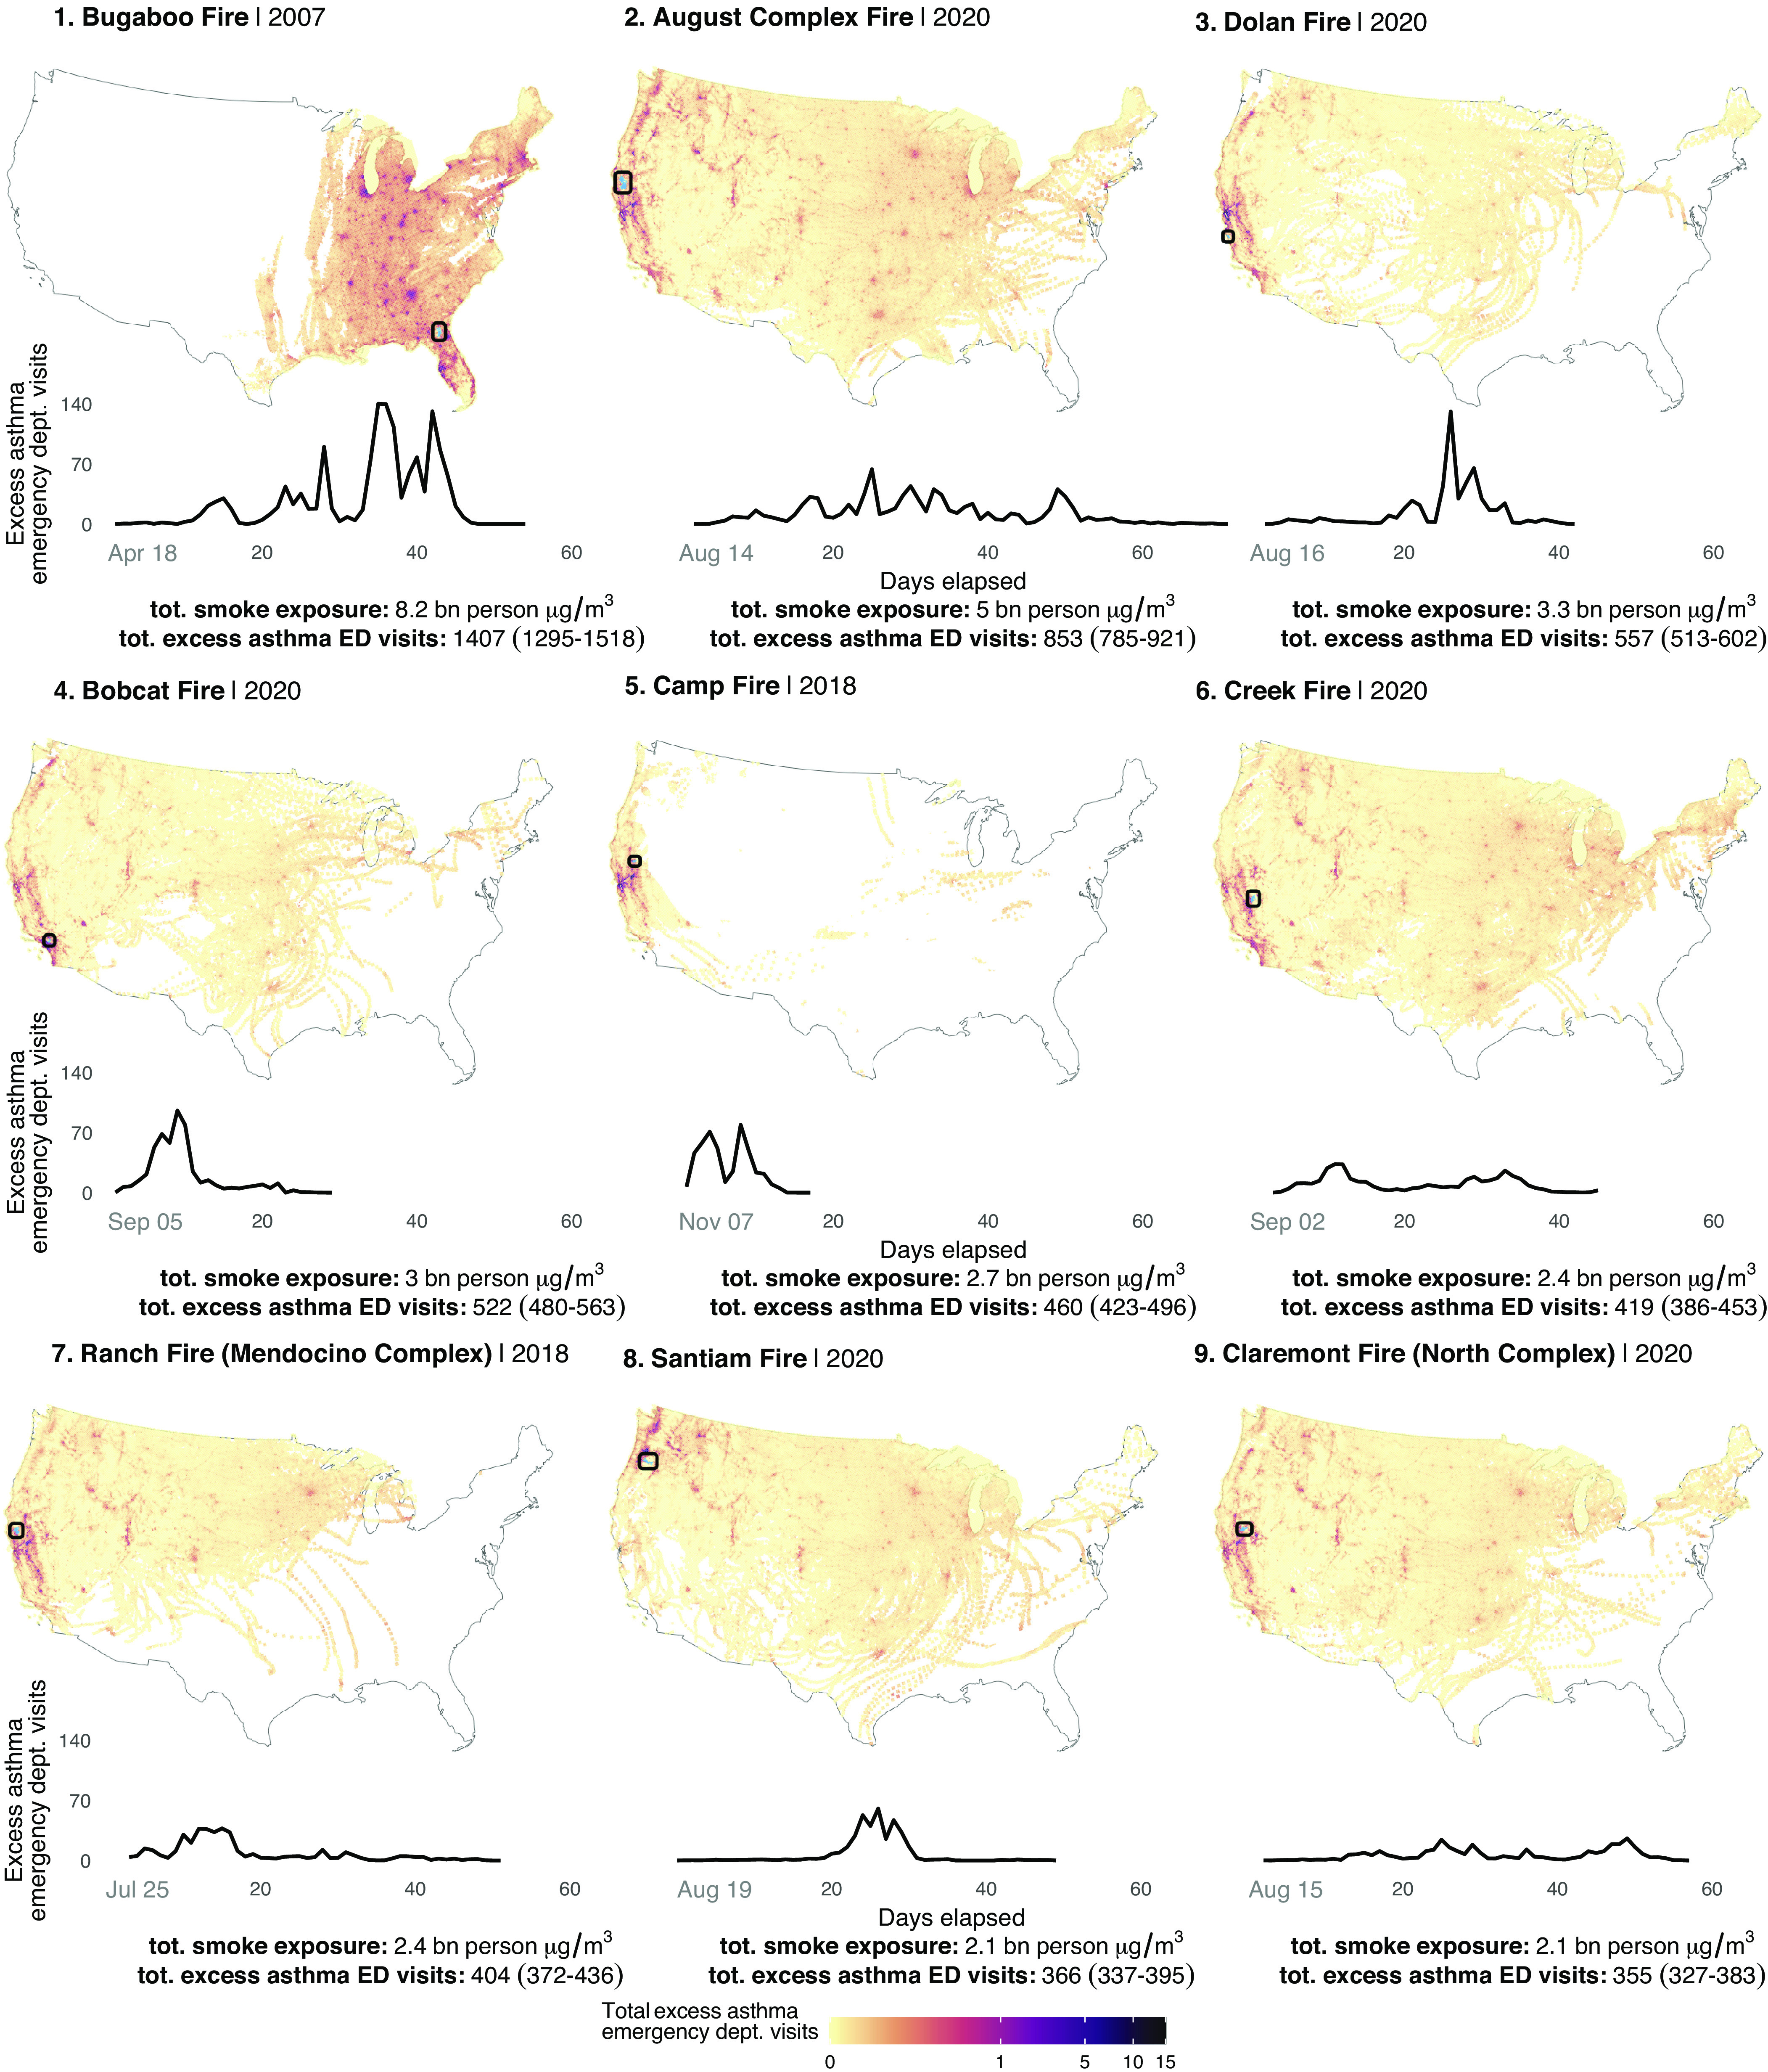
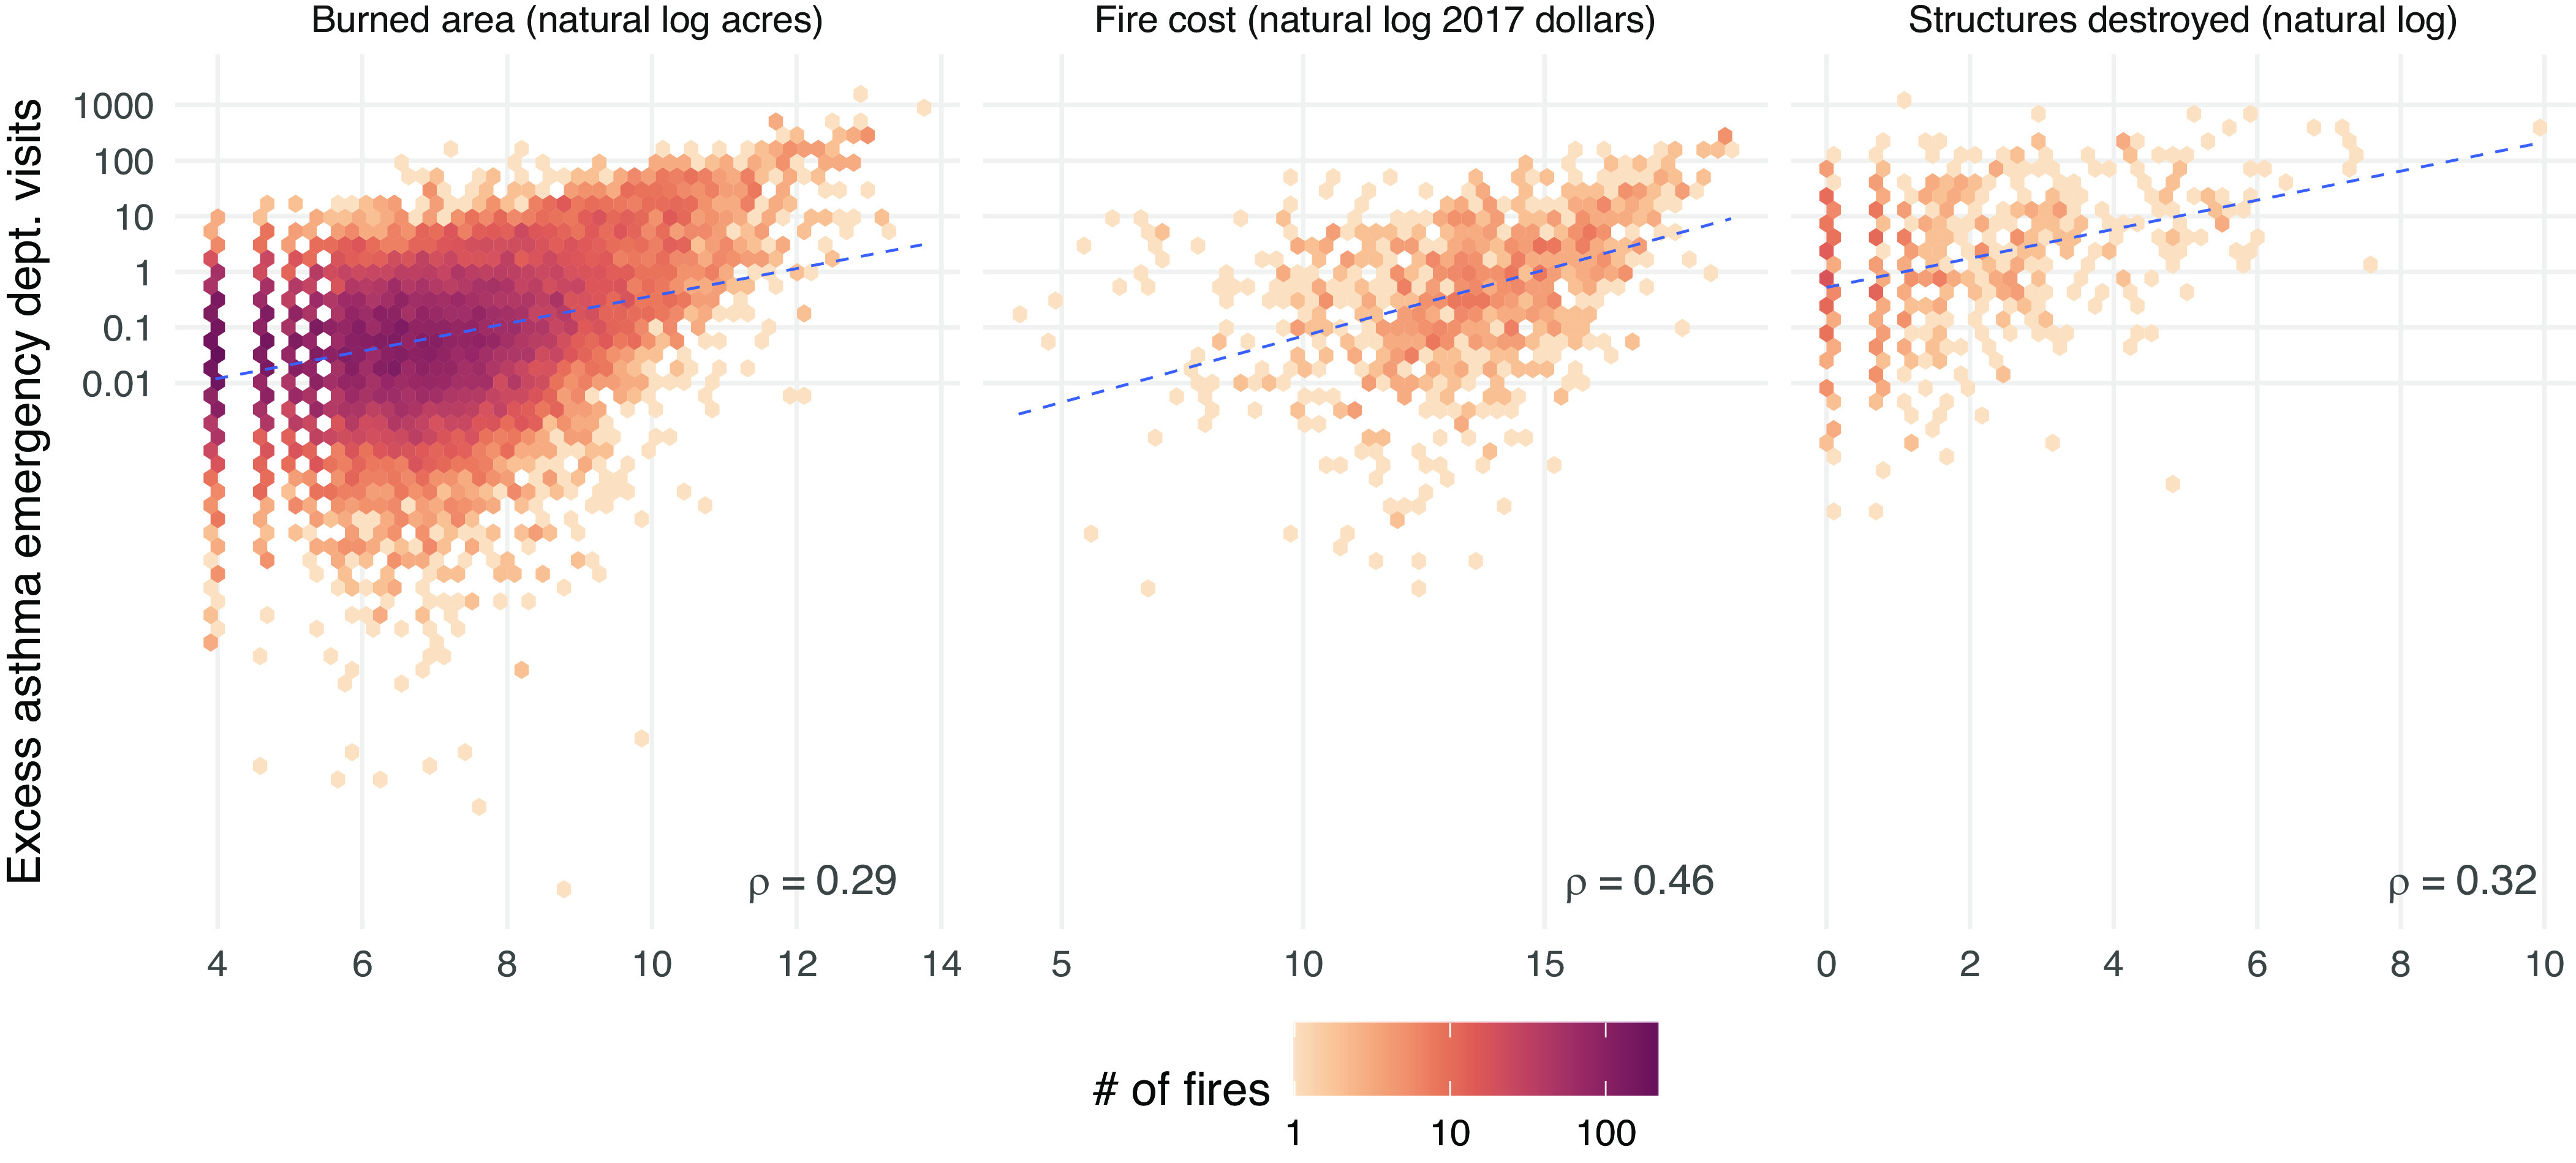
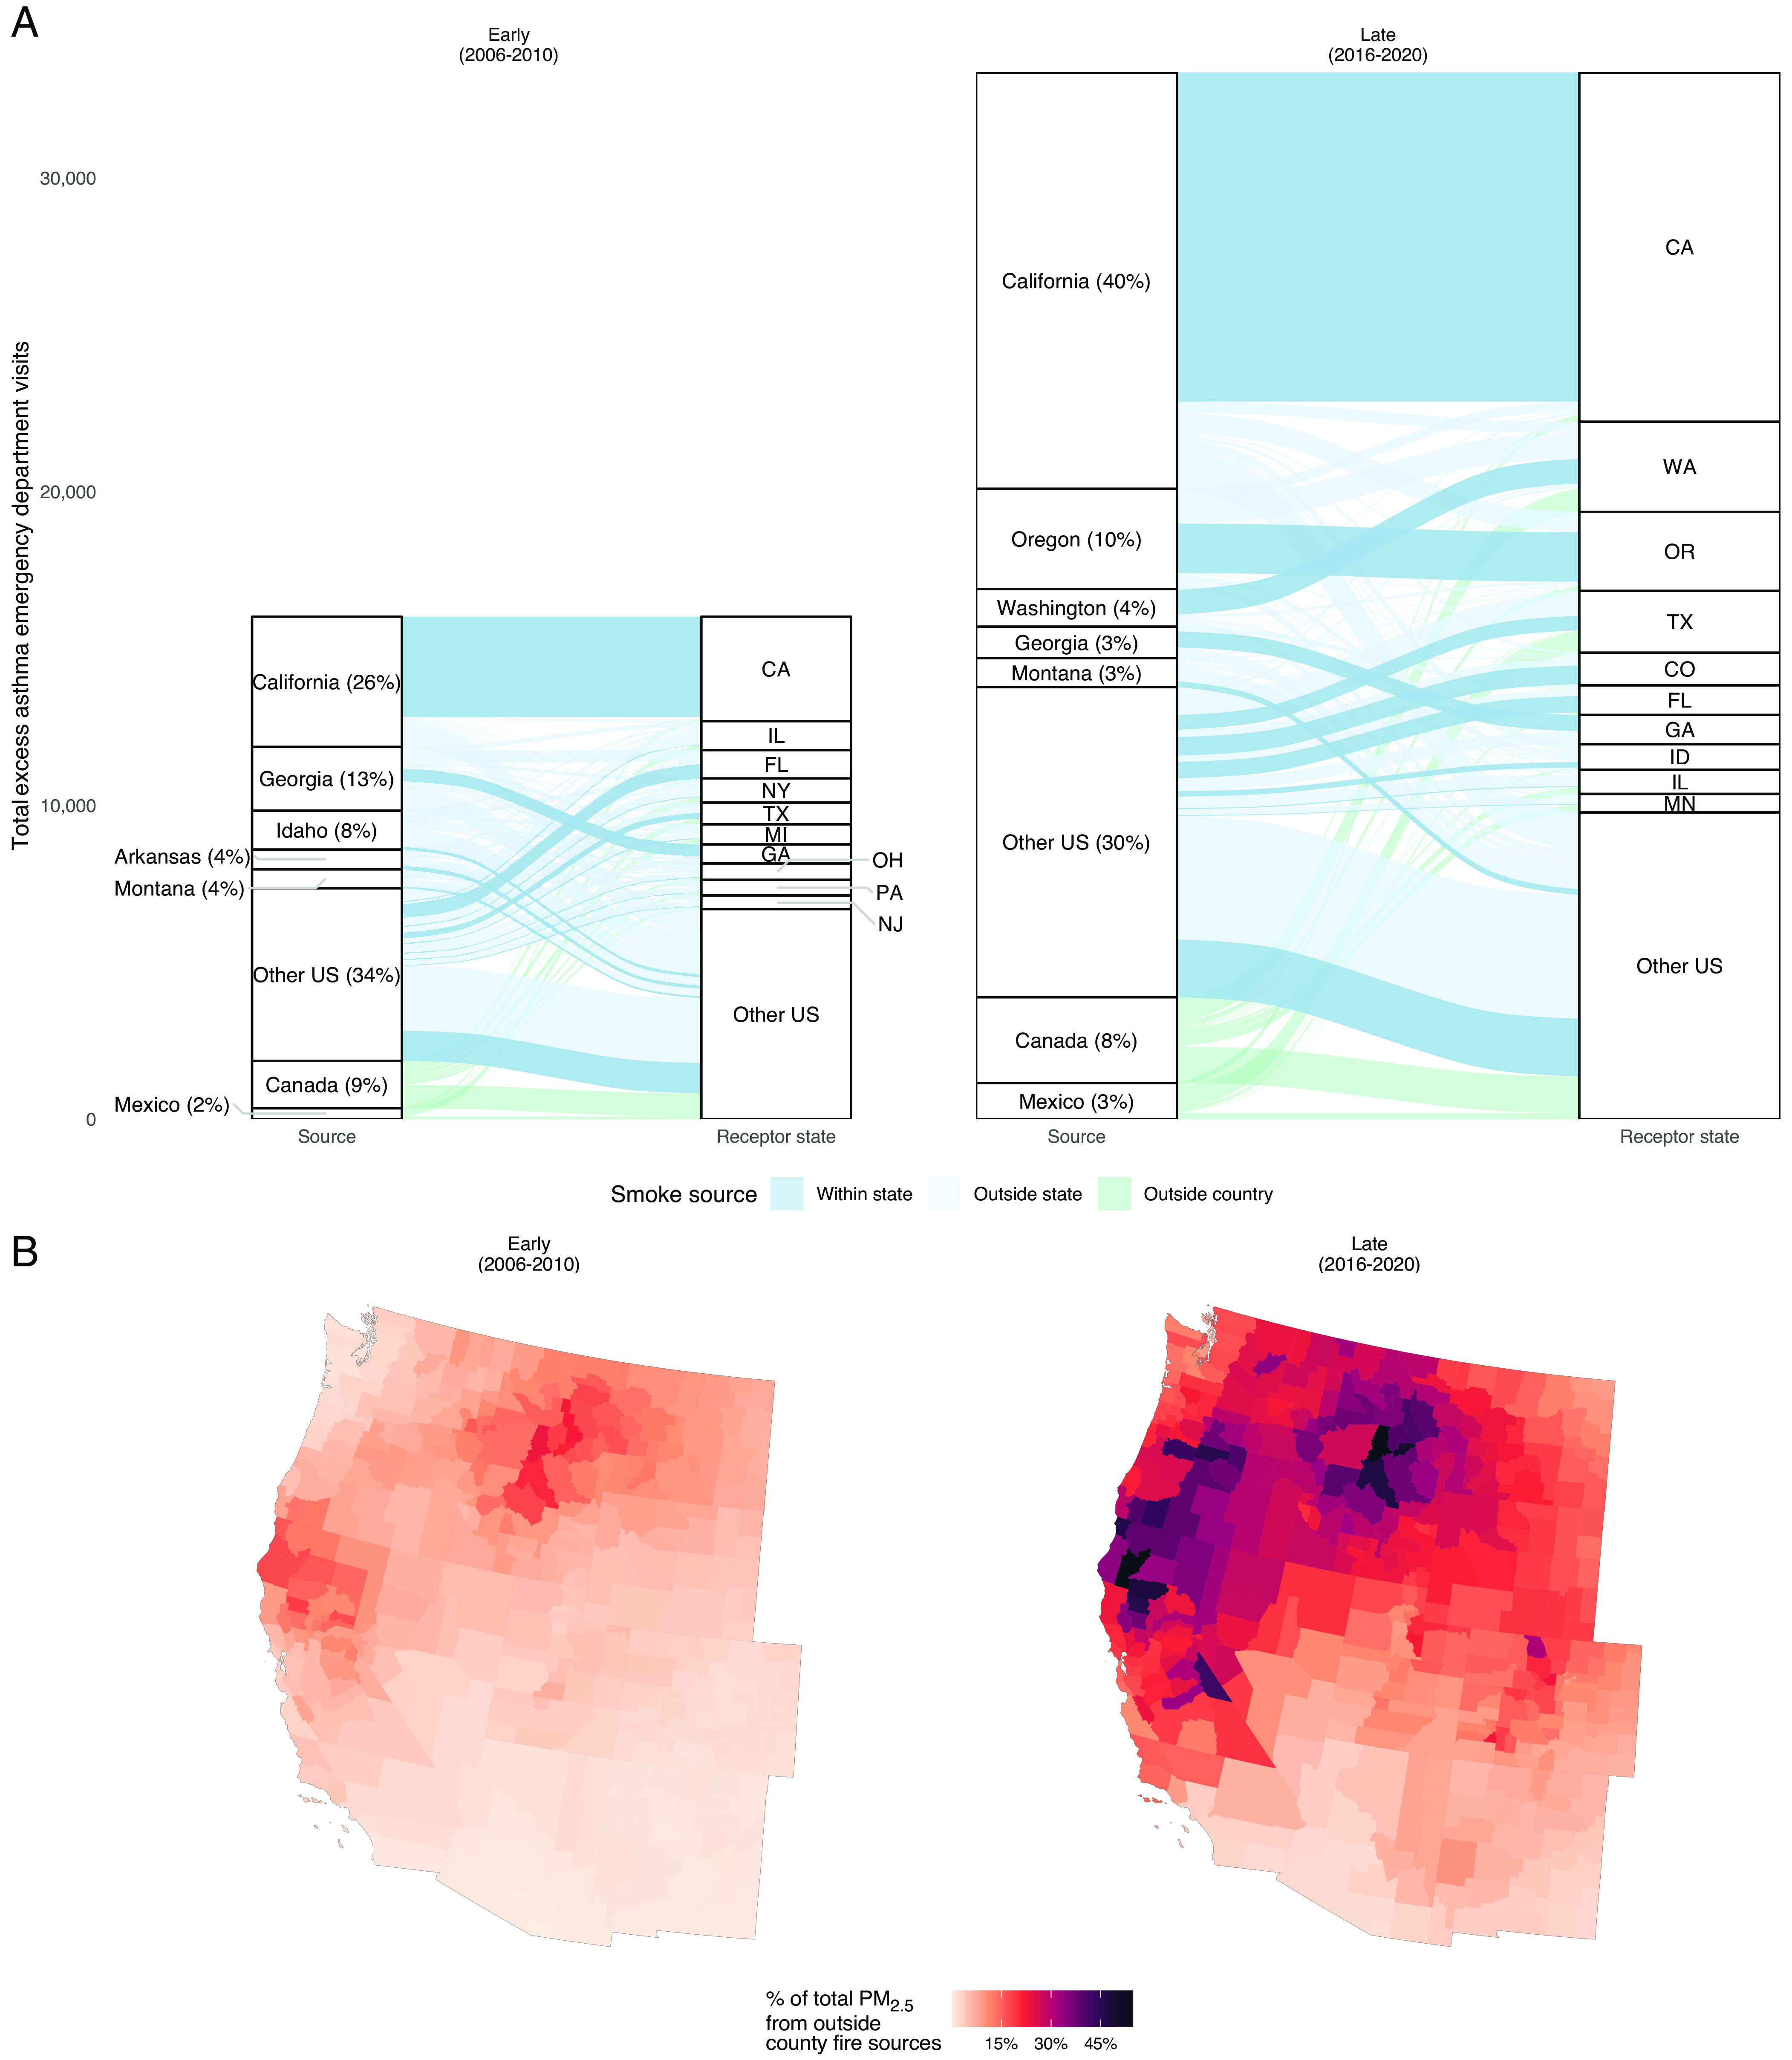
Rapidly changing wildfire regimes across the Western United States have driven more frequent and severe wildfires, resulting in wide-ranging societal threats from wildfires and wildfire-generated smoke. However, common measures of fire severity focus on what is burned, disregarding the societal impacts of smoke generated from each fire. We combine satellite-derived fire scars, air parcel trajectories from individual fires, and predicted smoke PM2.5 to link source fires to resulting smoke PM2.5 and health impacts experienced by populations in the contiguous United States from April 2006 to 2020. We quantify fire-specific accumulated smoke exposure based on the cumulative population exposed to smoke PM2.5 over the duration of a fire and estimate excess asthma-related emergency department (ED) visits as a result of this exposure. We find that excess asthma visits attributable to each fire are only moderately correlated with common measures of wildfire severity, including burned area, structures destroyed, and suppression cost. Additionally, while recent California fires contributed nearly half of the country's smoke-related excess asthma ED visits during our study period, the most severe individual fire was the 2007 Bugaboo fire in the Southeast. We estimate that a majority of smoke PM2.5 comes from sources outside the local jurisdictions where the smoke is experienced, with 87% coming from fires in other counties and 60% from fires in other states. Our approach could enable broad-scale assessment of whether specific fire characteristics affect smoke toxicity or impact, inform cost-effectiveness assessments for allocation of suppression resources, and help clarify the growing transboundary nature of local air quality.

Keywords: air pollution; climate change; health impacts; wildfire.


Conflict of interest statement

Competing interests statement:The authors declare no competing interest.

Figures

Fig. 1.
Fig. 1.
Attributing wildfire smoke PM2.5 to source fires, using active fires in CA on July 29th, 2018, as an example. (A) Geostationary satellite imagery over California with visible smoke downloaded from the Registry of Open Data on Amazon Web Services (AWS) (34). (B) Hazard Mapping System smoke plume annotations shown in gray. Active fires are shown as red polygons. (C) Wildfire smoke PM2.5 from all fires with smoke PM2.5 capped at 100 μg/m3, using data from ref. . (D) HYSPLIT trajectories for three main active fires on July 29th. Each path represents the movement of a particle that originated within the fire polygon up to 5 d before July 29th. Darker paths suggest that more particles followed that trajectory. (E) July 29th snapshot of the estimated contribution of each fire to smoke PM2.5.
Fig. 2.
Fig. 2.
Fire-specific contributions to Hillsboro EPA monitoring station readings. (A) Time-series readings from the Hillsboro EPA air pollution monitoring station show close alignment between the estimated contributed smoke PM2.5 from source fires, the “calculated smoke PM2.5”, and the total PM2.5 estimated at the monitoring station. The calculated smoke PM2.5 was used in the training process of the smoke PM2.5 product in ref. . and is estimated at the EPA station by subtracting the month-specific 3-y nonsmoke day median from the total PM2.5 readings. The sum of the contributed smoke PM2.5 aligns closely with the calculated smoke PM2.5 because the machine learning model was trained to predict this value. We direct interest readers to ref. . for more information. (BD) Satellite imagery on specific days marked by the dotted vertical lines in panel A. Imagery was downloaded from NASA’s Worldview application (https://worldview.earthdata.nasa.gov), part of NASA’s Earth Observing System Data and Information System (EOSDIS) (35).
Fig. 3.
Fig. 3.
Top fires ranked by number of estimated attributable excess asthma ED visits from April 2006 to 2020. Each small multiple map shows the total health impacts measured by the number of excess asthma ED visits from wildfire smoke PM2.5 aggregated over the duration of the fire (with 95% confidence interval in parentheses). This estimate considers the amount of smoke PM2.5, the population affected, and the total number of days of smoke exposure. The line chart shows the estimated asthma-related ED visits from smoke PM2.5 over time from the initial day of the fire. Initial fire locations are cyan colored and outlined in black.
Fig. 4.
Fig. 4.
Comparison between common fire-related severity metrics and attributed excess asthma ED visits. From Left to Right, the panels show the relationship between the natural log of burned area (acres), fire suppression cost (2017 dollars), or structures destroyed (# structures) vs. the number of excess asthma ED visits from smoke PM2.5 with the color of the hexbin indicating the count of individual fires. In the Left plot, the burned area is calculated from the GlobFire dataset for fires from April 2006 to 2020 (n = 18,606). For the center plot, only fires greater than 300 acres burned from April 2006 to 2016 in the Western United States are shown due to inconsistent fire suppression cost data for smaller fires and the limited time frame of the fire cost source dataset (n = 984). The Right plot shows available data on destroyed structures data for the contiguous United States from April 2006 to 2020 (n = 558). The blue dotted lines represent the fitted regression lines.
Fig. 5.
Fig. 5.
Interstate transport of smoke PM2.5 and contribution of transboundary smoke to total PM2.5 concentrations. (A) Alluvial diagram of smoke PM2.5 from source to receptor states in the early (2006 to 2010) and late (2016 to 2020) periods. Percentages represent the % of total excess asthma ED visits from smoke PM2.5 contributed by that state. The dark blue flows represent within state, light blue outside state, and green flows outside country transport of smoke PM2.5. (B) The fraction of total PM2.5 from source fires that are outside of the county in the early (2006 to 2010) and late (2016 to 2020) periods has grown dramatically, especially across the Pacific Northwest, California, Idaho, and Montana.

References

    1. Abatzoglou J. T., Williams A. P., Impact of anthropogenic climate change on wildfire across Western US forests. Proc. Natl. Acad. Sci. U.S.A. 113, 11770–11775 (2016). - PMC - PubMed
    1. Ford Bonne, et al. , Future fire impacts on smoke concentrations, visibility, and health in the contiguous United States. GeoHealth 2, 229–247 (2018). - PMC - PubMed
    1. Reid C. E., Maestas M. M., Wildfire smoke exposure under climate change: Impact on respiratory health of affected communities. Curr. Opin. Pulm. Med. 25, 179 (2019). - PMC - PubMed
    1. Aguilera R., Corringham T., Gershunov A., Benmarhnia T., Wildfire smoke impacts respiratory health more than fine particles from other sources: Observational evidence from Southern California. Nat. Commun. 12, 1–8 (2021). - PMC - PubMed
    1. Buchholz R. R., et al. , New seasonal pattern of pollution emerges from changing North American wildfires. Nat. Commun. 13, 1–9 (2022). - PMC - PubMed