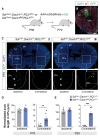
. 2024 Feb 21;112(4):558-573.e8.
doi: 10.1016/j.neuron.2023.11.013. Epub 2023 Dec 11.

Cortical somatostatin long-range projection neurons and interneurons exhibit divergent developmental trajectories

Affiliations

Cortical somatostatin long-range projection neurons and interneurons exhibit divergent developmental trajectories

Josephine Fisher et al. Neuron. .

Abstract

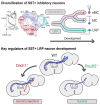
The mammalian cerebral cortex contains an extraordinary diversity of cell types that emerge by implementing different developmental programs. Delineating when and how cellular diversification occurs is particularly challenging for cortical inhibitory neurons because they represent a small proportion of all cortical cells and have a protracted development. Here, we combine single-cell RNA sequencing and spatial transcriptomics to characterize the emergence of neuronal diversity among somatostatin-expressing (SST+) cells in mice. We found that SST+ inhibitory neurons segregate during embryonic stages into long-range projection (LRP) neurons and two types of interneurons, Martinotti cells and non-Martinotti cells, following distinct developmental trajectories. Two main subtypes of LRP neurons and several subtypes of interneurons are readily distinguishable in the embryo, although interneuron diversity is likely refined during early postnatal life. Our results suggest that the timing for cellular diversification is unique for different subtypes of SST+ neurons and particularly divergent for LRP neurons and interneurons.

Keywords: GABA; cell fate; cerebral cortex; development; interneuron; mouse; somatostatin; specification.


Conflict of interest statement

Declaration of interests The authors declare no competing interests.

Figures
Graphical abstract
Graphical abstract
Figure 1
Figure 1. The diversity of cortical SST+ inhibitory neurons emerges in early development
(A) Schema of experimental design. Enrichment of SST+ neurons by dissection of the neocortex (NCx) from SstCre/+;RCE mice followed by FACS. (B) Integration of SST+ neurons from E16.5, P1, and P5 and visualization by uniform manifold approximation and projection (UMAP). The annotation of cell clusters was based on marker expression. (C) Heatmap illustrating differentially expressed genes (DEGs) enriched in each cluster. (D) Examples of gene expression of markers for LRP neurons, MCs, and nMCs visualized by UMAP.
Figure 2
Figure 2. SST+ subtype diversity in previously published datasets
(A and B) Clustering of cortical SST+ cells into types (A) and subtypes (B) in the E16.5, P1, and P5 datasets (this study) and the P10 dataset. In the latter case, clusters were reannotated using the classifier models described in this study. (C) Violin plots of selected cell-type markers comparing SST+ cells in the E16.5, P1, and P5 datasets (this study) and the P10 dataset. (D) Distribution of each subtype in the E16.5, P1, and P5 datasets (this study) and the P10 dataset.
Figure 3
Figure 3. Alignment of developmental SST+ cell types and subtypes to their corresponding adult counterparts
(A) Heatmap illustrating transcriptomic similarities (AUROC values) between the developmental SST+ cell clusters identified in this study and adult SST+ cell clusters, as defined in Mayer et al. The adult dataset includes SST+ cells from Tasic et al., with clear correspondence to the MET subtypes defined in Mayer et al. (B) River plot of adult Sst-MET types with the developmental SST+ cell clusters identified in this study using an AUROC value larger than 0.75. (C) Heatmap illustrating AUROC values between developmental and adult populations of LRP neurons, attained through MetaNeighbor analysis using the intersection of DEGs between groups. (D) UMAP of LRP cells in the adult (cells from Yao et al.) and developing mouse neocortex. (E) UMAP depicting the expression of LRP neuron marker genes in the adult (top) and developing (bottom) mouse neocortex.
Figure 4
Figure 4. Differential gene expression delineates distinct developmental trajectories for SST+ GABAergic neurons
(A) Schematic drawing illustrating gene module filtering for identifying developmentally relevant genes. Genes were grouped into modules by hierarchical clustering and then iteratively discarded based on quality criteria. GO term functional enrichment revealed that the developmental gene module (Table S2) relates to synapse formation and neuronal differentiation. (B) UMAP plots illustrating pseudotime value, sample age, and cell type. (C) Gene expression over pseudotime trajectories, plotted for a selection of gene markers for the three main SST+ cell types. Nos1, Reln, and Erbb4 are most enriched along the LRP, MC, and nMC branches. (D) Heatmaps depicting genes changing during development that are (1) differentially expressed among cell types (i.e., branch-specific genes), (2) differentially expressed between LRP neurons and interneurons, and (3) shared by all SST+ GABAergic neurons.
Figure 5
Figure 5. Spatial transcriptomics reveals the laminar distribution of SST+ subtypes at P5
(A) Schema illustrating molecular cartography of 94 genes (Table S4) using unique color barcoding (Resolve Biosciences). Each cell was segmented using the DAPI signal. Gene expression is visualized by UMAP. The bottom plots illustrate the expression profiles of Sst, Gad1, Gad2, and Lhx6 among all neurons, which were used to filter SST+ neurons. (B) Coronal section through the P5 mouse neocortex illustrating the expression of selected marker genes using molecular cartography. (C) UMAP visualization of 2,319 SST+ positive neurons, clustered and annotated based on the strongest correlation to subtypes defined through scRNA-seq (Figure 1). (D) Dot-plot diagram representing the laminar location of cells in each cluster. (E) Comparison of the laminar distribution of each spatial cluster at P5 and its corresponding adult Sst-MET type. Fisher exact test: *p < 0.05, **p <0.01, ***p < 0.001. Scale bars, 100 μm.
Figure 6
Figure 6. Conditional deletion of Dach1 from SST+ neurons abnormally increases their contralateral axonal projections
(A) Schematic of the experimental design. (B) Coronal section through the injection site stained with antibodies against tdTomato and GFP. DAPI staining reveals the distribution of nuclei. (C) Coronal sections through the mouse telencephalon stained with antibodies against GFP in control and Dach1 conditional mutants at P70. DAPI staining reveals the distribution of nuclei. The high-magnification images illustrate axons (arrowheads) in the striatum (CPu). (D and E) Quantification of total axonal length in ipsilateral and contralateral striatum normalized by the number of infected cells in each animal (n = 6 mice per genotype) at P70 (D) and P29 (E). Two-tailed t test: *p < 0.05. Data are shown as mean ± SEM. Scale bars, 200 μm.
Figure 7
Figure 7. Conditional deletion of Pou3f2 from SST+ neurons progressively reduces the density of LRP neurons
(A) Coronal sections through the mouse telencephalon stained with antibodies against NOS1 in control and Pouf3f2 conditional mutants at P5 and P21. DAPI staining reveals the distribution of nuclei. (B) Quantification of the density of NOS1+ cells in the motor cortex (M1), somatosensory cortex (S1), and visual cortex (V1) at P5 (n = 5 mice per genotype) and P21 (n = 6 mice per genotype). Student’s t test with Bonferroni: *p < 0.05, **p < 0.01. (C) Schematic representation of the spatial distribution of LRP neurons across the entire motor cortex in control and Pouf3f2 conditional mutants P21. (D) Normalized reduction of LRP neurons in M1, S1, and V1 from P5 to P21. Two-way ANOVA: *p < 0.05, **p < 0.01. Data are shown as mean ± SEM. Scale bars, 500 μm.
Figure 8
Figure 8. Sox2 levels are reduced in long-range cells in Pou3f2 conditional mutant
(A) Coronal sections through the telencephalon of P5 SstCre/+;RCE mice stained with antibodies against Sox2, NOS1, and GFP. (B) Quantification of Sox2 intensity measurement in SST+ LRP neurons and SST+ interneurons. Student’s t test: ***p < 0.001. (C) Coronal sections through the mouse telencephalon stained with antibodies against Sox2 and NOS1 in control and Pou3f2 conditional mutants at P5. DAPI staining reveals the distribution of nuclei. High-magnification images illustrate Sox2 intensity levels in NOS1+ neurons. (D) Quantification of Sox2 intensity levels (n = 3 mice per genotype). Student’s t test: **p < 0.01. (E) Quantitative polymerase chain reaction analysis of Pou3f2, Pou3f3, and Sox2 in SST+ neurons of Pou3f2 conditional mutants and litter controls at P5. Pou3f2 mutants were normalized to the average value of Pou3f2 control animals. Pou3f3 was used as a control. Student’s t test: **p < 0.01, ***p < 0.001. Data are shown as mean ± SEM. Scale bars, 200 and 50 μm (inserts).

References

    1. BRAIN Initiative Cell Census Network (BICCN) A multimodal cell census and atlas of the mammalian primary motor cortex. Nature. 2021;598:86–102. doi: 10.1038/s41586-021-03950-0. - DOI - PMC - PubMed
    1. Gouwens NW, Sorensen SA, Baftizadeh F, Budzillo A, Lee BR, Jarsky T, Alfiler L, Baker K, Barkan E, Berry K, et al. Integrated morphoelectric and transcriptomic classification of cortical GABAergic cells. Cell. 2020;183:935–953.:e19. doi: 10.1016/j.cell.2020.09.057. - DOI - PMC - PubMed
    1. Klausberger T, Somogyi P. Neuronal diversity and temporal dynamics: the unity of hippocampal circuit operations. Science. 2008;321:53–57. doi: 10.1126/science.1149381. - DOI - PMC - PubMed
    1. Mayer C, Hafemeister C, Bandler RC, Machold R, Batista-Brito R, Jaglin X, Allaway K, Butler A, Fishell G, Satija R. Developmental diversification of cortical inhibitory interneurons. Nature. 2018;505:1–25. doi: 10.1038/nature25999. - DOI - PMC - PubMed
    1. Shi Y, Wang M, Mi D, Lu T, Wang B, Dong H, Zhong S, Chen Y, Sun L, Zhou X, et al. Mouse and human share conserved transcriptional programs for interneuron development. Science. 2021;374:eabj6641. - PMC - PubMed