

Protein signaling and drug target activation signatures to guide therapy prioritization: Therapeutic resistance and sensitivity in the I-SPY 2 Trial
- PMID: 38086377
- PMCID: PMC10772394
- DOI: 10.1016/j.xcrm.2023.101312
Protein signaling and drug target activation signatures to guide therapy prioritization: Therapeutic resistance and sensitivity in the I-SPY 2 Trial
Abstract
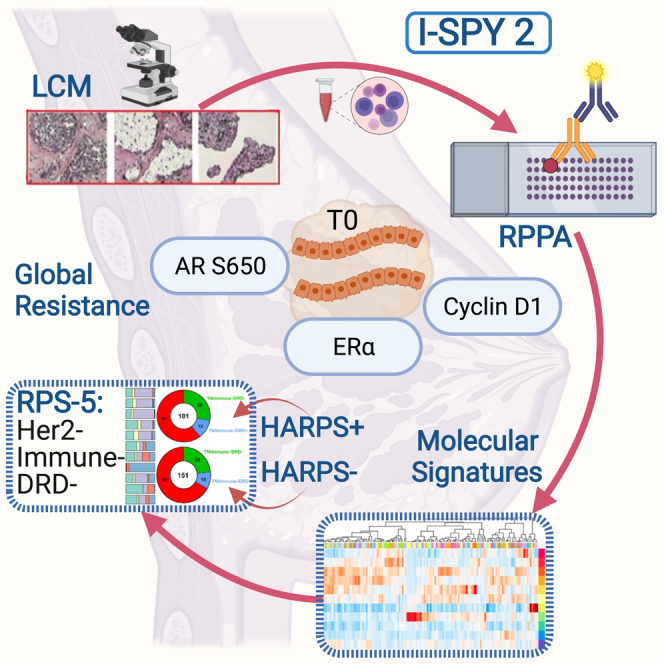
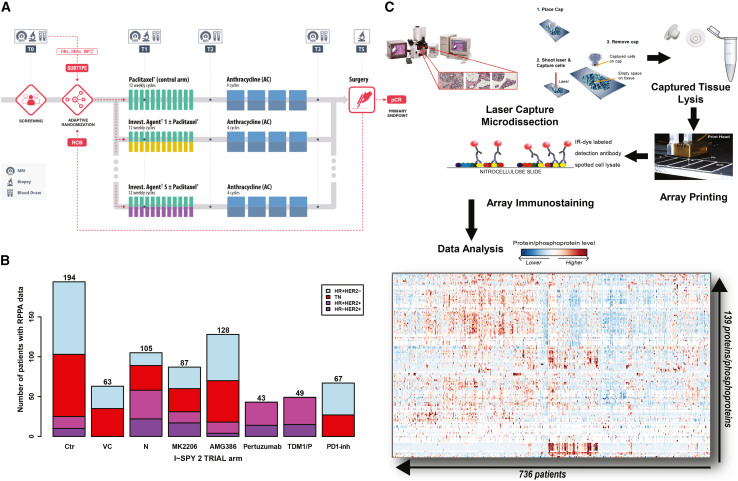
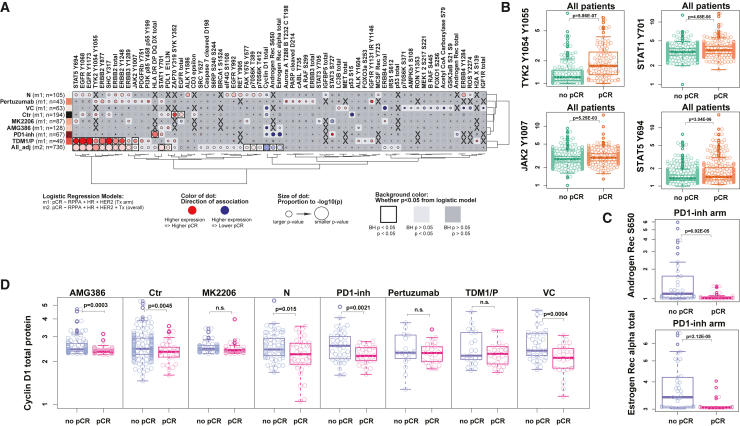
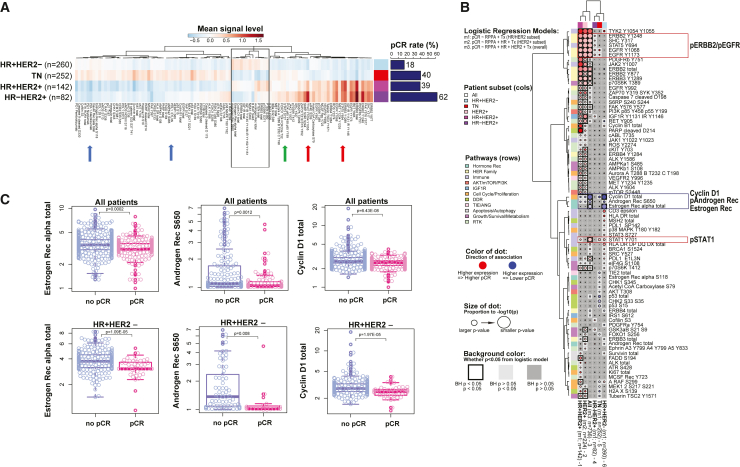
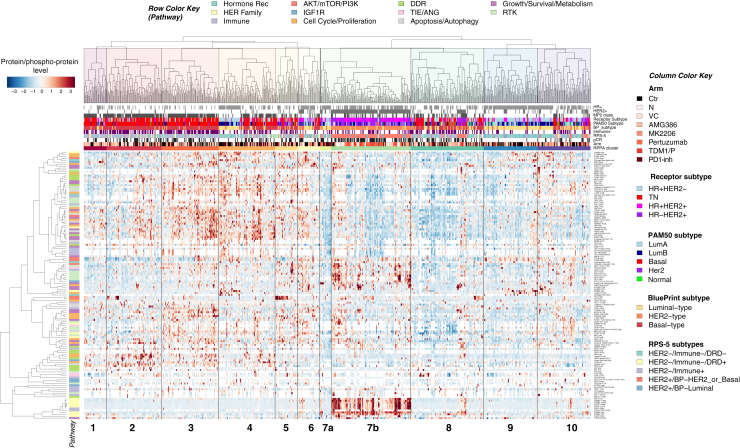
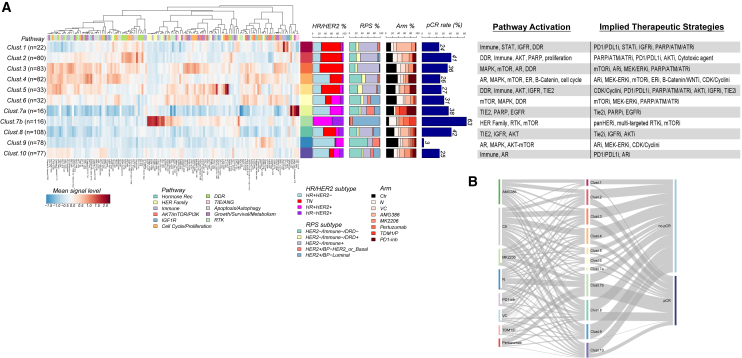
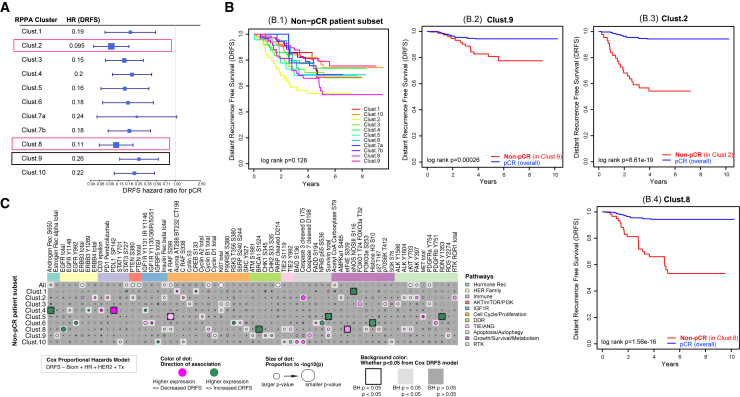
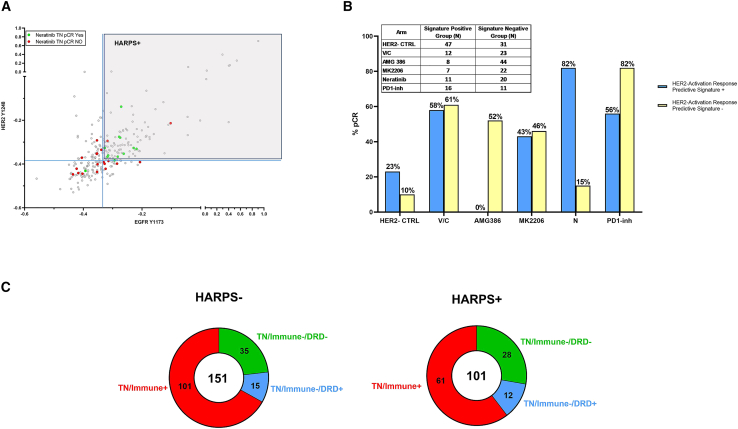
Molecular subtyping of breast cancer is based mostly on HR/HER2 and gene expression-based immune, DNA repair deficiency, and luminal signatures. We extend this description via functional protein pathway activation mapping using pre-treatment, quantitative expression data from 139 proteins/phosphoproteins from 736 patients across 8 treatment arms of the I-SPY 2 Trial (ClinicalTrials.gov: NCT01042379). We identify predictive fit-for-purpose, mechanism-of-action-based signatures and individual predictive protein biomarker candidates by evaluating associations with pathologic complete response. Elevated levels of cyclin D1, estrogen receptor alpha, and androgen receptor S650 associate with non-response and are biomarkers for global resistance. We uncover protein/phosphoprotein-based signatures that can be utilized both for molecularly rationalized therapeutic selection and for response prediction. We introduce a dichotomous HER2 activation response predictive signature for stratifying triple-negative breast cancer patients to either HER2 or immune checkpoint therapy response as a model for how protein activation signatures provide a different lens to view the molecular landscape of breast cancer and synergize with transcriptomic-defined signatures.
Keywords: LCM; RPPA; biomarker; breast cancer; clinical trial; drug target; neoadjuvant; phosphoprotein; protein; resistance.
Copyright © 2023 The Author(s). Published by Elsevier Inc. All rights reserved.
Conflict of interest statement
Declaration of interests J.W. reports honoraria from DAVA Oncology, consults for Baylor College of Medicine, has ownership in Theralink, and is co-inventor of RPPA technology and p-HER2 and -EGFR response predictors with filed patents. C.Y. consults for NantOmics, LLC. M.C.L. reports support from Eisai, Genentech, GRAIL, Menarini Silicon Biosystems, Merck, Novartis, Seattle Genetics, and Tesaro. W.F.S. is a co-founder of Delphi Diagnostics and co-inventor/patent holder for a free residual cancer burden calculator, holds shares in IONIS Pharmaceuticals and Eiger Biopharmaceuticals, and is an unpaid advisor/steering committee member for Roche trials. H.S.R. reports support from Pfizer, Merck, Novartis, Lilly, Roche, Daiichi, Seattle Genetics, Macrogenics, Sermonix, Boehringer Ingelheim, Polyphor, AstraZeneca, Astellas, and Gilead; honoraria from Puma Biotechnology, Samsung, Chugai, Blueprint, and NAPO; and travel support from GE Healthcare. C.I. consults for Seattle Genetics, Genentech, AstraZeneca, Novartis, PUMA, Pfizer, and Esai. A.M.D. reports support from Novartis, Pfizer, Genentech, Calithera, and Menarini. D.Y. receives unrelated support from Boehringer Ingleheim and consults with Martell Diagnostics unrelated to this topic. P.R.P. reports leadership and stock in Immunonet BioSciences and honoraria from ASCO, Dava Oncology, OncLive (Courses), and Frontiers (Editorship); consults for Personalized Cancer Therapy, Immunonet BioSciences, Sirtex, CARIS Lifesciences, OncoPlex Diagnostics, Pfizer, Heron, Puma, AbbVie, BOLT, and SEAGEN; and is an occasional speaker for Genentech and Roche. G.L.H. is a partner and holds stock (<1%) in NanoString, Moderna, Gilead Sciences, and Exact Sciences. L.J.E. is an unpaid member of the board of directors of Quantum Leap Healthcare Collaborative, received grant support for the I-SPY 2 trial, is on the Blue Cross/Blue Shield Medical Advisory Panel and receives support for time and travel, and receives unrelated research support from Merck. L.J.v.V. is a part-time employee and stockholder of Agendia, NV. E.F.P. reports leadership, stock/ownership, and consulting/advisory and travel funds from Theralink Technologies, Inc., Perthera, Inc., and Ceres Nanosciences, Inc.; support from Ceres Nanosciences, GlaxoSmithKline, Abbvie, Symphogen, Deciphera Pharmaceuticals, Inc, Springworks Therapeutics, Inc, Mirati, Inc. and Genentech; patents/royalties from NIH; and patents/roylaties for anti-HER2/EGFR and anti-mTOR response predictors.
Figures
References
-
- DeSantis C.E., Ma J., Gaudet M.M., Newman L.A., Miller K.D., Goding Sauer A., Jemal A., Siegel R.L. Breast cancer statistics, 2019. CA. Cancer J. Clin. 2019;69:438–451. - PubMed
-
- Siegel R.L., Miller K.D., Wagle N.S., Jemal A. Cancer statistics, 2023. CA. Cancer J. Clin. 2023;73:17–48. - PubMed
-
- I-SPY2 Trial Consortium. Yee D., DeMichele A.M., Yau C., Isaacs C., Symmans W.F., Albain K.S., Chen Y.Y., Krings G., Wei S., et al. Association of Event-Free and Distant Recurrence–Free Survival With Individual-Level Pathologic Complete Response in Neoadjuvant Treatment of Stages 2 and 3 Breast Cancer: Three-Year Follow-up Analysis for the I-SPY 2 Adaptively Randomized Clinical Trial. JAMA Oncol. 2020;6:1355–1362. - PMC - PubMed
Publication types
MeSH terms
Substances
Associated data
Grants and funding
LinkOut - more resources
Full Text Sources
Medical
Research Materials
Miscellaneous
