. 2023 Dec 19;4(12):101309.
doi: 10.1016/j.xcrm.2023.101309. Epub 2023 Dec 11.

Econazole selectively induces cell death in NF1-homozygous mutant tumor cells

Affiliations

Econazole selectively induces cell death in NF1-homozygous mutant tumor cells

Yenal B Lakes et al. Cell Rep Med. .

Abstract

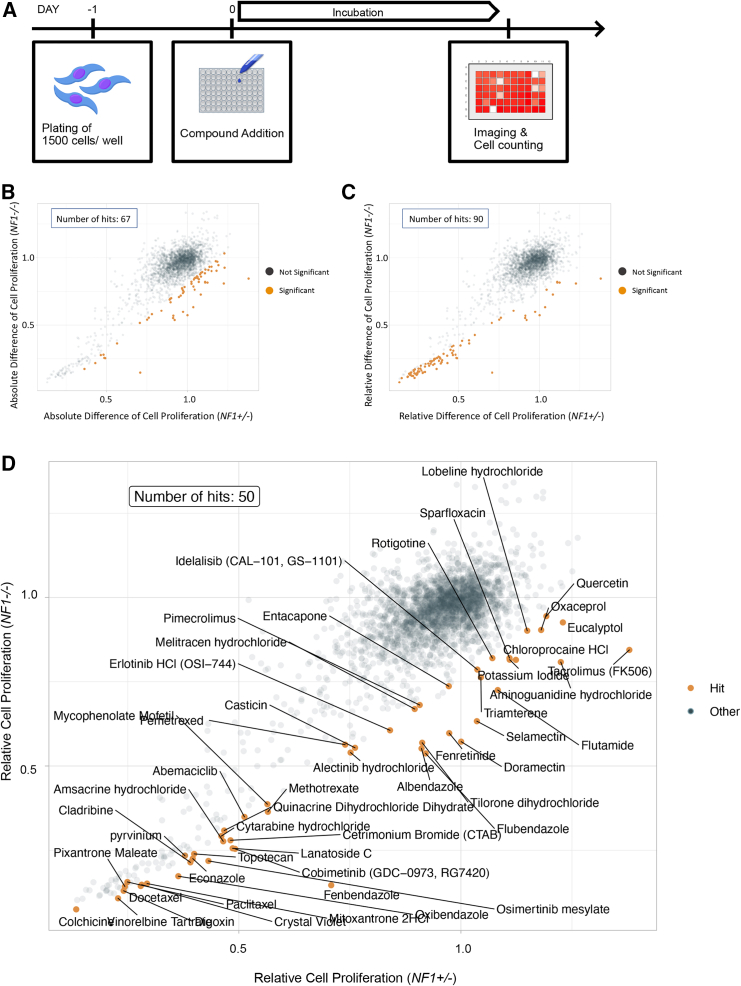
Cutaneous neurofibromas (cNFs) are tumors that develop in more than 99% of individuals with neurofibromatosis type 1 (NF1). They develop in the dermis and can number in the thousands. cNFs can be itchy and painful and negatively impact self-esteem. There is no US Food and Drug Administration (FDA)-approved drug for their treatment. Here, we screen a library of FDA-approved drugs using a cNF cell model derived from human induced pluripotent stem cells (hiPSCs) generated from an NF1 patient. We engineer an NF1 mutation in the second allele to mimic loss of heterozygosity, differentiate the NF1+/- and NF1-/- hiPSCs into Schwann cell precursors (SCPs), and use them to screen a drug library to assess for inhibition of NF1-/- but not NF1+/- cell proliferation. We identify econazole nitrate as being effective against NF1-/- hiPSC-SCPs. Econazole cream selectively induces apoptosis in Nf1-/- murine nerve root neurosphere cells and human cNF xenografts. This study supports further testing of econazole for cNF treatment.

Keywords: NF1; Schwann cell precursors; cutaneous neurofibroma; econazole; human induced pluripotent stem cells; neurofibromatosis.


Conflict of interest statement

Declaration of interests The authors declare no competing interests.

Figures

None
Graphical abstract
Figure 1
Figure 1
NF1−/− hiPSC-SPCs exhibit characteristics of tumor cells (A) Diagram showing the protocol for differentiation of human induced pluripotent stem cells (hiPSCs) into Schwann cell precursors (SCPs). (B) NF1−/− hiPSCs differentiated to SCPs express the indicated SCP markers. (C) Bright-field images showing uniform differentiation of NF1−/− hiPSCs into SCPs. (D) hiPSCs differentiated to mature Schwann cells express SOX10 (red) and S100β (green), markers of the Schwann cell lineage. Scale bars, 100 μm. (E) NF1−/− hiPSC-SCPs proliferate faster than NF1+/− hiPSC-SCPs. To measure cell proliferation, a fixed number of cells was plated on day 0 in several wells, and then the cells were dissociated and counted on subsequent days as indicated. Data represent mean ± SEM, n = 5. (F) NF1−/− hiPSC-SCPs, but not NF1+/− hiPSC-SCPs, form 3D clusters. Scale bars, 20 mm. ∗∗∗p < 0.001, ∗∗∗∗p < 0.0001. See also Figure S2.
Figure 2
Figure 2
A screen for novel therapeutics for neurofibroma using hiPSCs identifies promising candidates (A) Schematic of the timeline for the screen. (B) Scatterplot of absolute difference of cell proliferation in NF1−/− compared with NF1+/− hiPSC-SCPs following treatment with compounds. (C) Scatterplot of relative difference of cell proliferation in NF1−/− compared with NF1+/− hiPSC-SCPs following treatment with compounds. (D) Scatterplot with the 50 highest scoring compounds indicated. n = 2. See also Table S1.
Figure 3
Figure 3
Hit to lead validation with the 21 most effective compounds Twenty-one compounds were chosen for further analysis in an extended dose-response assay. Data represent mean ± SEM, n = 3 technical replicates using the same pair of cell lines.
Figure 4
Figure 4
Selective effects of econazole on NF1−/− SCPs (A and B) The indicated compounds were tested for their ability to affect cell proliferation of NF1+/− hiPSCs differentiated to Schwann cells relative to NF1+/− hiPSC-SCPs (A) and cell proliferation of NF1−/− hiPSCs differentiated to Schwann cells relative to NF1−/− hiPSC-SCPs (B). (C) The indicated cells were treated with six different drugs at the indicated doses, and the relative cell proliferation was measured. (D) hiPSC-SCPs (SCPs) and hiPSC-SCPs differentiated to Schwann cells (Schwann cells) treated with vehicle control (DMSO), 0.2 μM econazole, or 1.6 μM econazole for 72 h were stained with Hoechst to label cell nuclei. Scale bar, 100 μm. Data represent mean ± SEM, n = 3 independent experiments using hiSCPs from the same differentiation. Rel., relative.
Figure 5
Figure 5
Econazole decreases cell proliferation by inducing apoptosis (A and B) The fraction of Ki67-positive (A) or TUNEL-positive (B) NF1−/− hiPSC-SCPs was measured following treatment of the cells with different concentrations of econazole. (C) Immunofluorescence imaging for pERK expression was performed on NF1−/− hiPSC-SCPs treated with econazole or selumetinib at the indicated concentrations. (D) Quantification of phospho-ERK (pERK) levels in (C) by relative fluorescence intensity. (E) Proliferation of NF1−/− hiPSC-SCPs was measured using CellTiter-Glo following treatment with increasing concentrations of econazole, selumetinib, or econazole + selumetinib (Sel). Data represent mean ± SEM, n = 3. Scale bars, 100 μm.
Figure 6
Figure 6
Econazole treatment leads to apoptosis in the human ex vivo engraftment model of cNFs (A) Representative images of TUNEL staining on human cNF tissue (neurofibroma) and non-tumor skin treated as indicated for 24, 48, or 72 h. Scale bars, 50 μm (left) and 500 μm (right). (B) Quantification of TUNEL+ cells/DAPI+ cells in (A). Quantification was performed on multiple fields of view from 12 tumors and 6 adjacent skin samples from 3 individual patients. Each data point represents the approximate number of TUNEL+/DAPI+ cells in different fields of view from various regions of the tumor. (C) H&E staining of the indicated tissue treated with Vaseline, econazole, MEK inhibitor, or econazole + MEK inhibitor (MEKi) for 24, 48, or 72 h. H&E staining was performed on 12 tumors and 6 adjacent skin samples from 3 individual patients. The H&E staining shows no signs of tissue necrosis at any time point and clearly depicts the histological features of neurofibroma, including hypercellularity in the dermis and abundant spindle-shaped Schwann cells (black arrows) interspersed with collagen fibers (red stars). Scale bar, 50 μm. (D and E) Representative images (D) and quantification (E) of IHC analysis of the apoptotic markers cleaved PARP, cleaved caspase-3, and Bim after 24 h of the indicated treatment were performed on 8 tumors from 2 NF1 individuals . (F and G) Representative images (F) and quantification (G) of IHC analysis of Ki67, pERK, and ERK after 24 h of the indicated treatment were performed on 8 tumors from 2 individual patients. Scale bars, 50 μm (D and F). Data represent mean ± SEM. p < 0.05, ∗∗p < 0.01, ∗∗∗p < 0.001, ∗∗∗∗p < 0.0001. See also Figures S3–S5.
Figure 7
Figure 7
Econazole inhibits cell growth and induces apoptosis in Nf1−/− DNSCs (A) Nf1+/+, Nf1+/−, and Nf1−/− dorsal root ganglion/nerve root neurosphere cells (DNSCs) were treated with increasing doses of econazole, and cell proliferation was measured at 24, 48, and 72 h using CellTiter-Glo. (B and C) Representative images of Nf1+/+ and Nf1−/− DNSCs treated with increasing doses of econazole and analyzed after 24 h for apoptosis by TUNEL assay (B) or expression of the apoptosis marker cleaved caspase-3 (CC3) (C). Nuclei were stained with DAPI. (D) Quantification of TUNEL-positive cells in (B). (E) Quantification of CC3+ cells in (C). Experiments were performed three times with 3–5 technical replicates per experiment. Scale bars, 100 μm. Data represent mean ± SEM. p < 0.05, ∗∗p < 0.01, ∗∗∗p < 0.001. See also Figure S6.

References

    1. Friedman J.M. Epidemiology of neurofibromatosis type 1. Am. J. Med. Genet. 1999;89:1–6. - PubMed
    1. Gutmann D.H., Ferner R.E., Listernick R.H., Korf B.R., Wolters P.L., Johnson K.J. Neurofibromatosis type 1. Nat Rev Dis Primers. 2017;3 - PubMed
    1. Huson S.M., Harper P.S., Compston D.A. Von Recklinghausen neurofibromatosis. A clinical and population study in south-east Wales. Brain. 1988;111(Pt 6):1355–1381. - PubMed
    1. Serra E., Rosenbaum T., Winner U., Aledo R., Ars E., Estivill X., Lenard H.G., Lazaro C. Schwann cells harbor the somatic NF1 mutation in neurofibromas: evidence of two different Schwann cell subpopulations. Hum. Mol. Genet. 2000;9:3055–3064. - PubMed
    1. Le L.Q., Liu C., Shipman T., Chen Z., Suter U., Parada L.F. Susceptible stages in Schwann cells for NF1-associated plexiform neurofibroma development. Cancer Res. 2011;71:4686–4695. - PMC - PubMed

Publication types

LinkOut - more resources