. 2024 Feb;626(7997):207-211.
doi: 10.1038/s41586-023-06905-9. Epub 2023 Dec 12.

Targeted design of synthetic enhancers for selected tissues in the Drosophila embryo

Affiliations

Targeted design of synthetic enhancers for selected tissues in the Drosophila embryo

Bernardo P de Almeida et al. Nature. 2024 Feb.

Abstract

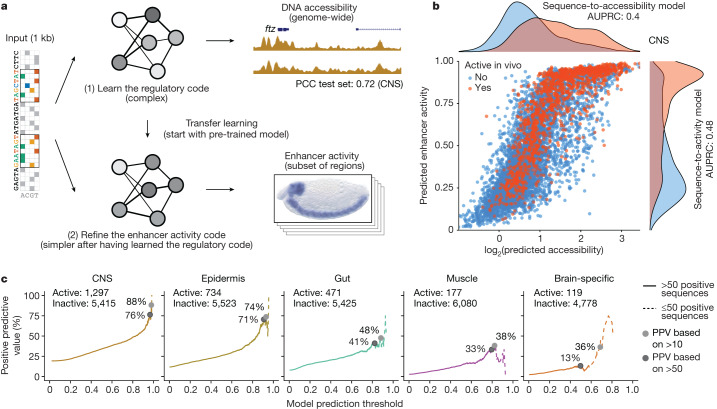
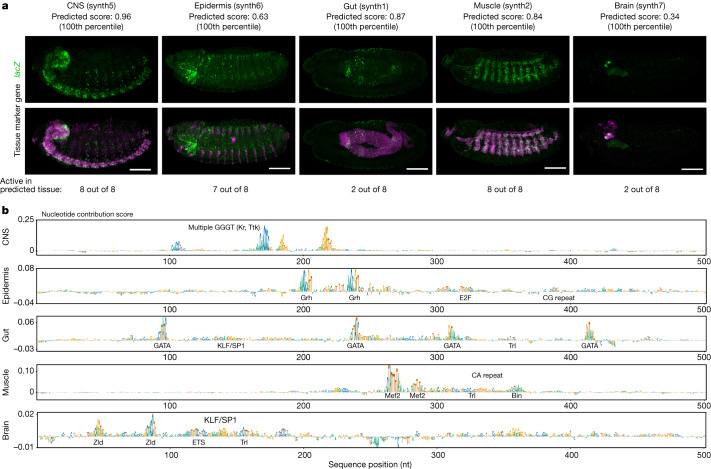
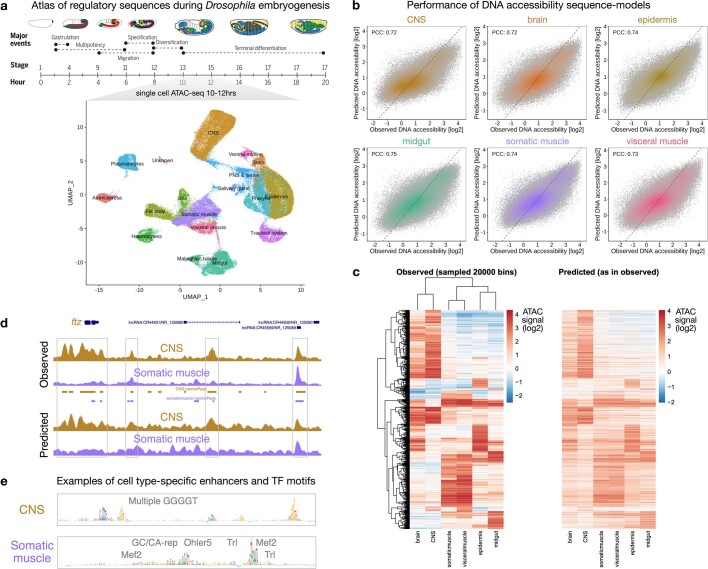
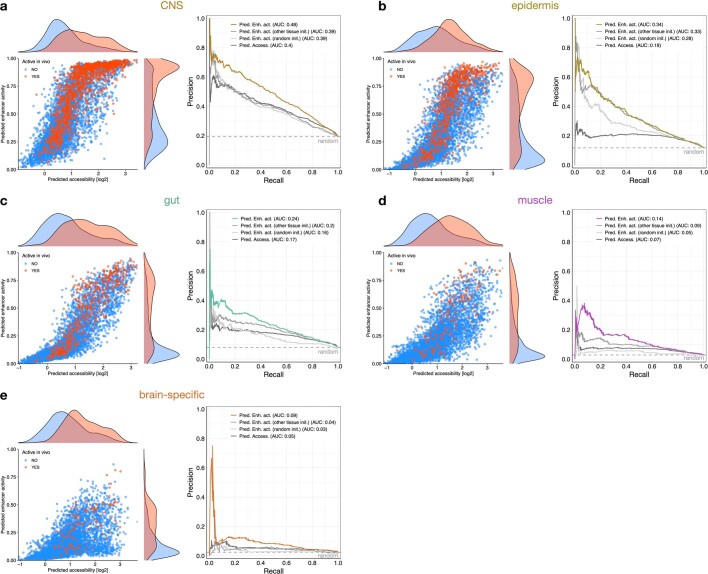
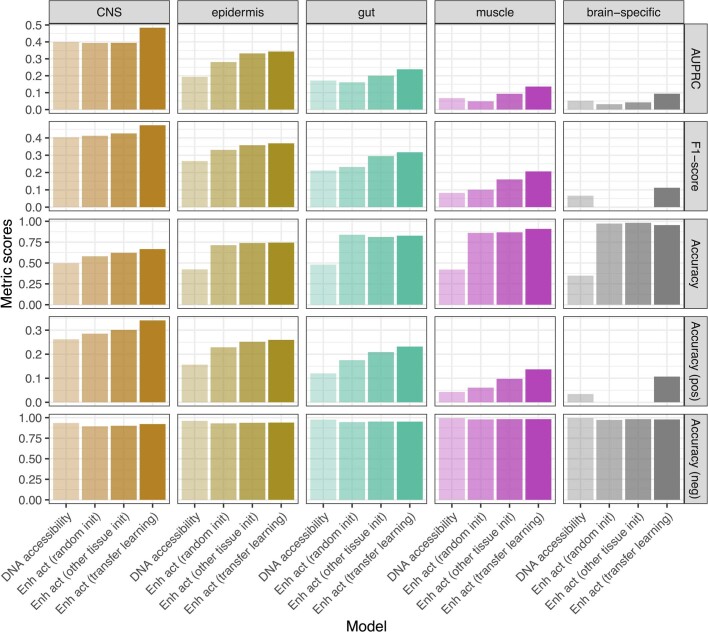
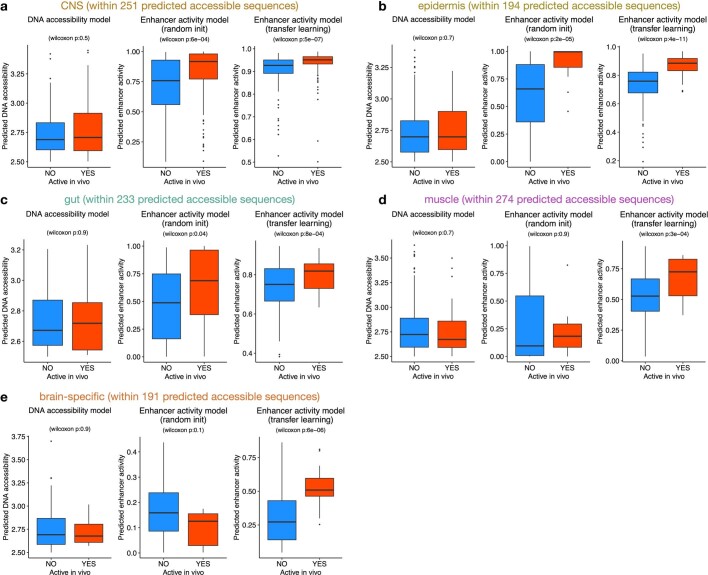
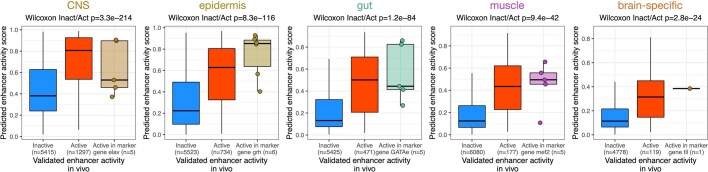
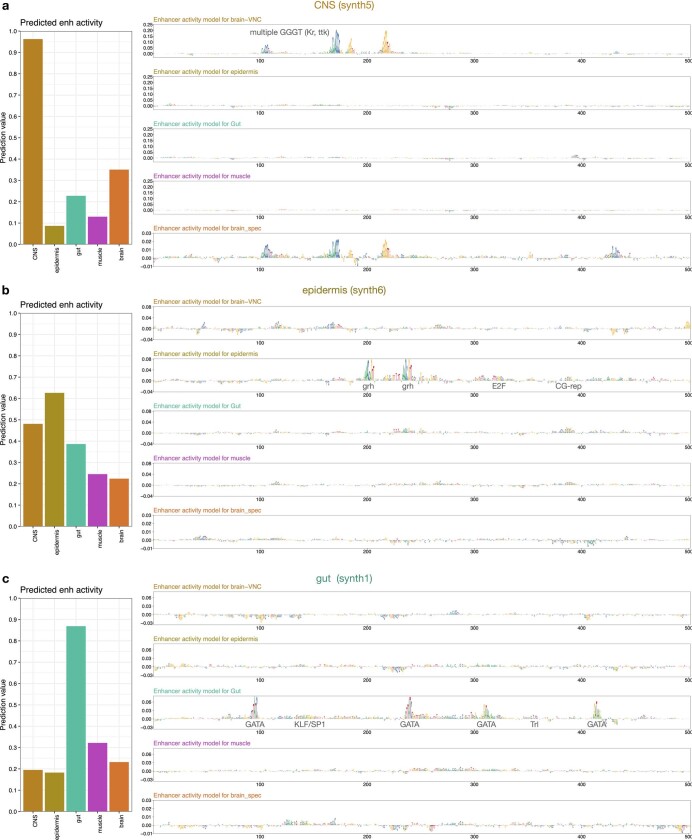
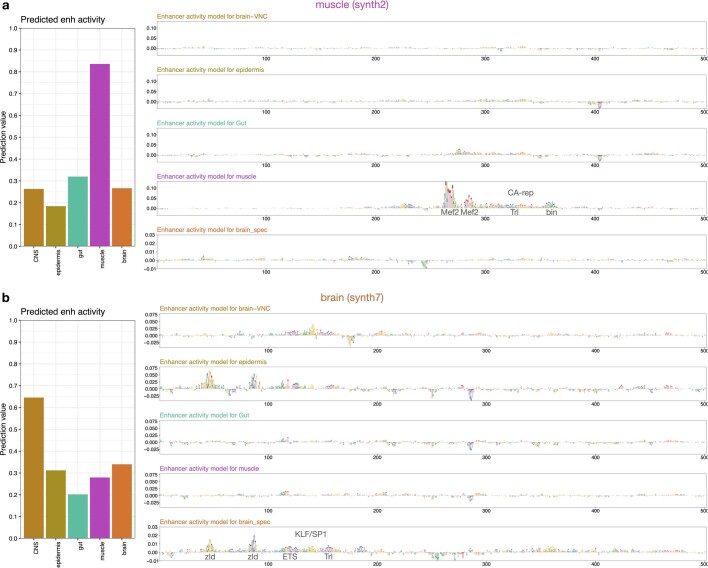
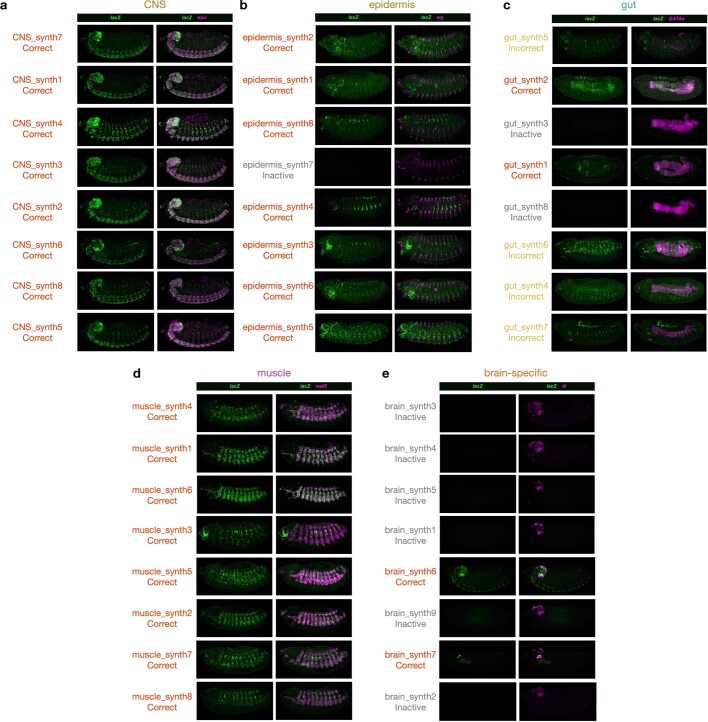
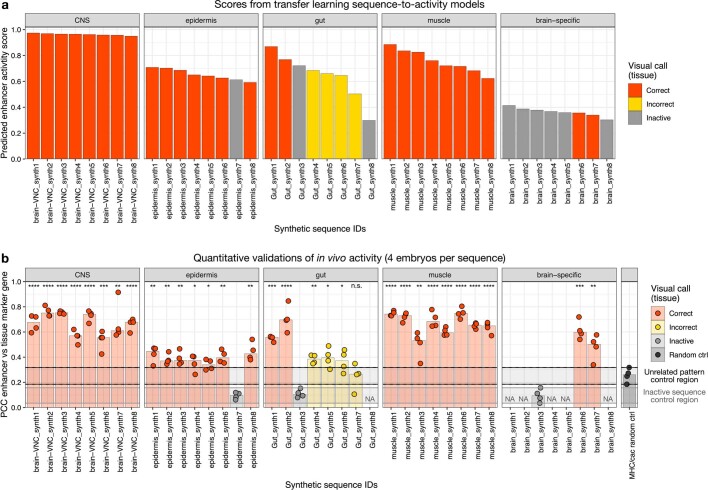
Enhancers control gene expression and have crucial roles in development and homeostasis1-3. However, the targeted de novo design of enhancers with tissue-specific activities has remained challenging. Here we combine deep learning and transfer learning to design tissue-specific enhancers for five tissues in the Drosophila melanogaster embryo: the central nervous system, epidermis, gut, muscle and brain. We first train convolutional neural networks using genome-wide single-cell assay for transposase-accessible chromatin with sequencing (ATAC-seq) datasets and then fine-tune the convolutional neural networks with smaller-scale data from in vivo enhancer activity assays, yielding models with 13% to 76% positive predictive value according to cross-validation. We designed and experimentally assessed 40 synthetic enhancers (8 per tissue) in vivo, of which 31 (78%) were active and 27 (68%) functioned in the target tissue (100% for central nervous system and muscle). The strategy of combining genome-wide and small-scale functional datasets by transfer learning is generally applicable and should enable the design of tissue-, cell type- and cell state-specific enhancers in any system.


Conflict of interest statement

The authors declare no competing interests.

Figures

Fig. 1
Fig. 1. Deep learning-based design of tissue-specific synthetic enhancers.
a, Overview of the deep and transfer learning strategy for predicting in vivo enhancer activity. First, a CNN is trained to predict quantitative DNA accessibility (pseudo-bulk scATAC-seq data) from the DNA sequence (sequence-to-accessibility model). Shown is a locus from the held-out test chromosome with observed and predicted values for CNS, with a PCC of 0.72. The first model is used to initialize a second model to classify DNA sequences on the basis of their activities in vivo in the respective tissue (sequence-to-activity model; shown is an enhancer active in CNS). This process is done separately for each tissue. b, Comparison of predicted DNA accessibility from the sequence-to-accessibility model and predicted enhancer activity (probability) from the sequence-to-activity model in the CNS for all sequences tested in vivo using tenfold cross-validation (blue, inactive; red, active). Density plots show the respective distributions. Area under the precision-recall curve (AUPRC) values are shown for both models. c, PPV of enhancer activity predictions at different thresholds. For each threshold (x axis, 0–1), the percentage of active sequences among all positive predictions is shown (y axis). Solid lines indicate percentages calculated based on more than 50 positive sequences, and dashed lines represent less confident estimates based on smaller numbers.
Fig. 2
Fig. 2. Validation of synthetic enhancers in vivo.
a, In vivo enhancer activity of one active sequence per tissue, as an example (for all other active sequences, see Extended Data Fig. 9). For each sequence, one representative embryo is shown from the total 200–300 embryos stained with double RNA fluorescence in situ hybridization (FISH). Scale bar, 100 μm. Predicted enhancer activity score and percentile value for the respective tissue model are shown. Top row, lacZ intensity reflects enhancer activity. Bottom row, lacZ intensity (green) overlaid with an endogenous marker gene (pink) for the respective tissue: elav (CNS), wg (epidermis), GATAe (gut), Mef2 (muscle) and tll (brain). The total numbers of active sequences per tissue are shown. b, Nucleotide contribution scores for the synthetic enhancers in a derived from the enhancer activity models for the respective tissues using DeepExplainer. Instances of transcription factor motifs known to be associated with the respective tissues and predicted to be important for the enhancer activity are highlighted.
Extended Data Fig. 1
Extended Data Fig. 1. Learning the cis-regulatory code of Drosophila embryo tissues with deep learning.
a) Top: Cartoon with Drosophila embryogenesis and respective stages and times, adapted from ref. . Reprinted with permission from AAAS. Bottom: UMAP visualization of cell-x-peak accessibility matrix of cells with inferred age between 10 and 12 h, colored and labeled by tissue annotation. Data from ref. . b) Performance of sequence-to-accessibility models for the selected pseudo-bulk tissues from (A). Scatter plots of predicted versus observed DNA accessibility signal (units of log depth-normalized coverage) across DNA sequences in the test set chromosomes (downsampled to 100,000 for easier visualization) for each tissue. Color reflects point density. PCC, Pearson correlation coefficient using all DNA sequences. c) Heatmaps of observed ATAC signal vs predicted ATAC signal across 20,000 sampled differentially accessible regions. The heatmap with observed values is clustered across regions (rows) and tissues (columns). The heatmap with predicted values has the same row and column orders but colored by the predicted values. d) Genome browser screenshot depicting observed and predicted ATAC profiles for the CNS (brown) and somatic muscle (purple) for a locus on the held-out test chromosome. Accessibility peaks for each tissue are shown below the observed signals. High-accessibility regions are highlighted with grey boxes (for example the well-known CNS enhancers upstream of the ftz gene). e) Nucleotide contribution scores for (top) a CNS and (bottom) a somatic muscle enhancer derived from the respective accessibility models. Instances of TF motifs known to be associated with the respective tissues and predicted to be important for the enhancer activity are highlighted.
Extended Data Fig. 2
Extended Data Fig. 2. TF motifs predictive of DNA accessibility discovered by TF-Modisco.
a-f) Motifs discovered by TF-Modisco by summarizing recurring predictive sequence patterns from the respective accessible regions of each pseudo-bulk tissue. Motifs are ranked by TF-Modisco predictive value and label by ID (motif number). Shown are the converted PWM logos of each motif, labeled with their closest database match (top: motif cluster (TF name, if available); bottom: PWM ID and TOMTOM q-value). NA means no significant match, based on TOMTOM q-value. See Methods for more details.
Extended Data Fig. 3
Extended Data Fig. 3. Comparison of sequence-to-accessibility and sequence-to-activity models plus controls.
a-e) Left: Comparison of predicted DNA accessibility [log2] and predicted enhancer activity [probability] in each tissue for all tested sequences in vivo (inactive in blue, active in red). Density plots show the respective distributions for both predictions for inactive and inactive sequences. Right: precision-recall curves for the sequence-to-accessibility and sequence-to-activity models on test data, plus two additional controls: models trained directly on the in vivo enhancer activity data starting from random initialization and models pre-trained on ATAC-seq data from an unrelated tissue (salivary gland). Respective areas under the precision-recall curve (AUC) are shown. Predictions for all models were computed for each sequence only using the respective cross-validation set where the sequence is held-out for testing.
Extended Data Fig. 4
Extended Data Fig. 4. Metric evaluation of the different models.
The performance of different models (x-axis) per tissue (column) was evaluated on test data with five different metrics: area under the precision-recall curve (AUPRC), F1-score, accuracy across all sequences, only among positive, or only among negative sequences. The models are the ones from Extended Data Fig. 3: the sequence-to-accessibility (DNA accessibility) and sequence-to-activity (transfer learning) models, plus control models trained directly on the in vivo enhancer activity data starting from random initialization or pre-trained on ATAC-seq data from an unrelated tissue.
Extended Data Fig. 5
Extended Data Fig. 5. Predictive value of DNA accessibility and enhancer-activity models for predicted accessible sequences.
a-e) For each tissue, sequences in the test set were selected based on a predicted DNA accessibility value higher than 2.5 and scored with the different models (total number of selected sequences shown in panel title). Sequences inactive (blue) or active (red) in vivo are shown in boxplots in function of their scores by the DNA accessibility model, enhancer activity model starting from random initialization, and enhancer activity model using transfer learning. P-values from two-sided Wilcoxon rank-sum test are shown for each comparison between inactive and active sequences. Numbers of predicted accessible sequences used for statistics per tissue: CNS – 251, epidermis – 194, gut – 233, muscle – 274, brain-specific – 191. The boxplots mark the median, upper and lower quartiles and 1.5× interquartile range (whiskers); outliers are shown individually.
Extended Data Fig. 6
Extended Data Fig. 6. Model evaluation on positive and negative control sequences.
Predicted enhancer activity scores by the sequence-to-activity transfer learning models for validated inactive sequences, all known active enhancers, and for known enhancers in the marker gene loci of the respective tissues. Gene loci (+/−50kb): elav (CNS), grh (epidermis), GATAe (gut), Mef2 (muscle) and tll (brain). P-values from two-sided Wilcoxon rank-sum test are shown for each comparison between inactive and active sequences per tissue. Number of sequences in each boxplot is shown in the respective x-axis. The boxplots mark the median, upper and lower quartiles and 1.5× interquartile range (whiskers); outliers are shown individually.
Extended Data Fig. 7
Extended Data Fig. 7. Nucleotide contribution scores of synthetic enhancers.
a-c) Left: Predicted enhancer activity across the five tissues for the synthetic enhancers from Fig. 2a. Right: Nucleotide contribution scores for the synthetic enhancers from Fig. 2a derived from the enhancer activity models of the five tissues, using DeepExplainer, with important TF motifs annotated.
Extended Data Fig. 8
Extended Data Fig. 8. Nucleotide contribution scores of synthetic enhancers.
a-b) Left: Predicted enhancer activity across the five tissues for the synthetic enhancers from Fig. 2a. Right: Nucleotide contribution scores for the synthetic enhancers from Fig. 2a derived from the enhancer activity models of the five tissues, using DeepExplainer, with important TF motifs annotated.
Extended Data Fig. 9
Extended Data Fig. 9. All synthetic sequences experimentally tested as enhancers.
A-E) Left panels show the lacZ intensity (green) as a marker for the enhancer activity pattern of the respective candidate sequence (labeled on the left). Right panels show the intensity of both the lacZ reporter gene driven by the synthetic sequence (green) and the corresponding endogenous marker gene (pink) for the respective tissue (elav (CNS), wg (epidermis), GATAe (gut), Mef2 (muscle) and tll (brain)). Synthetic enhancers are labeled as correct tissue expression, incorrect tissue expression and inactive. For each sequence, one representative embryo is shown from the total 200–300 double FISH-stained embryos. Scale bar, 100 μm. See Table S2 for more details.
Extended Data Fig. 10
Extended Data Fig. 10. Predicted scores for synthetic sequences and quantitative validations.
a) Predicted enhancer activity scores by the sequence-to-activity transfer learning models for candidate synthetic enhancers per tissue. Sequences are colored based on their validated in vivo activity: correct tissue expression, incorrect tissue expression and inactive. b) Quantitative validations for each candidate synthetic sequence per tissue. Pixel-wise Pearson Correlation Coefficient (PCC) between the marker genes and the synthetic enhancers calculated across the entire embryo volume are shown for 4 embryos per sequence (dots). Barplots represent the respective median value across the 4 embryos. For epidermis, gut, and brain, the PCCs between the marker genes and one inactive candidate per tissue (grey) are displayed. NA: PCCs not quantified for these inactive candidates. As an additional control, PCCs between two unrelated genes are shown (black; see Methods). Sequences are colored based on their validated in vivo activity: correct tissue expression, incorrect tissue expression and inactive. Same order of sequences as in (A). P-values from two-sided t-test between the PCCs of each sequence and the PCCs of two unrelated genes are shown for each sequence: **** p-value < 0.0001, *** <0.001, ** <0.01, * <0.05, n.s. non-significant. The two rectangles represent the interval of PCC values (between minimum and maximum) for the inactive (grey) and unrelated pattern (black) control sequences.

References

    1. Levine M. Transcriptional enhancers in animal development and evolution. Curr. Biol. 2010;20:R754–R763. doi: 10.1016/j.cub.2010.06.070. - DOI - PMC - PubMed
    1. Banerji J, Rusconi S, Schaffner W. Expression of a β-globin gene is enhanced by remote SV40 DNA sequences. Cell. 1981;27:299–308. doi: 10.1016/0092-8674(81)90413-X. - DOI - PubMed
    1. Shlyueva D, Stampfel G, Stark A. Transcriptional enhancers: From properties to genome-wide predictions. Nat. Rev. Genet. 2014;15:272–286. doi: 10.1038/nrg3682. - DOI - PubMed
    1. Kvon EZ, et al. Genome-scale functional characterization of Drosophila developmental enhancers in vivo. Nature. 2014;512:91–95. doi: 10.1038/nature13395. - DOI - PubMed
    1. Visel A, Minovitsky S, Dubchak I, Pennacchio LA. VISTA Enhancer Browser—a database of tissue-specific human enhancers. Nucleic Acids Res. 2007;35:D88–D92. doi: 10.1093/nar/gkl822. - DOI - PMC - PubMed

LinkOut - more resources