. 2024 Feb;626(7999):574-582.
doi: 10.1038/s41586-023-06935-3. Epub 2023 Dec 12.

A molecular switch for neuroprotective astrocyte reactivity

Affiliations

A molecular switch for neuroprotective astrocyte reactivity

Evan G Cameron et al. Nature. 2024 Feb.

Abstract

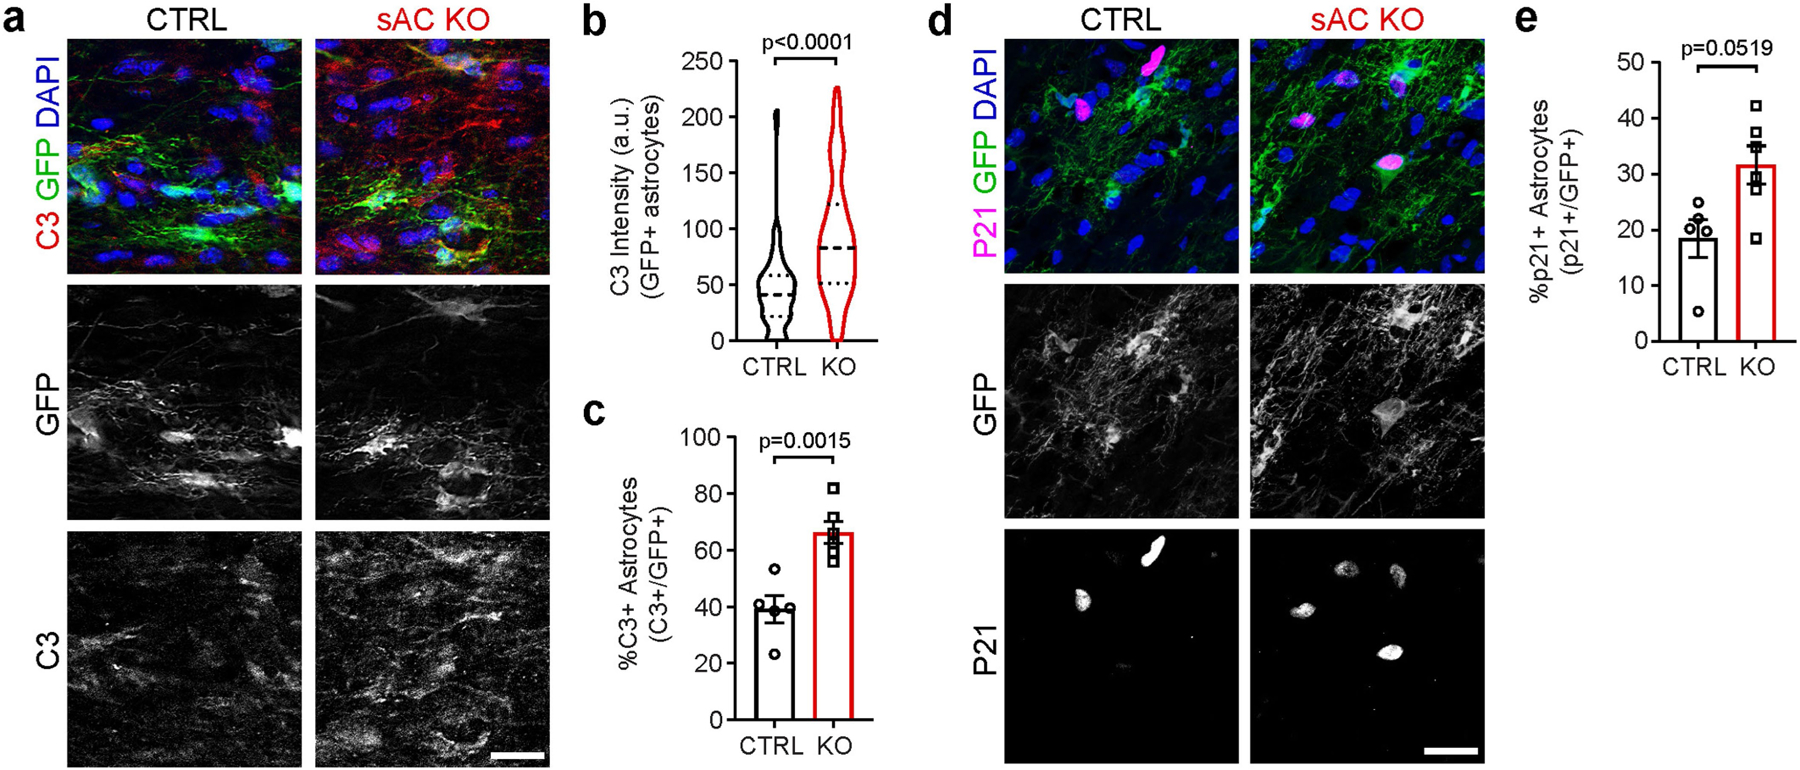
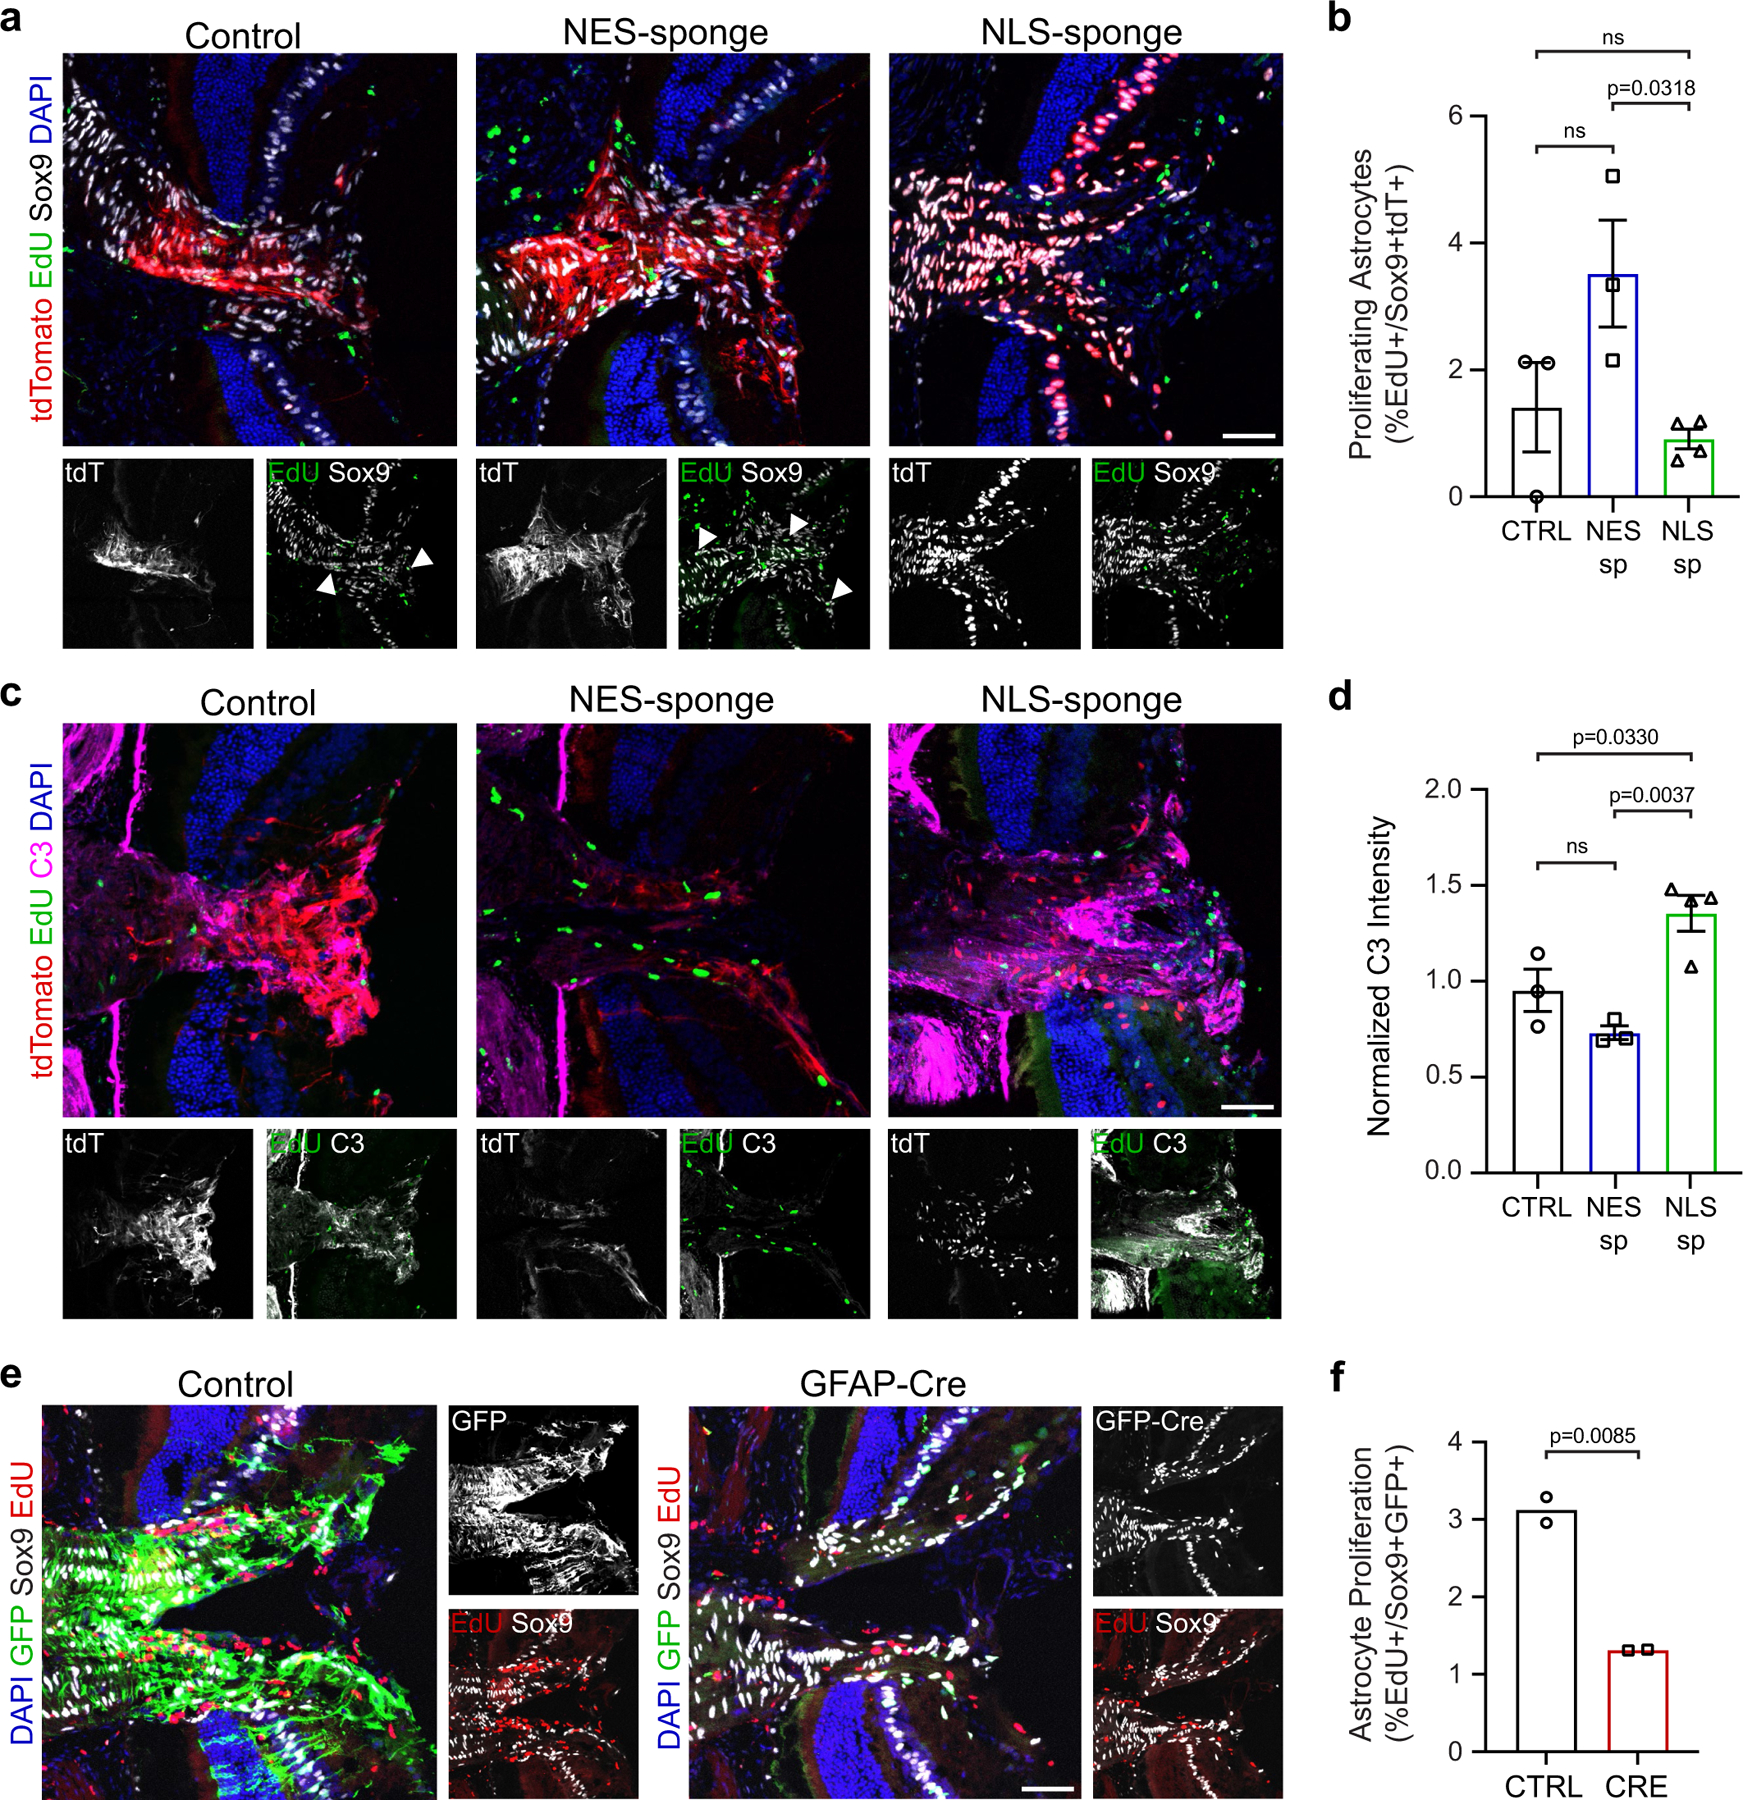
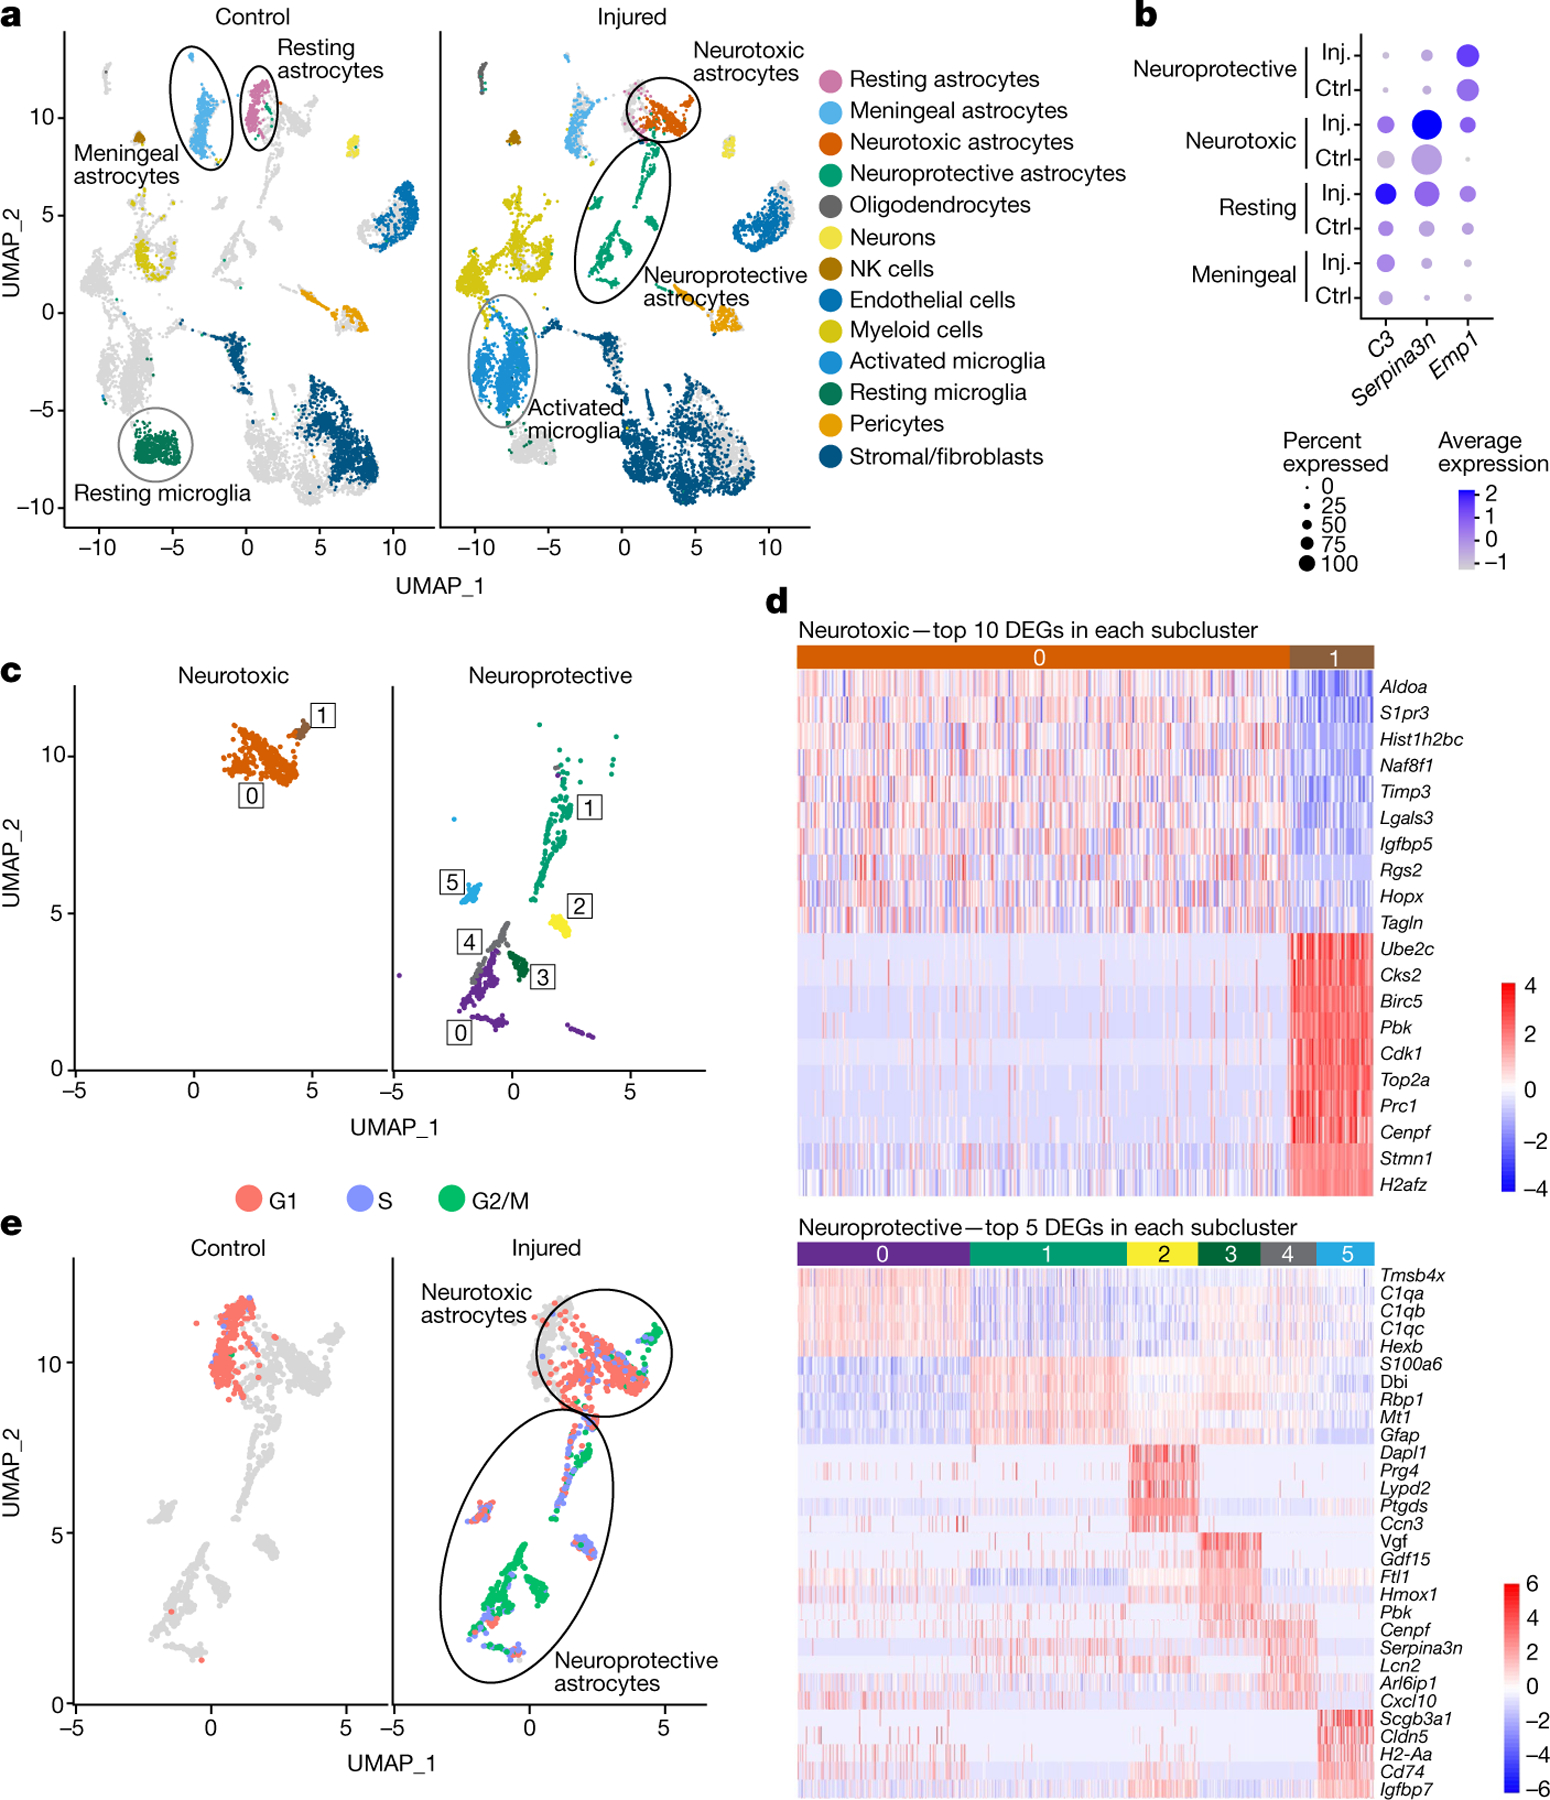
The intrinsic mechanisms that regulate neurotoxic versus neuroprotective astrocyte phenotypes and their effects on central nervous system degeneration and repair remain poorly understood. Here we show that injured white matter astrocytes differentiate into two distinct C3-positive and C3-negative reactive populations, previously simplified as neurotoxic (A1) and neuroprotective (A2)1,2, which can be further subdivided into unique subpopulations defined by proliferation and differential gene expression signatures. We find the balance of neurotoxic versus neuroprotective astrocytes is regulated by discrete pools of compartmented cyclic adenosine monophosphate derived from soluble adenylyl cyclase and show that proliferating neuroprotective astrocytes inhibit microglial activation and downstream neurotoxic astrocyte differentiation to promote retinal ganglion cell survival. Finally, we report a new, therapeutically tractable viral vector to specifically target optic nerve head astrocytes and show that raising nuclear or depleting cytoplasmic cyclic AMP in reactive astrocytes inhibits deleterious microglial or macrophage cell activation and promotes retinal ganglion cell survival after optic nerve injury. Thus, soluble adenylyl cyclase and compartmented, nuclear- and cytoplasmic-localized cyclic adenosine monophosphate in reactive astrocytes act as a molecular switch for neuroprotective astrocyte reactivity that can be targeted to inhibit microglial activation and neurotoxic astrocyte differentiation to therapeutic effect. These data expand on and define new reactive astrocyte subtypes and represent a step towards the development of gliotherapeutics for the treatment of glaucoma and other optic neuropathies.


Conflict of interest statement

Competing interests Stanford University has prepared provisional patent applications (file numbers pending) based on the ONH astrocyte-specific viral vector and the manipulation of astrocyte cAMP, on which E.G.C., A.B.T. and J.L.G. are included as inventors.

Figures

Extended Data Fig. 1 |
Extended Data Fig. 1 |. Annotation and cell cycle profiles of optic nerve cell types shown in Fig. 1.
a. Dot plots of canonical cellular markers in 13 identified optic nerve cell types. Fraction of expressing cells shown as dot size and mean expression shown as dot colour. b. UMAP plots as in Fig. 1e showing all optic nerve cell clusters coloured by distribution of cells in G1, S and G2/M phase.
Extended Data Fig. 2 |
Extended Data Fig. 2 |. Characterization of sAC expression and function in primary cortical astrocytes.
a-b. Astrocyte marker immunostaining and characterization of primary cortical astrocyte culture purity (n = 4 cultures). Scale bars are 50 μm. c. Western blots showing sACfull (180 kDa) and sACt (50 kDa) protein expression in sACfl/fl mouse astrocytes after 15 days in vitro (DIV), 30DIV and following AAV2-GFP (Ctrl) or AAV2-Cre-GFP (KO) transduction. d. Quantification of sAC KO determined by the relative difference of sACt band intensity between CTRL and sAC KO samples with protein expression normalized to ponceau or GAPDH (n = 3 cultures). Two-tailed paired t-test. e. Illustration of cell cycle phase progression and canonical checkpoints located at the G1, G2/M and metaphase-to-anaphase transitions (spindle checkpoint). f. Experimental design to assess the role of sAC in cell cycle progression in astrocyte cultures. g. Synchronization of astrocyte proliferation with aphidicolin. Relative frequency histogram of genomic DNA content after 20 hr aphidicolin treatment and removal with hours after release indicated. h. Fraction of cells in S phase (cells between dotted lines in panel g) following the indicated hours after removal of aphidicolin (n = 3 cultures). i. Relative frequency histograms of effects of 2HE treatment on cell cycle arrest in asynchronous (A) and synchronized (S) human astrocyte cultures. j. Quantification of panel i (n = 4 cultures). Two-way ANOVA with Tukey test. p > 0.05 is non-significant, n.s. All data are shown as mean values ± s.e.m. e,f, Created with BioRender.com.
Extended Data Fig. 3 |
Extended Data Fig. 3 |. Soluble adenylyl cyclase inhibits stress-associated p21 expression in proliferating astrocytes.
Bulk RNA-seq for human astrocytes shown in Fig. 2j–k and studied using the experimental paradigm shown Extended Data Fig. 2f. a. Inhibiting sAC induces p53, HIF-1α and NF-Kβ stress signalling pathways (red) and downregulation of canonical cell cycle signalling pathways (green) in proliferating astrocytes. Gene set enrichment analysis (GSEA) of KH7-, S-phase inhibitor aphidocolin- and G2/M inhibitor nocodazole-treated human astrocyte cultures. Aphidicolin and nocodazole differentially affect stress and cell cycle signalling consistent with their unique mechanisms of action. b. Volcano plots highlighting an upregulation of p53-, HIF-1α- and NF-κB-associated gene expression (red) and downregulation of canonical cell cycle genes (green). c. Gene expression analysis of p53-, NF-κB- and Hif-1α-associated genes demonstrating p21 (CDKN1A) is the most significantly upregulated stress-associated gene induced by KH7. d. Gene expression analysis of cell cycle-associated genes showing KH7 treatment induces a significant downregulation of known p21 targets including CCNB1, CDC25A, CDC25B and CDC25C. Moderated t-statistics test; b-d .
Extended Data Fig. 4 |
Extended Data Fig. 4 |. Effects of sAC KO on astrocyte C3 and p21 expression.
a. Loss of sAC in reactive optic nerve astrocytes induces C3 expression. Representative images of C3 immunostaining in CTRL and sAC KO optic nerve astrocytes 500 μm from the crush site. Scale bar is 20 μm. b. sAC KO leads to significantly increased C3 intensity (n = 91 cells from 5 optic nerves). Dotted lines represent 25th and 75th percentiles. Dashed line represents median. Two-sided Kolmogorov-Smirnov test. c. sAC KO leads to a significant increase in neurotoxic C3-positive reactive astrocytes using CTRL median as a threshold (n = 5 optic nerves). Two-tailed unpaired t-test. d. Representative images of p21 immunostaining in CTRL and sAC KO optic nerve astrocytes 500 μm from the crush site. Scale bar is 20 μm. i. Quantification of p21+ astrocytes demonstrating a significant increase in p21 expression in GFP-positive sAC KO astrocytes relative to controls (n = 5 optic nerves). Two-tailed unpaired t-test. All data are shown as mean values ± s.e.m.
Extended Data Fig. 5 |
Extended Data Fig. 5 |. AAV5 and AAV8 transduction in the retina with CMV, GFAP and gfaABC(1)D promoters.
a. Representative optic nerve head (ONH) cross-sections demonstrating tdTomato reporter expression for each viral vector tested. ONH region defined as the area between the glial lamina and optic disc rim ~200 μm from the centre of the retina. Scale bar is 50 μm. b. Representative cross-sections of transduced retinas at a distance (>500 μm) from the ONH. Closed arrowheads showing transduced NFL astrocytes. Open arrowheads showing transduced Muller glial cells in the inner nuclear layer (INL). NFL astrocytes defined by GFAP and Sox9 in the inner retina. Muller glia defined by Sox9 and DAPI in the INL. Photoreceptors defined by DAPI in the outer nuclear later (ONL). Scale bar is 50 μm. c. Representative retinal flat-mounts showing tdTomato reporter expression for each viral vector tested. RGCs identified by RBPMS immunostaining. Scale bar is 500 μm. d. Magnified ONH and retinal regions from retinal flat-mount (dashed in c). Open arrowheads showing transduced RGCs. Scale bar is 50 μm. e. Representative ONH cross-sections immunostained for Iba1 showing microglia and virus co-localization. Scale bar is 50 μm. f. Quantification of reporter expression in principal retinal cell types (AAV5.gfaABC(1)D, n = 5 retinas; AAV8.gfaABC(1)D, n = 3 retinas; AAV5.GFAP, n = 3 retinas; AAV8.GFAP, n = 3 retinas; AAV5.CMV, n = 2 retinas; AAV8.CMV, n = 2 retinas). One-way ANOVA with Tukey test. All data are shown as mean values ± s.e.m.
Extended Data Fig. 6 |
Extended Data Fig. 6 |. Compartmented cAMP in optic nerve head (ONH) astrocytes differentially regulates proliferation and C3 expression after optic nerve crush injury.
a. Representative images of AAV5.gfaABC(1)D. tdTomato (control), NES-sponge and NLS-sponge effects on ONH astrocyte proliferation after injury. Scale bar is 50 μm. b. Buffering cytoplasmic cAMP in ONH astrocytes promotes proliferation after injury (n = 4 retinas). One-way ANOVA with Tukey test. c. Representative images of ONH C3 immunoreactivity in AAV5.gfaABC(1)D.tdTomato (control), NES-sponge and NLS-sponge transduced retinas after injury. Scale bar is 50 μm. d. Buffering nuclear cAMP in ONH astrocytes induces significant C3 expression (n = 4 retinas). One-way ANOVA with Tukey test. e. Representative images of ONH astrocyte proliferation in AAV5.gfaABC(1)D.GFP (control) and AAV5.gfaABC(1)D.Cre-GFP (sAC KO) injected sACfl/fl mouse eyes following injury. f. sAC KO inhibits ONH astrocyte proliferation after injury (n = 2 retinas). p > 0.05 is non-significant, n.s. All data are shown as mean values ± s.e.m.
Extended Data Fig. 7 |
Extended Data Fig. 7 |. Model for sAC-dependent reactive astrocyte differentiation and regulation of glial–glial and glial-neuronal signalling in response to injury.
Nuclear and cytoplasmic sAC-derived cAMP differentially regulate neuroprotective astrocyte proliferation through the regulation of p21. Proliferating neuroprotective reactive astrocytes inhibit deleterious microglial activation and downstream neurotoxic astrocyte reactivity, thus influencing the balance between neuroprotective and neurotoxic reactive phenotypes and the extent of retinal ganglion cell (RGC) survival.
Fig. 1 |
Fig. 1 |. scRNA-seq shows several reactive astrocyte populations in injured optic nerves.
a, Uniform manifold approximation and projection (UMAP) of annotated cell clusters in uninjured and injured optic nerves shows changes in cellular composition 3 days after injury, including several reactive astrocyte populations (n = 5 mice and optic nerve pairs per condition). Clustering based on pooled control and injured cells, with grey masking showing the opposing sample’s distribution. b, Dot plots of canonical reactive astrocyte markers define C3- and Serpina3n-expressing neurotoxic and Emp1-expressing neuroprotective reactive astrocyte superclusters. Dot size indicates fraction of expressing cells and colour indicates relative mean individual cell expression. Ctrl, control; Inj., injured. c, UMAP projections of isolated neurotoxic and neuroprotective reactive astrocyte populations. Neurotoxic astrocytes split into two subclusters defined by inflammatory and proliferative markers. Neuroprotective astrocytes subdivided into six subclusters defined by cytokine and reparative marker expression. d, Top differentially expressed genes (DEGs) in isolated neurotoxic (above) and neuroprotective subclusters (below). Colour scale bar is log2 fold change. e, Astrocyte UMAP plots coloured by distribution of cells in G1, S and G2/M phase. The principal C3-positive neurotoxic astrocyte subcluster is primarily composed of non-proliferating cells. All C3-negative neuroprotective subclusters were proliferative except subcluster 5.
Fig. 2 |
Fig. 2 |. Soluble adenylyl cyclase regulates astrocyte proliferation.
a, Representative images of proliferating human astrocytes treated with dimethyl sulfoxide, dDADO (pan-tmAC inhibitor) and KH7 or 2HE (sAC-specific inhibitors; 10 μM each). b, KH7 and 2HE but not dDADO significantly inhibit astrocyte proliferation in a concentration-dependent manner relative to dimethyl sulfoxide (n = 3 cultures). c, KH7 and 2HE do not induce significant cell death at effective concentrations inhibiting proliferation (n = 3 cultures). Two-way analysis of variance (ANOVA) with Tukey test (b,c). d, Full-length (sACfull) and truncated sAC (sACt) isoform structure with loxP excision and qPCR primer sites marked. e, Quantification of sAC mRNA expression in cultured mouse astrocytes after 15 days in vitro (DIV), 30 DIV and sAC KO (n = 5 cultures). Mixed-effects analysis ANOVA with Sidak’s correction. f, Representative images of sACfl/fl mouse astrocyte proliferation after 15 DIV, 30 DIV and sAC KO. d/Cre, deactivated Cre. g, Quantification of astrocyte proliferation with time in culture and after sAC KO (n = 3 cultures). One-way ANOVA with uncorrected Fisher’s least significant difference. h, Relative frequency histograms of AAV2-Cre-GFP (sAC KO) and AAV2-GFP (CTRL) sACfl/fl-treated mouse astrocytes. i, sAC KO increases fraction of astrocytes in G2/M (n = 3 cultures). Two-way ANOVA with Sidak’s correction. j, Relative frequency histograms of effects of KH7 treatment on cell-cycle progression in human astrocytes. k, sAC inhibition induces G1 and G2/M cell-cycle arrest (n = 4 cultures). Two-way ANOVA with Tukey test. l, Representative images of proliferating mouse astrocytes following AAV2.shRNA-mediated p21 knockdown and dimethyl sulfoxide or KH7 treatment. m, p21 knockdown significantly inhibits KH7-induced cell-cycle arrest. One-way ANOVA with Sidak’s correction. P > 0.05 is non-significant (NS). All data shown as mean ± s.e.m. Scale bars, 50 μm (a,f), 100 μm (l). Panel d created with BioRender.com.
Fig. 3 |
Fig. 3 |. Soluble adenylyl cyclase promotes neuroprotective astrocyte proliferation and RGC survival after optic nerve crush injury.
a,b, Experimental design (a) and tissue orientation (b) diagrams for investigating effects of sAC KO on optic nerve astrocyte reactivity. c, Representative images of CTRL and sAC KO optic nerves 7 days after injury around lesion core (*). d, Representative images of astrocyte proliferation in CTRL and sAC KO optic nerves. Example proliferating EdU+ GFP+ Sox9+ astrocytes (solid arrowheads) and non-proliferating EdU GFP+ Sox9+ (open arrowheads) marked. e, Loss of sAC inhibits proliferation in sAC KO GFP+ reactive astrocytes relative to control (CTRL GFP+) and non-recombined astrocytes (sAC KO GFP) (n = 5 optic nerves). Mixed-effects analysis 2-way ANOVA with Tukey test. f, Representative RBPMS+ RGC labelling in retinal flat-mounts (top) and ×20 magnification (bottom) from control and sAC KO mice. g, Quantification of sAC KO-induced decrease in RGC survival after optic nerve injury (n = 7 retinas). Two-tailed unpaired t-test. h, Reactive astrocyte proliferation in the optic nerve positively correlates with RGC survival (n = 10 retinas and optic nerves). Pearson correlation shown. i, Representative images of Iba1 immunoreactivity and proliferation in CTRL and sAC KO optic nerves 7 days after injury. jm, Quantification shows increased Iba1+ immunoreactivity ( j,l) and proliferation (k,m) assayed within ( j,k) and outside (l,m) the lesion core (n = 7 optic nerves). Two-tailed unpaired t-tests. n, Iba1+ cell density in the optic nerve and RGC survival are inversely correlated (n = 13 retinas and optic nerves). Pearson correlation. P> 0.05 is non-significant. All data shown as mean ± s.e.m. Scale bars, 50 μm (d,f (bottom)), 500 μm (b,c,f (top),i). Panel a created with BioRender.com.
Fig. 4 |
Fig. 4 |. Soluble adenylyl cyclase inhibits neurotoxic astrocyte differentiation.
a, scRNA-seq UMAP plots of astrocyte clusters for uninjured (control) and crushed optic nerves from WT and sAC KO mice 3 days and 7 days post-crush (dpc) (n = 3 mice and optic nerve pairs per condition). Cohort-specific plots are shown with cells missing from that cohort shown in grey overlays. b, Proportion of resting, neurotoxic and neuroprotective astrocytes in uninjured (Ctrl) and crushed optic nerves from wild-type (WT) and sAC KO mice. c, Proportion of neurotoxic (orange) and neuroprotective (green) astrocytes from WT and sAC KO in G1, S and G2/M phase based on expression of canonical cell-cycle markers. Most neurotoxic astrocytes are non-proliferating, whereas most neuroprotective astrocytes are proliferating. d, Effects of sAC KO on p21 (Cdkn1a) expression. Box plots denote the medians and interquartile ranges, with whiskers of box plots indicating the highest datum within 1.5× interquartile range of the upper quartile.
Fig. 5 |
Fig. 5 |. Distinct subcellular pools of cAMP differentially regulate astrocyte proliferation in vitro.
a, PKA-R1β-derived cAMP sponges fused to mCherry and different subcellular targeting sequences. b, Illustration of predicted cAMP sponge localization with non-targeted (Ubiq), PM, NLS and NES targeting sequences. c, Representative images of cAMP sponge effects on astrocyte proliferation. d, Quantification of astrocyte proliferation expressing active (+) and inactive (−) cAMP sponges (n = 4 cultures). Two-way ANOVA with Tukey test. e, Buffering nuclear cAMP induces significant G2/M cell-cycle arrest (n = 3 cultures). One-way paired ANOVA with Dunnett test. f, Representative images of p21 immunofluorescence in sponge-expressing mouse astrocytes. g, Buffering nuclear cAMP induces significant p21 expression (n = 3 cultures). One-way paired ANOVA with Dunnett test. P > 0.05 is NS. All data shown as mean ± s.e.m. Scale bars, 50 μm (c,f). Panel a created with BioRender.com.
Fig. 6 |
Fig. 6 |. Compartmented cAMP in ONH astrocytes differentially regulates microglial activation and RGC survival after optic nerve injury.
a, Intravitreal injection of AAV5.gfaABC(1)D specifically transduces ONH astrocytes in mice. b, Retinal cross-sections showing AAV5.gfaABC(1)D-tdTomato expression in the retina and ONH (n = 5 retinas). c, Magnified ONH region (from b) showing transduced ONH astrocytes. d, Magnified retinal region (from b) showing transduced nerve fibre layer (NFL; solid arrows) astrocytes and Muller glial cells (MG; open arrow). e,f, Flat-mount (e) and magnified (f) ONH region showing AAV5.gfaABC(1)D-tdTomato expression in the retina. g, Magnified retinal region (from e) showing AAV5.gfaABC(1)D-tdTomato expression in some NFL astrocytes but not RGCs. h, Quantification of AAV5.gfaABC(1)D.tdTomato expression in astrocytes and principal retinal cell types (n = 5 retinas). i,j, Nuclear (NLS-sp) and cytoplasmic (NES-sp) cAMP sponge and nuclear sACt (NLS-sAC) constructs (i) and experimental design ( j) used to investigate the effects of compartment-specific cAMP signalling in vivo. Proximal (P) region from the ONH. k, Representative retinal flat-mount images showing tdTomato, NLS-sp, NLS-sAC and NES-sp expression and Iba1 immunoreactivity. l,m, Localization and expression of sponge constructs (tdTomato, l) and effects on local Iba1+ cell infiltration (m) at the ONH. n, Representative images of RGC survival following cAMP manipulation in ONH astrocytes. o, Quantification of cAMP effects on Iba1 cell density in the ONH region (n = 12 retinas). p, Quantification of relative RGC survival following cAMP sponge expression in ONH astrocytes (n = 12 retinas). One-way ANOVA with Dunnett test (o,p). q, ONH astrocyte-specific cAMP-mediated RGC survival and local ONH Iba1+ cell density are inversely related (n = 34 retinas). Pearson correlation shown. All data shown as mean ± s.e.m. Scale bars, 10 μm (g), 50 μm (c,d,f,o), 500 μm (b,e,k). Panels i,j created with BioRender.com.

References

    1. Zamanian JL et al. Genomic analysis of reactive astrogliosis. J. Neurosci 32, 6391–6410 (2012). - PMC - PubMed
    1. Liddelow SA et al. Neurotoxic reactive astrocytes are induced by activated microglia. Nature 541, 481–487 (2017). - PMC - PubMed
    1. Burda JE & Sofroniew MV Reactive gliosis and the multicellular response to CNS damage and disease. Neuron 81, 229–248 (2014). - PMC - PubMed
    1. Guttenplan KA et al. Neurotoxic reactive astrocytes drive neuronal death after retinal injury. Cell Rep 31, 107776 (2020). - PMC - PubMed
    1. Anderson MA et al. Required growth facilitators propel axon regeneration across complete spinal cord injury. Nature 561, 396–400 (2018). - PMC - PubMed

MeSH terms