. 2023 Dec 12;7(2):e202302029.
doi: 10.26508/lsa.202302029. Print 2024 Feb.

The AP-2 complex interacts with γ-TuRC and regulates the proliferative capacity of neural progenitors

Affiliations

The AP-2 complex interacts with γ-TuRC and regulates the proliferative capacity of neural progenitors

Santiago Camblor-Perujo et al. Life Sci Alliance. .

Abstract

Centrosomes are organelles that nucleate microtubules via the activity of gamma-tubulin ring complexes (γ-TuRC). In the developing brain, centrosome integrity is central to the progression of the neural progenitor cell cycle, and its loss leads to microcephaly. We show that NPCs maintain centrosome integrity via the endocytic adaptor protein complex-2 (AP-2). NPCs lacking AP-2 exhibit defects in centrosome formation and mitotic progression, accompanied by DNA damage and accumulation of p53. This function of AP-2 in regulating the proliferative capacity of NPCs is independent of its role in clathrin-mediated endocytosis and is coupled to its association with the GCP2, GCP3, and GCP4 components of γ-TuRC. We find that AP-2 maintains γ-TuRC organization and regulates centrosome function at the level of MT nucleation. Taken together, our data reveal a novel, noncanonical function of AP-2 in regulating the proliferative capacity of NPCs and open new avenues for the identification of novel therapeutic strategies for the treatment of neurodevelopmental and neurodegenerative disorders with AP-2 complex dysfunction.


Conflict of interest statement

The authors declare that they have no conflict of interest.

Figures
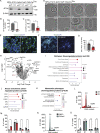
Figure 1.
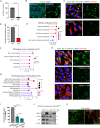
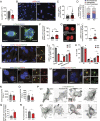
Figure 1.. AP-2 regulates neuronal cell cycle progression independent of clathrin.
(A, B) Immunoblot analysis of AP-2α protein levels in lysates of NPCs isolated from Ap2m1 loxP: CAG-Cre-ERTmx mice at E12.5 and cultured for 3 d (DIV3). NPCs were treated at DIV1 with either tamoxifen to induce KO (Tmx) or ethanol (EtOH) to be used as a WT (WT set to 100%, KO: 7.88% ± 5.84%, P < 0.0001, NWT = 3, NKO = 3, two-tailed unpaired t test). (C) Relative number of WT and AP-2 KO NPCs at DIV3 (WT set to 100%, KO = 38.80 ± 13.50, P = 0.01, NWT = 3, NKO = 3, two-tailed unpaired t test). (D) Timestamps of 24-h live imaging of WT and KO NPCs at DIV3 showing an increase in neurosphere growth (white circles) in WT but not in KO. Representative examples from NWT = 3, NKO = 3. Scale bar, 50 μm. (E) WT and KO NPCs at DIV3, immunostained for vimentin. DAPI stain was used to visualize the nuclei. In the KO condition, lower cell number and elongated tubular morphology are observed. Representative fluorescent images from NWT = 3, NKO = 3. Scale bars, 25 μm. (F) Proliferation ability of WT and AP-2 NPCs at DIV3 analyzed using the EdU pulse assay, where EdU is directly coupled with Alexa488. DAPI stain was used to visualize the nuclei. Scale bars: 50 μm. (G) Percentage of proliferating WT and KO NPCs cells (EdU+ cells) (WT = 63.93% ± 4.56%, KO = 29.10% ± 2.73%, P < 0.0001, two-tailed unpaired t test). In total, 11 WT/KO images, with at least 300 EdU cells and 1,500 total cells per condition, from N = 3. (H) Volcano plot of differentially expressed proteins in WT and AP-2 KO NPCs at DIV3 analyzed using label-free proteomic analysis (N = 3 WT/KO). Dark gray circles indicate all protein deregulated at q < 0.05. AP2M1 and AP2A1 subunits of the AP-2 complex are highlighted in red. (I) ShinyGO v0.77-based GO analysis of pathways (“Reactome pathways”) in the down-regulated proteome of AP-2 KO NPCs compared with the WT (cut-off q < 0.05). (J) ShinyGO v0.77-based kinase enrichment analysis in the down-regulated proteome of AP-2 KO NPCs compared with the WT (cut-off q < 0.05). (K) ShinyGO v0.77-based mammalian phenotype analysis in the down-regulated proteome of AP-2 KO NPCs compared with the WT (cut-off q < 0.05). (L, M) Cell cycle analysis by DNA content estimation with flow cytometry in WT and AP-2 KO NPCs at DIV2. Histogram in (M) indicates the percentages of dead cells or cells in G1, S, and G2/M phases of cell cycle (WTDeadCells = 4.88% ± 0.57%, KODeadCells = 25.89% ± 1.21%, P < 0.016, WTG1 = 55.58% ± 0.68%, KOG1 = 50.46% ± 4.68%, P = 0.339, WTS = 15.28% ± 0.88%, KOS = 6.66% ± 0.39%, P = 0.031, WTG2/M = 16.83% ± 1.10%, KOG2/M = 5.60% ± 1.89%, P = 0.0168, two-way ANOVA with Holm-Sidak’s multiple comparisons test). In addition, significant differences were found between WT and KO in the overall distribution of cell cycle phases with the x2 test using the original cell counts (P < 0.001 for each independent N). WT = 20,000 events and KO ≥ 5500 events per each experiment, from N = 3. (N, O) Cell cycle analysis by DNA content estimation with flow cytometry in NPCs treated for 24 h either with DMSO as a control or with 30 μM of Pitstop2 and analyzed at DIV2. Histogram in (H) indicates the percentages of dead cells or cells in G1, S, and G2/M phases of the cell cycle (DMSODeadCells = 5.73% ± 1.99%, Pitstop2DeadCells = 11.22% ± 5.50%, DMSOG1 = 60.89% ± 0.19%, Pitstop2G1 = 62.10% ± 3.00%, DMSOS = 9.37% ± 0.38%, Pitstop2S = 7.74% ± 1.01%, DMSOG2/M = 17.77% ± 1.27%, Pitstop2G2/M = 13.11% ± 2.59%, two-way ANOVA with Holm–Sidak’s multiple comparisons test). In addition, no significant differences were found between DMSO and Pitstop2-treated condition in the overall distribution of cell cycle phases with the x2 test using the original cell counts. In total, 20,000 events per condition, from N = 3. Data information: all graphs show mean ± SEM. n.s.—nonsignificant. * indicates P ≤ 0.05; ** indicates P ≤ 0.01; *** indicates P ≤ 0.001; **** indicates P ≤ 0.0001. N represents independent cultures obtained from independent animals.
Figure S1.
Figure S1.. Loss of cell proliferation in primary NPCs lacking AP-2µ.
(A) Relative number of WT and AP-2 KO NPCs at DIV7 (WT set to 100%, KO = 3.27% ± 0.56%, P < 0.0001, NWT = 3, NKO = 3, two-tailed unpaired t test). (B) WT and KO NPCs at DIV7, immunostained for vimentin. Representative fluorescent images from NWT = 3, NKO = 3. DAPI stain was used to visualize the nuclei. Scale bars, 40 μm. (C, D) Uptake of fluorescent (Alexa 488) transferrin is inhibited in DIV3 NPCs lacking AP-2µ (WT set to 100%, KO: 25.78 ± 1.05, P < 0.0001, two-tailed unpaired t test). In total, 150 WT and 139 KO cells from N = 3. (E) ShinyGO v0.77-based GO analysis of pathways (“KEGG pathways”) in the up-regulated proteome of AP-2 KO NPCs compared with the WT (cut-off q < 0.05). (F) ShinyGO v0.77-based GO analysis of biological processes in the up-regulated proteome of AP-2 KO NPCs compared with the WT (cut-off q < 0.05). (G) ShinyGO v0.77-based GO analysis of biological processes in the down-regulated proteome of AP-2 KO NPCs compared with the WT (cut-off q < 0.05). (H, I) Uptake of fluorescent (Alexa 488) transferrin is inhibited in DIV3 NPCs treated with 30 μM of PitStop2 (DMSO set to 100%, PitStop24 h: 39.10 ± 5.93, PitStop48 h: 25.78 ± 2.40, p DMSO versus Pitstop224 h = 0.0011, p DMSO versus Pitstop248 h = 0.0007, repeated measures one-way ANOVA). In total, 142 DMSO-treated and 130 Pitstop2-treated cells from N = 3. (J) Immunoblots analysis of p-ERK and ERK levels in lysates of WT and AP-2 KO NPCs at DIV3. Representative examples from N = 4. (K) Representative images of WT and KO NPCs immunostained for pERK. DAPI stain was used to visualize the nuclei. Scale bars: 20 μm. Data information: all graphs show mean ± SEM. n.s.—nonsignificant; * indicates P ≤ 0.05; ** indicates P ≤ 0.01; *** indicates P ≤ 0.001; **** indicates P ≤ 0.0001. N represents independent cultures obtained from independent animals.
Figure 2.
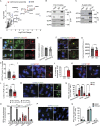
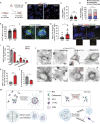
Figure 2.. AP-2 associates with components of γ-TuRC and its loss impairs centrosome organization.
(A) Volcano plot showing interaction partners identified by pull-down of AP-2α from the cortex of E12.5 mice followed by quantitative mass spectrometry. Proteins significantly enriched in the AP-2α pull-down compared with the IgG control are highlighted in gray. AP-2 interactors with the function in endocytosis/centrosome assembly are highlighted in blue/red, accordingly. N = 5. (B) Co-immunoprecipitation of endogenous AP-2α with γ-Tubulin, GCP4 and GCP3 in E12.5 cortex lysates. Input, 1.5% of the lysate. Representative example from N = 3. (C) Co-immunoprecipitation of endogenous AP-2α with GCP2 and GCP3 in 8-wk-old cortex lysates. Input, 1% of the lysate. Representative example from N = 3. (D) NPCs at DIV3 immunostained for AP-2α with GCP3 using methanol-based fixation. DAPI stain was used to visualize the nuclei. Representative fluorescent images from N = 3. Scale bars: 6 μm. (E) Bar diagrams representing the colocalization of AP-2α and AP-2µ with GCP3 in NPCs based on Pearson’s coefficient (r) (AP-2α = 0.78 ± 0.02, AP-2µ = 0.71 ± 0.037). In total, AP-2α = 20 AP-2µ = 19 cells from N = 3. A representative example of AP-2µ with GCP3 colocalisation is shown in Fig S2D. (F) WT and KO NPCs at DIV3 immunostained for GCP3 and co-immunostained for γ-tubulin. DAPI stain was used to visualize the nuclei. Representative fluorescent images from NWT = 3, NKO = 3. Scale bars: 20 μm, inserts 2 μm. (G) Levels of GCP3 at the centrosome, marked by γ-tubulin (mean grey value, m.g.v) in WT and KO NPCs (WT = 49,669 ± 1651, KO = 41,286 ± 2484, P = 0.0086, two-tailed unpaired t test). In total, 31 WT and 30 KO images from N = 3. (H) Percentage of total GCP3 overlapping with γ-tubulin in WT and KO NPCs (WT = 28.32 ± 2.62, KO = 11.53 ± 1.87, P < 0.0001, two-tailed unpaired t test). Total GCP3 was set to 100% in each condition. In total, 16 WT/KO images from N = 3. (I) WT and KO NPCs at DIV3 immunostained for PCNT. DAPI stain was used to visualize the nuclei. Representative fluorescent images from NWT = 3, NKO = 3. Scale bars: 10 μm. (J) Percentage of WT and KO NPCs with disorganized PCNT (WT = 0.83% ± 0.83%, KO = 66.52% ± 10.44%, P = 0.0008, two-tailed unpaired t test). In total 30 WT/KO cells, from N = 4. (K) WT and KO NPCs at DIV3 immunostained for PCM1 (arrows indicate PCM1 localization in WT and KO). DAPI stain was used to visualize the nuclei. Representative fluorescent images from NWT = 3, NKO = 3. Scale bars: 13 μm. (L) Analysis of PCM1 mean fluorescence (mean grey value, m.g.v) in WT and KO NPCs (WT = 36.03 ± 1.74, KO = 22.31 ± 1.13, P < 0.0001, two-tailed unpaired t test). In total, 30 WT/KO cells from N = 3. (M) Morphology of centrosomes in WT and KO NPCs visualized by immunostaining with γ-tubulin (arrows indicate KO NPCs containing multiple centrosomes). DAPI stain was used to visualize the nuclei. Scale bars: 10 μm. (N) Percentages of WT and KO NPCs which are either acentrosomal or containing single or multiple centrosomes at DIV3 (WTAcentrosomal = 10.98% ± 1.45%, KOAcentrosomal = 56.63% ± 4.61%, WTSingleCentrosome = 86.16% ± 1.58%, KOSingleCentrosome = 23.54% ± 2.42%, WTMultipleCentrosomes = 2.85% ± 0.74%, KOMultipleCentrosomes19.82% ± 2.94%, P < 0.0001, two-way ANOVA with Holm-Sidak’s multiple comparisons test). In total, 15 WT/KO images, with >100 cells per condition, from N = 3. (O) Analysis of centrosomes in WT and KO NPCs, expressing either mCherry or AP-2µ-RFP and co-immunostained for CEP135 (please see Fig S2L for example images). Percentages of NPCs which are either acentrosomal or containing single or multiple centrosomes at DIV3 were counted (WT + mCherryAcentrosomal = 5.77% ± 2.38%, KO + mCherryAcentrosomal = 31.19% ± 4.10%, WT + AP-2µ-RFPAcentrosomal = 16.30% ± 3.88%, KO + AP-2µ-RFPAcentrosomal = 7.15% ± 3.59%, WT + mCherrySingleCentrosome = 94.23% ± 2.38%, KO + mCherrySingleCentrosome = 44.44% ± 6.74%, WT + AP-2µ-RFPSingleCentrosome = 81.33% ± 5.74%, KO + AP-2µ-RFPSingleCentrosome = 88.67% ± 1.36%, WT + mCherryMultipleCentrosomes = 0.00% ± 0.00%, KO + mCherryMultipleCentrosomes24.37% ± 7.02%, WT + AP-2µ-RFPMultipleCentrosomes = 2.38% ± 2.38%, KO + AP-2µ-RFPMultipleCentrosomes4.18% ± 2.65%). (WT + mCherryAcentrosomal versus KO + mCherryAcentrosomal P = 0.001, WT + mCherryMultiple versus KO + mCherryMultiplep = 0.002, WT + mCherrySingle versus KO + mCherrySinglep<0.0001, KO + mCherryAcentrosomal versus KO + AP-2µ-RFPAcentrosomal P = 0.002, KO + mCherryMultiple versus KO + AP-2µ-RFPMultiplep = 0.007, KO + mCherrySingle versus KO + AP-2µ-RFPSingleP < 0.0001, two-way ANOVA with Holm-Sidak’s multiple comparisons test). >30 WT/KO images, from N = 3. (P) Morphology of centrosomes in NPCs either treated for 24 h with DMSO or with 30 μM of Pitstop2 visualized at DIV3 by immunostaining with γ-tubulin. DAPI stain was used to visualize the nuclei. Scale bars: 12 μm. (Q) Percentages of DMSO- and Pitstop2-treated NPCs which are either acentrosomal or containing a single centrosome or multiple centrosomes at DIV3 (DMSOAcentrosomal = 10.68% ± 3.35%, Pitstop2Acentrosomal = 6.51% ± 2.25%, DMSOSingleCentrosome = 87.54% ± 3.08%, Pitstop2SingleCentrosome = 92.14% ± 1.93%, DMSOMultipleCentrosomes = 1.78% ± 0.92%, Pitstop2MultipleCentrosomes = 1.35% ± 0.45%, two-way ANOVA with Holm–Sidak’s multiple comparisons test). In total, 5 DMSO/Pitstop2 images, with ≥100 cells per condition, from N = 3. Data information: squares in Figs 2D, F, I, and M indicate magnified regions. All graphs show mean ± SEM. n.s.—nonsignificant. * indicates P ≤ 0.05; ** indicates P ≤ 0.01; *** indicates P ≤ 0.001; **** indicates P ≤ 0.0001. N represents independent cultures obtained from independent animals.
Figure S2.
Figure S2.. AP-2α forms a complex with AP-2µ and GCP2/3 in embryonic and adult cortices, whereas AP-2µ deletion decreases levels of GCP2 but not γ-tubulin in primary NPCs.
(A) Co-immunoprecipitation of endogenous AP-2α with GCP3 and AP-2 µ in E12-14 cortex lysates. Input, 1.5% of the lysate. Representative example from N = 3. Please note that this WB corresponds to the blot shown in Fig 2B, where the samples were additionally probed with the AP-2µ antibody. (B) Co-immunoprecipitation of endogenous GCP2 with AP-2α and AP-2µ in E12-14 and adult cortex lysates. Input; upper panel: 1.6% of the lysate, lower panel: 1% of the lysate. (C) Co-immunoprecipitation of endogenous GCP3 with AP-2α and GCP2 in adult cortex lysates. Input, 1.5% of the lysate. (D) Immunoblot analysis of GCP2 protein levels in lysates of primary WT and KO NPCs at DIV3 (WT set to 100%, KO: 49.50% ± 14.50%, P < 0.032, NWT = 3, NKO = 4, two-tailed unpaired t test). (E) Representative images of NPCs co-immunostained for AP-2µ and GCP3. DAPI stain was used to visualize the nuclei. Scale bars 5 μm. (F) Representative images of WT and KO NPCs immunostained for GCP2 and co-immunostained for CEP135 to visualize centrosomes. DAPI stain was used to visualize the nuclei. Scale bars: 10 μm, inserts 2 μm. (G) Levels of GCP2 at the centrosome, marked by CEP135 (mean grey value, m.g.v) in WT and KO NPCs (WT = 6,270,178 ± 274,144, KO = 5,177,578 ± 180,768, P = 0.0016, two-tailed unpaired t test). In total, 31 WT and 30 KO images from N = 3. (H) Percentage of total GCP2 overlapping with CEP135 in WT and KO NPCs (WT = 47.07 ± 4.75, KO = 16.65 ± 2.32, P < 0.0001, two-tailed unpaired t test). Total GCP2 was set to 100% in each condition. In total, 15 WT/KO images from N = 3. (I) Levels of γ-tubulin (mean grey value, m.g.v) in WT and KO NPCs (WT = 10.31 ± 0.811, KO = 11.34 ± 0.96, P = 0.4164, two-tailed unpaired t test). In total 30 WT/KO images from N = 3. (J) Morphology of centrosomes in WT and KO primary NPCs visualized by co-immunostaining with γ-tubulin and CEP135. DAPI stain was used to visualize the nuclei. Scale bars: 20 μm, inserts 2 μm. (K) Percentages of WT and KO NPCs which are either acentrosomal or containing single or multiple centrosomes at DIV3 (WTAcentrosomal = 7.62% ± 1.41%, KOAcentrosomal = 25.05% ± 3.41%, WTSingleCentrosome = 91.30% ± 1.74%, KOSingleCentrosome = 53.39% ± 5.04%, WTMultipleCentrosomes = 1.08% ± 0.67%, KOMultipleCentrosomes21.67% ± 3.57%, pWTSingleCentrosome versus KOSingleCentrosome = 0.005, pWTMultiple versus KOMultiple = 0.006, pWTAcentrosomal versus KOAcentrosomal = 0.013, two-way ANOVA with Holm–Sidak’s multiple comparisons test). In total, > 60 WT/KO images, with >100 cells per condition, from N = 5. (L) Examples of WT and KO NPCs, expressing either mCherry or AP-2µ-RFP and co-immunostained for CEP135 (please see Fig 2O for quantification). Immunostaining for mCherry was used to intensify the signal. Scale bars: 10 μm. (M, N) Analysis of shRNA-mediated knockdown efficiency of clathrin heavy chain (CHC). Levels of CHC (mean grey value, m.g.v) are significantly decreased in NPCs expressing shRNA-targeting CHC compared with NPCs expressing scrambled shRNA (scr) (scr = 16,138 ± 959.0, KO = 7045 ± 532.3, P < 0.0001, two-tailed unpaired t test). Expression of a nuclear localized red fluorescent protein (NLS-RFP) from the same vector was used to identify transfected cells. In total, 13 WT/KO images. Scale bars: 10 μm. (O, P) Uptake of fluorescent (Alexa 488) Transferrin is inhibited in NPCs expressing shRNA-targeting CHC compared with NPCs expressing scrambled shRNA (scr set to 100%, shRNA: 36.19 ± 0.20, P < 0.0001, two-tailed unpaired t test). In total, 57 scr and 46 shRNA-transfected cells from N = 3. Scale bars: 10 μm. (Q) Morphology of centrosomes in primary NPCs expressing either shRNA-targeting CHC or scrambled shRNA. Centrosomes were visualized by immunostaining with CEP135. DAPI stain was used to visualize the nuclei. Scale bars: 20 μm. (R) Percentages of primary NPCs expressing either shRNA-targeting CHC or scrambled shRNA that are either acentrosomal or containing single or multiple centrosomes (WTAcentrosomal = 6.49% ± 1.01%, KOAcentrosomal = 12.75% ± 2.00%, WTSingleCentrosome = 93.51% ± 1.01%, KOSingleCentrosome = 85.29% ± 5.20%, WTMultipleCentrosomes = 0.00% ± 0.00%, KOMultipleCentrosomes = 1.96% ± 3.40%, pWTSingleCentrosome versus KOSingleCentrosome = 0.267, pWTMultiplevs KOMultiple = 0.423, pWTAcentrosomal versus KOAcentrosomal = 0.164, two-way ANOVA with Holm–Sidak’s multiple comparisons test). In total, > 60 WT/KO images, from N = 3. Data information: All graphs show mean ± SEM. n.s.—nonsignificant; * indicates P ≤ 0.05; ** indicates P ≤ 0.01; *** indicates P ≤ 0.001; **** indicates P ≤ 0.0001. N represents independent cultures obtained from independent animals. Source data are available for this figure.
Figure 3.
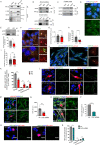
Figure 3.. AP-2 regulates centrosome function at the level of MT nucleation.
(A, B) Representative time series (A) and corresponding kymographs (B) of AP-2µ-mCherry trafficking in NPCs at DIV3 co-transfected with γ-tubulin–GFP. Scale bars, (A) 3 μm, (B) 2 μm × 15 s. (C) Percentage of all AP-2µ-mCherry puncta trafficked towards the centrosome (42.21% ± 6.37%). In total, 24 NPCs. (D) Analysis of MT regrowth after their depolymerization with nocodazole (3.3 μM for 4 h) in WT and KO NPCs at DIV3. Representative fluorescent images indicate NPCs before the nocodazole treatment (control), immediately after the nocodazole washout (0 min) and after 2 and 5 min of nocodazole washout (2 min or 5 min). To visualize the MTs, NPCs were immunostained for α-tubulin; the centrosome was visualized immunostaining with CEP135. Scale bars: 20 μm. Arrows in “recovery 2 min” condition indicate sites of acentrosomal MT regrowth. (E) Analysis of MT density using α-tubulin immunofluorescence in WT and KO NPCs before and after their depolymerization with nocodazole (WTDMSO = 35.09 ± 2.81, KODMSO = 51.93 ± 3.81, WT0 = 5.88 ± 0.76, KO0 = 8.20 ± 0.81, WT2 = 17.39 ± 1.23, KO2 = 36.78 ± 3.00, WT5 = 27.86 ± 2.24, KO5 = 50.82 ± 4.32, pWT0 versus WTcontrol <0.0001, pWT0 versus WT2 = 0.0012, pWT2 versus WT5 = 0.006, pKO0 versus KOcontrol <0.0001, pKO0 versus KO2 < 0.0001, pKO2 versus KO5 = 0.027, one-way ANOVA with Tukey’s multiple comparisons test). >9 images per condition, with each image containing >40 cells, from N = 3. (F) Percentages of WT and KO NPCs with acentrosomal MT regrowth after recovery from nocodazole treatment for 2 min (WT = 14.50 ± 4.59, KO = 40.20 ± 2.36, P = 0.008, two-tailed unpaired t test). In total, 14 WT/KO images, with each image containing >40 cells, from N = 3. (G, H) Representative images and analysis of centrosomal MT number in WT and KO NPCs, after recovery from nocodazole treatment for 2 min (WT = 11.38 ± 0.95, KO = 8.44 ± 0.11, P = 0.037, two-tailed unpaired t test). In total, 45 WT/KO cells from N = 3. Scale bar, 10 μm. (I) Representative time series (left panel) and maximum intensity projection images (middle panel) of 20 s (1 frame/1 s) of EB3-tdTomato- and γ-tubulin–GFP -expressing WT and AP-2 KO NPCs. Right panels indicate growing EB3 tracks from the images shown on the left using TrackMate/ImageJ plugin. EB3 track growth speed is color-coded. Red dots in the right panel indicate centrosome. Scale bars, 10 μm. (J) Histograms of EB3 tracks velocity (μm/s) in WT and KO NPCs. In total, 19 WT and 16 KO images per condition from N = 3. Please see mean velocity and total displacement of EB3 tracks in Fig S3B–D. (K) Histograms of the number of anterograde EB3 tracks plotted against the distance from the centrosome. Gray boxes indicate the distances quantified in Fig 3L and M. In total, 19 WT and 16 KO images per condition from N = 3. (L) Number of anterograde EB3 tracks originating in WT and AP-2 KO NPCs within ≤2 μm from the centrosome (WT = 11.61% ± 0.87%, KO = 8.81% ± 0.72%, P = 0.020, two-tailed unpaired t test). In total, 19 WT and 16 KO images per condition from N = 3. (M) Number of anterograde EB3 tracks originating in WT and AP-2 KO NPCs within >18 μm from the centrosome (WT = 35.22% ± 5.92%, KO = 71.44% ± 14.91%, P = 0.025, two-tailed unpaired t test). In total, 19 WT and 16 KO images per condition from N = 3. The distance of >18 μm likely corresponds to the elongated tubular morphology of KO NPCs (see Fig 1E). (N) Number of retrograde EB3 tracks originating in WT and AP-2 KO NPCs within >2 μm from the centrosome (WT = 59.83% ± 5.73%, KO = 98.63% ± 9.87%, P = 0.001, two-tailed unpaired t test). In total, 19 WT and 16 KO images per condition from N = 3. Please also see histograms of the number of retrograde EB3 tracks in Fig S3A. Data information: a square in Fig 3A indicates the region magnified in Fig 3B. Squares in Fig 3I indicate centrosomal EB3 tracks magnified to the right. All graphs show mean ± SEM. n.s.—nonsignificant. * indicates P ≤ 0.05; ** indicates P ≤ 0.01; *** indicates P ≤ 0.001; **** indicates P ≤ 0.0001.
Figure S3.
Figure S3.. Unaltered mean velocity and total displacement of EB3 tracks in NPCs lacking AP-2µ.
(A) Histograms of number of retrograde EB3 tracks plotted against the distance from the centrosome. In total, 19 WT and 16 KO images per condition from N = 3. (B) Mean velocity of EB3 tracks in WT and KO primary NPCs (WT: 0.40 ± 0.01 μm/sec, KO: 0.39 ± 0.01 μm/sec). (C) Histograms of EB3 track displacement (μm) in WT and KO NPCs. In total, 19 WT and 16 KO images per condition from N = 3. (D) Mean displacement of EB3 tracks in WT and KO primary NPCs per 20 s (WT: 1.78 ± 0.03 μm, KO: 1.77 ± 0.05 μm). (E) Representative images of WT and AP-2 KO neurospheres co-immunostained for nestin and Dcx. DAPI stain was used to visualize the nuclei. Scale bars: 100 μm. (F) Number of migrating WT and AP-2 KO NPCs within the specified time from neuropsheres (6 h: WT = 5.20 ± 0.87, KO = 2.40 ± 0.35, P = 0.006; 12 h: WT = 7.00 ± 1.35, KO = 3.86 ± 0.58; P = 0.002; 24 h: WT = 10.42 ± 1.35, KO = 5.85 ± 0.78, P = 0.007; 48 h: WT = 16.27 ± 0.72, KO = 8.17 ± 0.70, P < 0.0001, repeated measured two-way ANOVA). In total, 15 WT and 15 KO images from N = 3. (G) Analysis of the migration distance of WT and KO NPCs from neurospheres (6 h: WT = 32.8 ± 2.30 μm, KO = 20.14 ± 1.52 μm, P = 0.0006, nWT = 78, nKO = 35; 12 h: WT = 42.95 ± 1.90 μm, KO = 26.45 ± 2.44 μm; p=<0.0001, nWT = 105, nKO = 53; 24 h: WT = 42.46 ± 3.60 μm, KO = 30.36 ± 1.94 μm; P = 0.0016, nWT = 35, nKO = 63; 48 h: WT = 48.40 ± 2.47 μm, KO = 37.47 ± 2.53 μm, P = 0.002, nWT = 105, nKO = 89, repeated measured two-way ANOVA [mixed-effect analysis]). All data are from N = 3. Data information: all graphs show mean ± SEM. n.s.—nonsignificant; * indicates P ≤ 0.05; ** indicates P ≤ 0.01; *** indicates P ≤ 0.001; **** indicates P ≤ 0.0001. N represents independent cultures obtained from independent animals.
Figure 4.
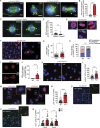
Figure 4.. AP-2 KO NPCs reveal spindle assembly defects and prolonged mitosis, but also show DNA damage and p53 activation.
(A) Spindle morphology of WT and AP-2 KO NPCs revealed by immunostaining with α-tubulin. DAPI stain was used to visualize the nuclei. Scale bars: 3 μm. (B) Percentage of total pHH3+ WT and KO NPCs with abnormal spindle morphology (WT = 3.41% ± 1.92%, KO = 92.59% ± 5.14%, P < 0.0001, two-tailed unpaired t test). In total, 23 WT and 27 KO images, with at least 10 mitotic cells counted per condition, from N = 3. (C) Spindle morphology of WT NPCs treated for 24 h with 30 μM of Pitstop2 or DMSO as a control. Spindles were visualized using α-tubulin antibody. DAPI stain was used to visualize the nuclei. Scale bars: 5 μm. (D) Percentage of pHH3+ WT NPCs with abnormal spindles in DMSO- and Pitstop2-treated condition (Control = 12.96% ± 6.68%, Pitstop2 = 4.50% ± 3.02%, P = 0.248, two-tailed unpaired t test). In total, 9 WT and 10 KO images with at least 20 mitotic cells counted per condition. (E) Representative examples of mitotic phases in WT NPCs, visualized by immunostaining with pHH3. DAPI stain was used to visualize the nuclei. Scale bar, 3 μm. (F) Representative examples of WT and KO NPCs at DIV3 immunostained for pHH3. DAPI stain was used to visualize the nuclei. Scale bars: 6 μm. (G) Percentage of mitotic WT and KO NPCs at DIV3 (WT = 3.40% ± 0.50%, KO = 6.36% ± 1.09%, P = 0.017, two-tailed unpaired t test). In total, 26 WT/KO images with at least 100 cells per condition from N = 3. Please also the relative number of KO NPCs in the G2/M phase in Fig S4B. (H) Mitotic figures in WT and KO NPCs at DIV3 (WTPrometaphase = 37.16% ± 3.75%, KOPrometaphase = 77.45% ± 4.40%, WTMetaphase = 36.54% ± 3.50%, KOMetaphase = 6.24% ± 2.27%, WTAna−/Telo-phase = 26.75% ± 2.88%, KOAna/Telpohase = 16.24% ± 3.40%, pWTPrometaphase versus pKOPrometaphase<0.0001, pWTMetaphase versus pKOMetaphase<0.0001, two-way ANOVA with Holm–Sidak’s multiple comparisons test). In total, 37 WT and 41 KO images with in total >80 mitotic cells pro condition from N = 3. (I) Representative examples of lagging chromosomes in KO NPCs, visualized using pHH3 antibody. Scale bars: 3 μm. (J) Percentage of pHH3+ WT and KO NPCs with lagging chromosomes at DIV3 (WT = 0.00% ± 0.00%, KO = 18.67% ± 5.42%, P < 0.0001, two-tailed unpaired t test). In total, 29 WT and 15 KO images which contained cells in Ana-/Telophase, with total >80 mitotic cells pro condition from N = 3. (K) Representative images of WT and AP-2 KO NPCs immunostained for γ-H2AX. DAPI stain was used to visualize the nuclei. Scale bars: 30 μm. (L) Percentage of γ-H2AX+ WT and AP-2 KO NPCs (WT = 21.14% ± 2.31%, KO = 48.54% ± 4.24%, P < 0.0001, two-tailed unpaired t test). In total, 26 WT/KO images, with at least 100 cells counted per condition from N = 3. (M) Representative images of WT and AP-2 KO NPCs immunostained for p53. DAPI stain was used to visualize the nuclei. Scale bars: 30 μm (5 μm inserts). (N) Percentage of p53+ WT and AP-2 KO NPCs (WT = 21.53% ± 3.33%, KO = 73.60% ± 3.05%, P < 0.0001, two-tailed unpaired t test). In total 30 WT/KO, with at least 100 cells counted per condition from N = 3. (O, P) Representative images of WT and KO NPCs at DIV5, grown in the media, which induces spontaneous differentiation and immunostained for doublecortin X (Dcx). DAPI stain was used to visualize the nuclei. Scale bars: 50 μm (20 μm inserts). (Q) Percentage of Dcx-positive cells among WT and KO NPCs at DIV3 and DIV5 (WTDIV3 = 8.97% ± 1.34%, KODIV3 = 16.87% ± 2.15%, WTDIV5 = 8.07% ± 1.13%, KO DIV5 = 14.95% ± 2.10%, pWTDIV3 versus pKODIV3 = 0.005, pWTDIV3 versus pKODIV3 = 0.007, two-tailed unpaired t test). ≥24 WT/KO images with >70 total cells counted per condition, from N = 3. Data information: squares in Fig 4M and O indicate the regions magnified. Arrows in Fig 4A and 4C indicate mitotic spindles. All graphs show mean ± SEM. n.s.—nonsignificant; * indicates P ≤ 0.05; ** indicates P ≤ 0.01; *** indicates P ≤ 0.001; **** indicates P ≤ 0.0001. N represents independent cultures obtained from independent animals.
Figure S4.
Figure S4.. Loss of AP-2µ induces cellular senescence.
(A, B) Percentage of WT and KO NPCs in G2/M stage of the cell cycle (WT = 25.82% ± 2.88%, KO = 13.54% ± 1.55%, P < 0.0005, two-tailed unpaired t test). In total, 26 WT/KO images from N = 3. NPCs were immunostained for pHH3. DAPI stain was used to visualize the nuclei. Arrows indicate the cells in G2 stage of the cell cycle. Scale bar, 50 μm. (C) Percentage of mitotic NPCs treated for 24 h either with DMSO or with 30 μM of Pitstop2 (WT = 13.53% ± 1.73%, KO = 13.02% ± 1.15%, P = 0.810, two-tailed unpaired t test). In total, 16 WT/KO images with at least 100 cells per condition from N = 3. (D) Senescence-associated β-galactosidase activity (blue staining) in WT and AP-2 KO NPCs. Scale bars: 100 μm. (E) Percentage of SA-β-gal–positive cells in WT and AP-2 KO NPCs (WT = 8.47% ± 0.95%, KO = 48.70% ± 3.19%, P = < 0.0001, nWT = 30, nKO = 30, two-tailed unpaired t test). Data are from N = 3. Data information: all graphs show mean ± SEM. n.s.—non-significant; * indicates P ≤ 0.05; ** indicates P ≤ 0.01; *** indicates P ≤ 0.001; **** indicates P ≤ 0.0001. N represents independent cultures obtained from independent animals.
Figure S5.
Figure S5.. Loss of proliferation in pMEFs lacking AP-2µ.
(A, B) Western Blot analysis of protein levels of AP-2α in WT and AP-2 KO pMEFs at DIV3 (WT set to 100%, KO: 26.19% ± 14.48%; P = 0.007, N = 3 WT/KO, two-tailed unpaired t test). (C) Example histograms of cell cycle analysis in WT and AP-2 KO pMEFs. (D) Proliferation ability of WT and AP-2 KO pMEFs analyzed using the EdU pulse assay, where EdU is directly coupled with Alexa488. DAPI stain was used to visualize the nuclei. Scale bars: 50 μm. (E) Percentage of proliferating WT and KO pMEFs (EdU+ cells) (WT = 46.27% ± 3.55%, KO = 29.15% ± 2.65%, P = 0.0006, two-tailed unpaired t test). In total, 16 WT/KO images from N = 2. (F) Percentage of total GCP2 overlapping with CEP135 in WT and KO pMEFs (WT = 21.95 ± 1.97, KO = 8.24 ± 1.58, P < 0.0001, two-tailed unpaired t test). Total GCP2 was set to 100% in each condition. In total, 15 WT/KO images from N = 3. (G) Percentage of total GCP3 overlapping with γ-tubulin in WT and KO pMEFs (WT = 38.03 ± 5.37, KO = 15.61 ± 2.61, P = 0.0008, two-tailed unpaired t test). Total GCP3 was set to 100% in each condition. In total, 15 WT/KO images from N = 3. Data information: all graphs show mean ± SEM. n.s.—nonsignificant; * indicates P ≤ 0.05; ** indicates P ≤ 0.01; *** indicates P ≤ 0.001; **** indicates P ≤ 0.0001. N represents independent cultures obtained from independent animals.
Figure 5.
Figure 5.. Proliferation defects and loss of centrosomal integrity are observed in AP-2µ-deficient primary MEFs.
(A) Relative number of WT and AP-2 KO primary MEFs at DIV3 (WT set to 100%, KO = 50.853% ± 8.40%, P = 0.0042, NWT = 3, NKO = 3, two-tailed unpaired t test). (B) Representative examples of WT and KO primary MEFs at DIV3 immunostained for pHH3. DAPI stain was used to visualize the nuclei. Scale bars: 63 μm. (C) Percentage of mitotic WT and KO primary MEFs (WT = 9.97% ± 0.82%, KO = 16.45% ± 1.62%, P = 0.002, two-tailed unpaired t test). In total, 33 WT and 49 KO images with at least 100 cells per condition from N = 3. (D) Mitotic figures in WT and KO primary MEFs (WTPrometaphase = 30.93% ± 5.85%, KOPrometaphase = 52.87% ± 5.68%, WTMetaphase = 19.44% ± 5.02%, KOMetaphase = 15.82% ± 4.57%, WTAna−/Telo-phase = 49.63% ± 6.12%, KOAna/Telpohase = 31.32% ± 5.12%, pWTPrometaphase versus pKOPrometaphase = 0.046, two-way ANOVA with Holm–Sidak’s multiple comparisons test). In total, 45 WT and 59 KO images from N = 4. (E) Spindle morphology of WT and AP-2 KO primary MEFs revealed by immunostaining with α- tubulin and pHH3 antibodies. Scale bars: 6.5 μm. (F) Percentage of pHH3+ WT and KO primary MEFs with abnormal spindle morphology (WT = 22.73% ± 7.247%, KO = 51.04% ± 6.11%, P = 0.004, two-tailed unpaired t test). In total 33 WT and 49 KO images per condition from N = 3. (G) Representative examples of lagging chromosomes in DIV3 KO primary MEFs, visualized by pHH3 antibody. Scale bars: 6.5 μm. (H) Percentage of pHH3+ WT and KO primary MEFs with lagging chromosomes (WT = 0.97% ± 0.97%, KO = 21.83% ± 4.82%, P = 0.0004, two-tailed unpaired t test). In total 32 WT and 31 KO images per condition from N = 3. (I) Morphology of the centrosomes in WT and KO pMEFs visualized by co-immunostaining with γ-tubulin and CEP135. DAPI stain was used to visualize the nuclei. Scale bars: 20 μm. (J) Percentages of WT and KO pMEFs which are either acentrosomal or containing single or multiple centrosomes at DIV3 (WTAcentrosomal = 32.54% ± 1.62%, KOAcentrosomal = 38.53% ± 2.38%, WTSingleCentrosome = 64.47% ± 0.99%, KOSingleCentrosome = 37.11% ± 1.31%, WTMultipleCentrosomes = 2.99% ± 0.70%, KOMultipleCentrosomes24.36% ± 2.28%, pWTSingleCentrosome versus KOSingleCentrosome = 0.007, pWTMultiple versus KOMultiple = 0.03, two-way ANOVA with Holm–Sidak’s multiple comparisons test). In total, 60 WT/KO images, with >100 cells per condition, from N = 3. (K) Cell cycle analysis by DNA content estimation with flow cytometry in WT and AP-2 KO pMEFs. The graph indicates the percentages of cells in G1, S, and G2/M phases of the cell cycle (WTG1 = 67.25% ± 1.75%, KOG1 = 62.00% ± 6.42%, P = 0.350, WTS = 12.25% ± 0.75%, KOS = 6.75% ± 0.25%, P = 0.023, WTG2/M = 17.25% ± 1.93%, KOG2/M = 29.00% ± 3.87%, P = 0.038, two-way ANOVA with Holm–Sidak’s multiple comparisons test). In addition, significant differences were found between WT and KO in the overall distribution of cell cycle phases with the x2 test using the original cell counts (P < 0.001 for each independent N). WT/KO = 20,000 events, from N = 4. Please see also representative histograms in Fig S5C. (L) WT and KO pMEFs at DIV3 immunostained for GCP2 and co-immunostained for CEP135. DAPI stain was used to visualize the nuclei. Representative fluorescent images from N = 3. Scale bars: 10 μm, inserts 2 μm. (M) WT and KO pMEFs at DIV3 immunostained for GCP3 and co-immunostained for γ-tubulin. DAPI stain was used to visualize the nuclei. Representative fluorescent images from N = 3. Scale bars: 10 μm, inserts 2 μm. (N) Levels of GCP2 at the centrosome, marked by CEP135 (mean grey value, m.g.v) in WT and KO pMEFs (WT = 49,669 ± 1651, KO = 41,286 ± 2484, P = 0.0086, two-tailed unpaired t test). In total 15 WT/KO images from N = 3. (O) Levels of GCP3 at the centrosome, marked by γ-tubulin (mean grey value, m.g.v) in WT and KO pMEFs (WT = 35,464 ± 2226, KO = 29,871 ± 1557, P = 0.049, two-tailed unpaired t test). In total, 15 WT/KO images from N = 3. (P) Analysis of MT regrowth after their depolymerization with nocodazole (3.3 μM for 4 h) in WT and KO pMEFs at DIV3. Representative fluorescent images indicate pMEFs before the nocodazole treatment (control), immediately after the nocodazole washout (0 min) and after 2 and 5 min of nocodazole washout (2 or 5 min). To visualize the MTs, pMEFs were immunostained for α-tubulin, the centrosome was visualized immunostaining with CEP135. Scale bars: 20 μm. (Q) Percentages of WT and KO pMEFs with acentrosomal MT regrowth after recovery from nocodazole treatment for 2 min (WT = 19.49 ± 6.67, KO = 56.73 ± 7.26, P = 0.019, two-tailed unpaired t test). In total, 41 WT/KO images, with each image containing >40 cells, from N = 3. (R) Analysis of centrosomal MT number in WT and KO pMEFs, after recovery from nocodazole treatment for 2 min (WT = 11.21 ± 0.70, KO = 7.67 ± 0.35, P = 0.010, two-tailed unpaired t test). In total, 34 WT/KO cells from N = 3. Scale bar, 10 μm. Data information: squares in Figs 5I, L, M, and P indicate regions magnified. Arrows in Fig 5E indicate mitotic spindles. All graphs show mean ± SEM. n.s.—nonsignificant; * indicates P ≤ 0.05; ** indicates P ≤ 0.01; *** indicates P ≤ 0.001; **** indicates P ≤ 0.0001. N represents independent cultures obtained from independent animals.
Figure 6.
Figure 6.. Proliferation defects in AP-2µ-deficient MEFs are rescued by inactivating the Rb- and p53-dependent checkpoints.
(A) Schematic illustration of immortalization of primary MEFs using the simian vacuolating (SV) 40 large T antigen virus. (B) Representative examples of WT and KO immortalized MEFs (iMEFs) immunostained for pHH3. DAPI stain was used to visualize the nuclei. Scale bars: 5 μm. (C) Percentage of mitotic WT and KO iMEFs (WT = 6.64% ± 0.60%, KO = 5.97% ± 0.7%, P = 0.400, two-tailed unpaired t test). In total 24 WT and 25 KO images with > 67 mitotic cells per condition from N = 3. (D) Mitotic figures in WT and KO iMEFs (WTProphase = 29.80% ± 6.41%, KOProphase = 33.13% ± 5.83%, WTMetaphase = 20.73% ± 4.93%, KOMetaphase = 35.07% ± 5.77%, WTAna−/Telo-phase = 49.47% ± 6.23%, KOAna/Telpohase = 31.80% ± 5.03%, pWTMetaphase versus pWTAna−/Telo-phase = 0.008, two-way ANOVA with Holm–Sidak’s multiple comparisons test). In total 25 WT/KO images from N = 3. (E) Percentage of proliferating WT and KO iMEFs (EdU+ cells) (WT = 64.51% ± 2.52%, KO = 71.29% ± 1.83%, P = 0.034, two-tailed unpaired t test). In total, 30 WT/KO images, with at least 300 EdU cell and 1500 total cells per condition, from N = 3. Please see the corresponding images in Fig S6D. (F) Spindle morphology of WT and AP-2 KO iMEFs revealed by immunostaining with α-tubulin and pHH3 antibodies. Scale bars: 6.5 μm. (G) Percentage of pHH3+ WT and KO iMEFs with abnormal spindle morphology (WT = 11.47% ± 3.70%, KO = 34.27% ± 6.56%, P = 0.004, two-tailed unpaired t test). In total 25 WT/KO images per condition from N = 3. (H) Morphology of centrosomes in WT and KO iMEFs visualized by co-immunostaining with γ-tubulin and CEP135. DAPI stain was used to visualize the nuclei. Scale bars: 20 μm. (I) Percentages of WT and KO iMEFs which are either acentrosomal or containing single or multiple centrosomes at DIV3 (WTAcentrosomal = 15.19% ± 1.01%, KOAcentrosomal = 11.37% ± 0.16%, WTSingleCentrosome = 76.48% ± 2.12%, KOSingleCentrosome = 61.57% ± 2.94%, WTMultipleCentrosomes = 8.10% ± 2.87%, KOMultipleCentrosomes27.06% ± 2.78%, pWTSingleCentrosome versus KOSingleCentrosome = 0.0360, pWTMultiple versus KOMultiple = 0.024, two-way ANOVA with Holm–Sidak’s multiple comparisons test). In total >45 WT/KO images, with >50 cells per condition, from N = 3. (J) Analysis of MT regrowth after their depolymerization with nocodazole (3.3 μM for 4 h) in WT and KO iMEFs. Representative fluorescent images indicate iMEFs before the nocodazole treatment (control), immediately after the nocodazole washout (0 min) and after 2 and 5 min of nocodazole washout (2 or 5 min). To visualize the MTs, iMEFs were immunostained for α-tubulin; the centrosome was visualized immunostaining with CEP135. Scale bars: 20 μm. (K) Percentages of WT and KO iMEFs with acentrosomal MT regrowth after recovery from nocodazole treatment for 2 min (WT = 15.87 ± 0.79, KO = 63.41 ± 4.70, P = 0.0006, two-tailed unpaired t test). In total, 30 WT/KO images, with each image containing >100 cells, from N = 3. (L) Analysis of centrosomal MT number in WT and KO iMEFs, after recovery from nocodazole treatment for 2 min (WT = 6.70 ± 0.80, KO = 3.36 ± 0.28, P = 0.010, two-tailed unpaired t test). In total, 80 WT/KO cells from N = 3. Scale bar, 10 μm. (M) Hypothetical model of how AP-2 regulates cell proliferation of NPCs. In the WT condition, AP-2 associates with γ-TuRC components and localizes to the centrosomes, where it regulates the growth of centrosomal MTs, a function essential for bipolar spindle formation and mitotic progression. Loss of AP-2 impairs the localization of γ-TuRC to the centrosome, impairing its function at the level of MT nucleation, and leads to either premature neuronal differentiation or cell death. Data information: squares in Fig 6H and J indicate the regions magnified. Arrows in Fig 6F indicate mitotic spindles. All graphs show mean ± SEM. n.s.—nonsignificant; * indicates P ≤ 0.05; ** indicates P ≤ 0.01; *** indicates P ≤ 0.001; **** indicates P ≤ 0.0001. N represents independent cultures obtained from independent animals.
Figure S6.
Figure S6.. Rescue of proliferation defects but not GCP2/GCP3 localization in immortalized MEFs lacking AP-2µ.
(A) Absolute number of WT and AP-2 KO iMEFs (per 63x field of view) (WT = 46.42 ± 5.35, KO = 48.24 ± 2.46). 25 WT/KO images from N = 3. (B) Example histograms of cell cycle analysis in WT and AP-2 KO iMEFs. (C) Cell cycle analysis by DNA content estimation with flow cytometry in WT and AP-2 KO iMEFs at DIV3. The graph indicates the percentages of cells in G1, S, and G2/M phases of the cell cycle (WTG1 = 61.08% ± 1.50%, KOG1 = 63.34% ± 0.82%, P = 0.440, WTS = 12.35% ± 1.92%, KOS = 8.57% ± 0.68%, P = 0.253, WTG2/M = 26.05% ± 0.26%, KOG2/M = 27.80% ± 1.34%, P = 0.440, two-way ANOVA with Holm–Sidak’s multiple comparisons test). WT/KO = 20,000 events, from N = 3. (D) Proliferation ability of WT and AP-2 KO iMEFs analyzed using the 24-h EdU pulse assay, where EdU is directly coupled with Alexa488. DAPI stain was used to visualize the nuclei. Scale bars: 30 μm. Please see also the quantification in Fig 6E. (E) Morphology and analysis of centrosomes in WT and KO iMEFs visualized by immunostaining with γ-tubulin and PCNT. DAPI stain was used to visualize the nuclei. Scale bars: 10 μm. (F) Percentage of WT and AP-2 KO iMEFs with organized centrosome measured by γ-Tubulin/PCNT co-localization (WT = 79.59% ± 6.92%, KO = 24.65% ± 1.20%, P = 0.001, two-tailed unpaired t test). At least 30 WT/KO images with >300 cells pro condition from N = 3. (G) Percentage of pHH3+ WT and KO iMEFs with lagging chromosomes (WT = 2.00% ± 2.00%, KO = 14.47% ± 4.90%, P = 0.023, two-tailed unpaired t test). In total 25 WT/KO images per condition from N = 3. (H) WT and KO iMEFs at DIV3 immunostained for GCP2 and co-immunostained for CEP135. DAPI stain was used to visualize the nuclei. Representative fluorescent images from N = 3. Scale bars: 10 μm, inserts 2 μm. (I) Levels of GCP2 at the centrosome, marked by CEP135 (mean grey value, m.g.v) in WT and KO iMEFs (WT = 50,590 ± 1484, KO = 41,422 ± 1097, P < 0.0001, two-tailed unpaired t test). In total 15 WT and 30 KO images from N = 3. (J) Percentage of total GCP2 overlapping with CEP135 in WT and KO iMEFs (WT = 62.00 ± 2.73, KO = 25.27 ± 4.57, P < 0.0001, two-tailed unpaired t test). Total GCP2 was set to 100% in each condition. In total, 15 WT/KO images from N = 3. (K) WT and KO iMEFs at DIV3 immunostained for GCP3 and co-immunostained for γ-Tubulin. DAPI stain was used to visualize the nuclei. Representative fluorescent images from N = 3. Scale bars: 10 μm, inserts 2 μm. (L) Levels of GCP3 at the centrosome, marked by γ-tubulin (mean grey value, m.g.v) in WT and KO iMEFs (WT = 53,333 ± 2372, KO = 41,750 ± 1629, P = 0.0003, two-tailed unpaired t test). In total, 15 WT/KO images from N = 3. (M) Percentage of total GCP3 overlapping with γ-tubulin in WT and KO iMEFs (WT = 35.53 ± 2.24, KO = 28.04 ± 2.41, P = 0.031, two-tailed unpaired t test). Total GCP3 was set to 100% in each condition. In total 15 WT/KO images from N = 3. Data information: all graphs show mean ± SEM. n.s.—nonsignificant; * indicates P ≤ 0.05; ** indicates P ≤ 0.01; *** indicates P ≤ 0.001; **** indicates P ≤ 0.0001. N represents independent cultures obtained from independent animals.

References

    1. Ali A, Vineethakumari C, Lacasa C, Lüders J (2023) Microtubule nucleation and γTuRC centrosome localization in interphase cells require ch-TOG. Nat Commun 14: 289. 10.1038/s41467-023-35955-w - DOI - PMC - PubMed
    1. Andres-Alonso M, Ammar MR, Butnaru I, Gomes GM, Acuña Sanhueza G, Raman R, Yuanxiang P, Borgmeyer M, Lopez-Rojas J, Raza SA, et al. (2019) SIPA1L2 controls trafficking and local signaling of TrkB-containing amphisomes at presynaptic terminals. Nat Commun 10: 5448. 10.1038/s41467-019-13224-z - DOI - PMC - PubMed
    1. Arendt T (2012) Cell cycle activation and aneuploid neurons in alzheimer’s disease. Mol Neurobiol 46: 125–135. 10.1007/s12035-012-8262-0 - DOI - PubMed
    1. Balestra FR, Strnad P, Flückiger I, Gönczy P (2013) Discovering regulators of centriole biogenesis through siRNA-based functional genomics in human cells. Dev Cell 25: 555–571. 10.1016/j.devcel.2013.05.016 - DOI - PubMed
    1. Bartolini F, Gundersen GG (2006) Generation of noncentrosomal microtubule arrays. J Cell Sci 119: 4155–4163. 10.1242/jcs.03227 - DOI - PubMed

Publication types