. 2023 Dec 12;14(1):8252.
doi: 10.1038/s41467-023-43397-7.

ZNF524 directly interacts with telomeric DNA and supports telomere integrity

Affiliations

ZNF524 directly interacts with telomeric DNA and supports telomere integrity

Hanna Braun et al. Nat Commun. .

Abstract

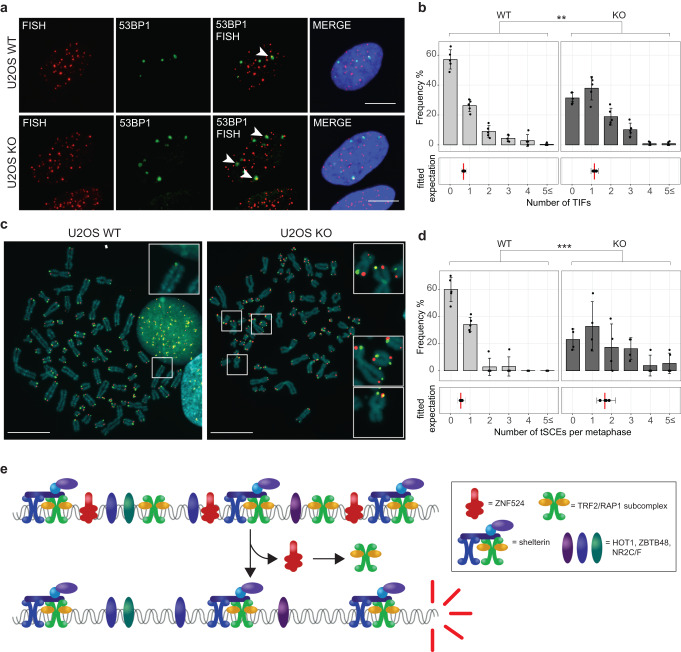
Telomeres are nucleoprotein structures at the ends of linear chromosomes. In humans, they consist of TTAGGG repeats, which are bound by dedicated proteins such as the shelterin complex. This complex blocks unwanted DNA damage repair at telomeres, e.g. by suppressing nonhomologous end joining (NHEJ) through its subunit TRF2. Here, we describe ZNF524, a zinc finger protein that directly binds telomeric repeats with nanomolar affinity, and reveal base-specific sequence recognition by cocrystallization with telomeric DNA. ZNF524 localizes to telomeres and specifically maintains the presence of the TRF2/RAP1 subcomplex at telomeres without affecting other shelterin members. Loss of ZNF524 concomitantly results in an increase in DNA damage signaling and recombination events. Overall, ZNF524 is a direct telomere-binding protein involved in the maintenance of telomere integrity.


Conflict of interest statement

The authors declare no competing interests.

Figures

Fig. 1
Fig. 1. ZNF524 directly binds TTAGGG repeats through its zinc fingers.
a Schematic overview of the ZNF524 protein with its four C-terminal zinc fingers. b DNA pulldowns with canonical and variant telomeric repeats using HeLa and U2OS lysates (n = 1). c DNA pulldowns with individual FLAG-ZNF524 ZF mutants overexpressed in HEK293 cells (n = 1). d Isothermal titration calorimetry results for different combinations of ZNF524 ZFs with a 12-bp ds(TTAGGG)2. KD values with standard deviations are noted in the lower right corner.
Fig. 2
Fig. 2. Crystal structure reveals base-specific interactions of all four ZFs.
a Overall structure of the four zinc fingers (ZF1 (blue), ZF2 (violet), ZF3 (green) and ZF4 (salmon)) in complex with duplex telomeric DNA (G-strand (orange), C-strand (cyan)), (b) Schematic representation of base-specific contacts of the ZFs with telomeric sequences. Hydrogen bonds (blue) and van der Waals contacts (black) are highlighted. c Details of the base-specific contacts for each individual ZF. The hydrogen bonds and van der Waals contacts are depicted as black dashed lines. d Sequence alignment of ZF1, ZF2, ZF3 and ZF4 of ZNF524, ZF11 of ZBTB48 and ZF2 of ZBTB10. The four zinc-coordinating residues of each finger are highlighted with a blue background. The first zinc-coordinating histidine in each finger serves as reference position 0 for the RxxHxxR motif (bold).
Fig. 3
Fig. 3. ZNF524 localizes to telomeres in U2OS cells.
a Fluorescence microscopy of colocalization between TRF2 (red) and GFP-ZNF524 (green). Representative images of doxycycline-induced ZNF524-GFP WT and the ZF2 mutant in U2OS cells are shown (scale bar 10 µm). Nuclei were counterstained with DAPI (blue). b Quantification of colocalization events of ZNF524-GFP WT with TRF2 (n = 99 nuclei). Telomeric foci and the overlap with GFP foci were scored on maximum intensity projections of the acquired z-stacks. c Representative slot blot after ChIP using GFP-Trap beads for enrichment of ZNF524-GFP WT and ZF2 mut, visualized using a telomeric probe (left) and an Alu control (right). NLS-GFP served for normalization. d Quantification of ChIP experiments normalized to NLS-GFP (n = 3 with each replicate seeded and induced independently; mean values are shown with error bars representing SD; *p < 0.05 [p = 0.026], Welch’s test). e Quantification of ChIP-seq experiments comparing ZNF524-GFP WT to ZNF524-GFP ZF2 mut and NLS-GFP negative controls. A minimum of 7 and a maximum of 25 hexameric repeats were considered for quantification (n = 3 with each replicate seeded and induced independently; The error bars represent 95% confidence intervals; *p < 0.001 [WT vs ZF2 mut Telo: p = 0.00027; WT vs NLS Telo: p = 9.66e-5; WT vs ZF2 mut Alu: p = 0.137; WT vs NLS Alu: p = 0.283], one-way ANOVA followed by Dunnett’s multiple comparison tests). f Volcano plot of BioID assay comparing proximity partners of ZNF524 WT versus ZNF524 ZF2 mut in U2OS cells. BirA*-ZNF524 WT and ZF2 mut were induced with 300 ng ml−1 doxycycline. Specifically-enriched proteins (red numbered circles) are distinguished from background binders by a > 4-fold enrichment and p < 0.01 (two-sided Student’s t-test, n = 4 with each replicate seeded and induced independently). Two-dimensional error bars represent the standard deviation after iterative imputation cycles during the label-free analysis with substituted zero values (e.g. no detection in the ZF2 mut reaction).
Fig. 4
Fig. 4. ZNF524 KO leads to a reduction in TRF2 and RAP1 at telomeres.
a Representative immunofluorescence images of U2OS WT and ZNF524 KO cells stained for TRF1 (green) and TRF2 (red). Nuclei were counterstained with DAPI (blue). b Quantification of TRF1 and TRF2 IF signals in WT and KO clones as well as KO clones induced with 2 µg mL−1 doxycycline for expression of HA-ZNF524 WT or HA-ZNF524 ZF2mut. The violin plot shows the individual data points as densities. A total of 1487-4576 telomeres per clone were analyzed for TRF1, and 2300-5290 telomeres per clone for TRF2; *p < 0.05 (n = 5). For TRF2 IF signal quantification, the p-values are as follows: WT vs KO: p = 0.0253; WT vs KO + ZNF524 WT: p = 0.220; WT vs KO + ZNF524 ZF2 mut: p = 0.0131; KO vs KO + ZNF524 ZF2 mut: p = 0.760; KO vs KO + ZNF524 WT: p = 0.011; KO + ZNF524 WT vs KO + ZNF524 ZF2 mut: p = 0.0112 (c) Representative IF pictures of U2OS WT and ZNF524 KO cells stained for RAP1 (green). d Quantification of the RAP1 IF signal in WT and KO clones depicted as violin plots. 2245-5290 telomeres per clone were analyzed; *p < 0.05 [p = 0.0249] (n = 5). e Representative IF pictures of native metaphase spreads of U2OS WT and ZNF524 KO clones stained for TRF2 (green). f Quantification of the TRF2 signal on metaphase spreads depicted as violin plots. A total of 1494-6875 telomeres per clone were analyzed; *p < 0.05 [p = 0.013] (n = 4). g Quantitative Western blot showing total TRF2 and RAP1 protein levels in U2OS WT and ZNF524 KO clones with GAPDH as a loading control. h Quantification of TRF2 and RAP1 signals normalized to GAPDH. The bar plot shows the mean intensities ± SD. The intensity values of the individual clones are depicted as black dots. Statistical comparison by a two-sided Student’s t-test (n = 5). For all data n represent the number of independent clones used as biological replicates. For all IF data, scale bars represent 10 µm in all panels; p-values were determined by a paired one-sided Student’s t-test; the mean is indicated by a solid line.
Fig. 5
Fig. 5. Removal of ZNF524 results in telomeric aberrations.
a 53BP1 immunofluorescence staining (green) coupled with telomeric FISH (red) indicates telomere dysfunction-induced foci (TIFs, white arrows), scale bars represent 10 µm. Nuclei were counterstained with DAPI (blue). b Quantification of TIFs per cell; 5 WT and 5 KO clones were counted with at least 35 nuclei per clone; upper plot: Frequency of cells with the indicated number of TIFs; error bars represent SD; lower plot: the vertical lines (red) represent the fitted expected number of TIFs (GLMM for negative binomially distributed data). Error bars represent 95% confidence intervals for the mean number of TIFs. The p-value was calculated using a likelihood ratio test; **p < 0.01 (n = 5 based on 5 independent clones for all conditions). c CO-FISH with Cy3-labeled G-rich telomere probe (red) and FITC-labeled C-rich telomere probe (green). Scale bars represent 10 µM. Metaphases were counterstained with DAPI (blue). d Quantification of telomeric sister chromatid exchanges (t-SCE) per metaphase; 5 WT and 4 KO clones were counted with at least 10 metaphase spreads per clone; upper plot: Frequency of cells with the indicated number of t-SCEs; error bars represent SD; lower plot: the vertical lines (red) represent the fitted expected number of t-SCEs (GLMM for negative binomially distributed data). Error bars represent 95% confidence intervals for the mean number of t-SCEs. The p-value was calculated using a likelihood ratio test; ***p < 0.001 (n = 5 for WT and n = 4 for KO). e Schematic model of ZNF524’s proposed function at telomeres.

References

    1. Voronina N, et al. The landscape of chromothripsis across adult cancer types. Nat. Commun. 2020;11:2320. doi: 10.1038/s41467-020-16134-7. - DOI - PMC - PubMed
    1. Broccoli D, Smogorzewska A, Chong L, de Lange T. Human telomeres contain two distinct Myb-related proteins, TRF1 and TRF2. Nat. Genet. 1997;17:235. doi: 10.1038/ng1097-231. - DOI - PubMed
    1. de Lange T. Shelterin-mediated telomere protection. Annu. Rev. Genet. 2018;52:223–247. doi: 10.1146/annurev-genet-032918-021921. - DOI - PubMed
    1. Court R, Chapman L, Fairall L, Rhodes D. How the human telomeric proteins TRF1 and TRF2 recognize telomeric DNA: A view from high-resolution crystal structures. EMBO Rep. 2005;6:39–45. doi: 10.1038/sj.embor.7400314. - DOI - PMC - PubMed
    1. Bilaud T, et al. Telomeric localization of TRF2, a novel human telobox protein. Nat. Genet. 1997;17:239. doi: 10.1038/ng1097-236. - DOI - PubMed

Publication types