. 2023 Dec 12;14(1):8249.
doi: 10.1038/s41467-023-44022-3.

Phyloecology of nitrate ammonifiers and their importance relative to denitrifiers in global terrestrial biomes

Affiliations

Phyloecology of nitrate ammonifiers and their importance relative to denitrifiers in global terrestrial biomes

Aurélien Saghaï et al. Nat Commun. .

Abstract

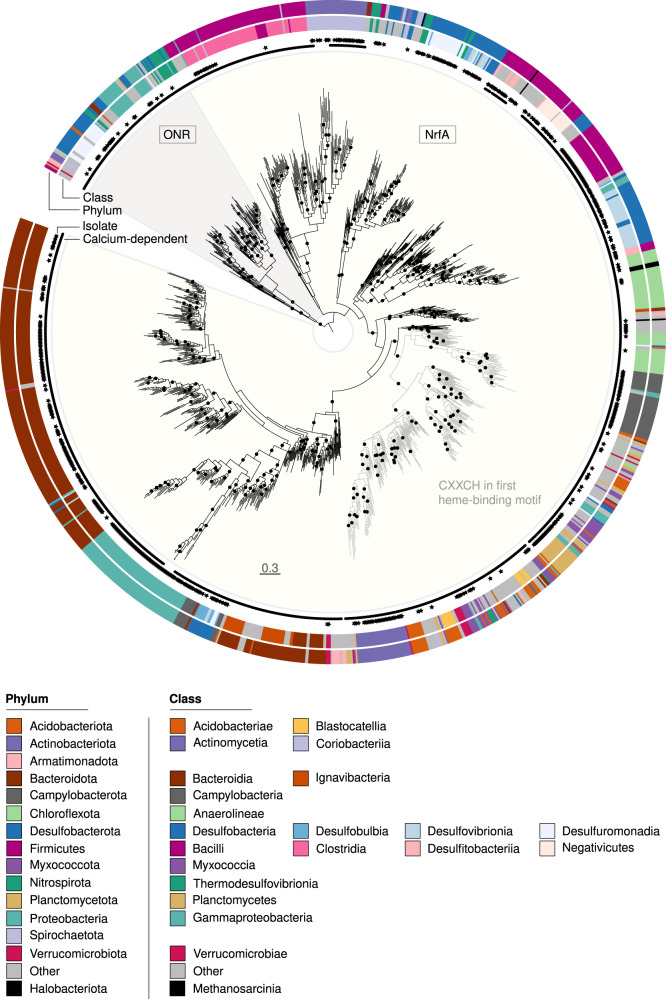
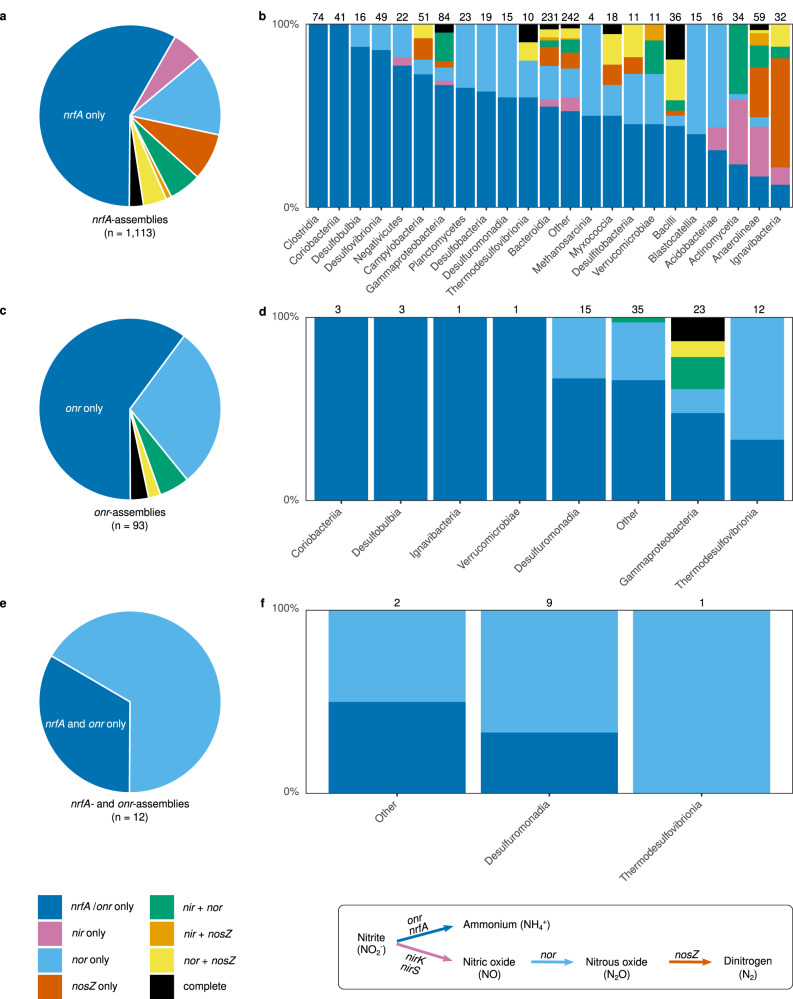
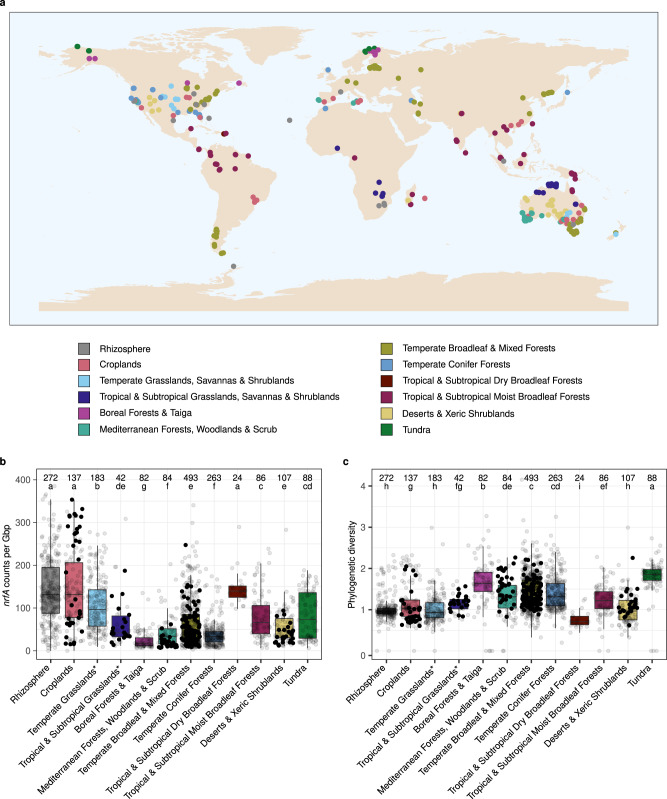
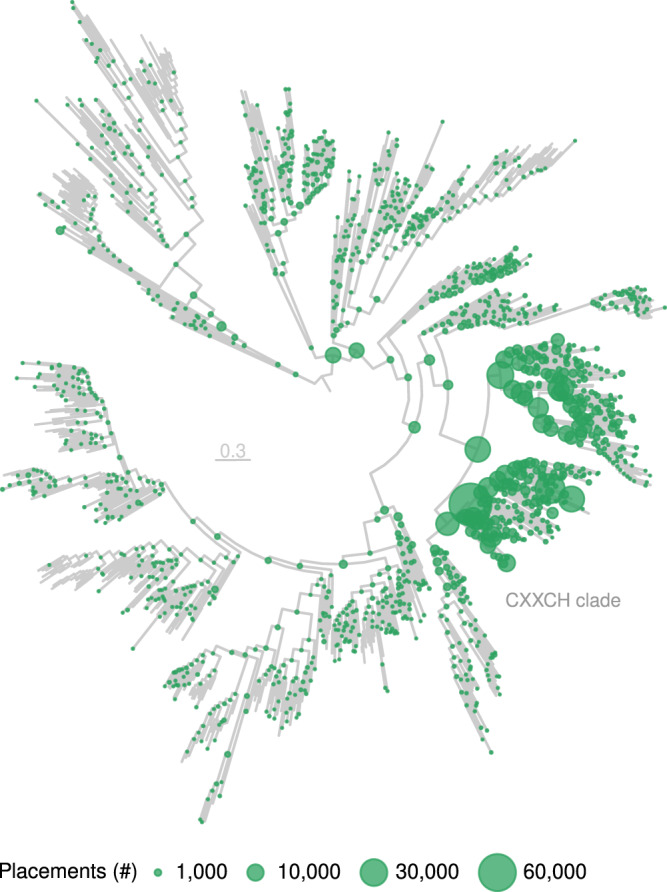
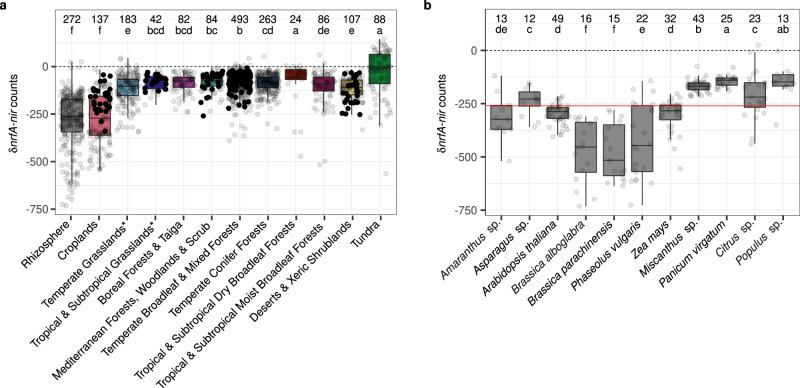
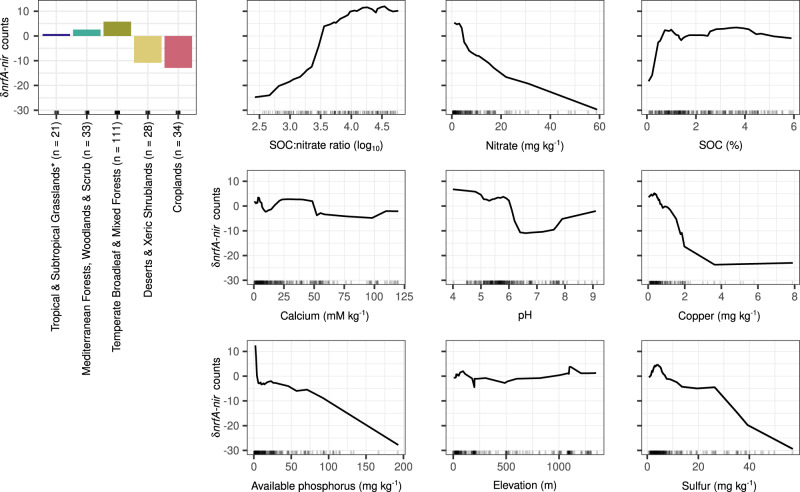
Nitrate ammonification is important for soil nitrogen retention. However, the ecology of ammonifiers and their prevalence compared with denitrifiers, being competitors for nitrate, are overlooked. Here, we screen 1 million genomes for nrfA and onr, encoding ammonifier nitrite reductases. About 40% of ammonifier assemblies carry at least one denitrification gene and show higher potential for nitrous oxide production than consumption. We then use a phylogeny-based approach to recruit gene fragments of nrfA, onr and denitrification nitrite reductase genes (nirK, nirS) in 1861 global terrestrial metagenomes. nrfA outnumbers the nearly negligible onr counts in all biomes, but denitrification genes dominate, except in tundra. Random forest modelling teases apart the influence of the soil C/N on nrfA-ammonifier vs denitrifier abundance, showing an effect of nitrate rather than carbon content. This study demonstrates the multiple roles nitrate ammonifiers play in nitrogen cycling and identifies factors ultimately controlling the fate of soil nitrate.


Conflict of interest statement

The authors declare no competing interests.

Figures

Fig. 1
Fig. 1. Maximum likelihood phylogeny of 1261 NrfA and ONR sequences from 1218 genome assemblies inferred from the alignment of 350 amino acid positions.
Calcium-dependent sequences are indicated by circles in the inner ring. Sequences obtained from isolates are shown by black stars and the rest are obtained from metagenome-assembled genomes. Taxonomic classification at the phylum and class level of the most abundant classes (n > 10, except for the archaeal class Methanosarcinia where n = 5) is indicated by the color in the two outer rings and is based on the Genome Taxonomy DataBase. Black circles on the phylogeny show support values (SH-aLRT test ≥ 80% and ultrafast bootstrap ≥ 95%, each threshold corresponding to an estimated confidence level of 95%) and the scale bar denotes the amino acid exchange rate (WAG + R10).
Fig. 2
Fig. 2. Co-existence of nrfA, onr and denitrification genes in the 1218 genome assemblies obtained when screening for nrfA and onr.
The pie charts show the distribution of nrfA, onr and the denitrification genes nirK, nirS, nor and nosZ across (a) nrfA-only, (c) onr-only and (e) nrfA− and onr− assemblies. The corresponding bar plots (b, d, f) indicate the distribution of nrfA, onr and denitrification genes in the classes represented in the phylogeny in Fig. 1. The number of assemblies is indicated above the bar for each class. Classes are ordered according to the proportion of assemblies carrying only nrfA/onr. Reactions performed by the enzymes encoded by the different genes, with each arrow colored according to the corresponding gene, are indicated at the bottom of the figure.
Fig. 3
Fig. 3. Location of metagenomes and abundance and phylogenetic diversity of nrfA across biomes.
a 1861 metagenomes representing 725 sampling sites across the globe. The 35 cropland and 5 rhizosphere metagenomes lacking associated geographic coordinates are not indicated. b Normalized nrfA counts per biome, calculated as the ratio between nrfA counts and the total number of base pairs (Gbp) sequenced in each metagenome (n = 1861 metagenomes; Kruskal–Wallis test, H(11) = 641, P = 2.68 × 10−130). c Abundance-weighed phylogenetic diversity per biome (n = 1861 metagenomes; Kruskal–Wallis test, H(11) = 576, P = 2.32 × 10−116). Significant differences are denoted with different letters, together with the number of metagenomes representing each biome above the boxplots. Boxes are bounded on the first and third quartiles; horizontal lines represent medians. Whiskers denote 1.5× the interquartile range. Data points corresponding to the metagenomes used in the random forest models are shown as filled circles. *The biome name also includes savannas and shrublands.
Fig. 4
Fig. 4. Phylogenetic placement of the metagenomic nrfA sequence fragments across biomes.
Phylogenetic placement of the metagenomic nrfA sequence fragments on the reference tree. The size of the dots is proportional to the number of placements. The scale bar denotes the amino acid exchange rate (WAG + R10). The ONR clade is not shown.
Fig. 5
Fig. 5. Relative importance of NrfA-driven ammonification and denitrification genetic potential across biomes.
The difference in counts of nrfA and nir genes normalized by the number of base pairs sequenced (δnrfA-nir) was calculated per metagenome. Positive and negative values indicate a higher potential for NrfA-driven ammonification over denitrification and vice versa. Significant differences are denoted with different letters, together with the number of metagenomes representing each biome. Boxes are bounded on the first and third quartiles; horizontal lines represent medians. Whiskers denote 1.5× the interquartile range. Data points corresponding to the metagenomes used in the random forest models are shown as filled circles. a Relative importance of NrfA-driven ammonification and denitrification genetic potential across terrestrial biomes and in the rhizosphere (n = 1861 metagenomes; Kruskal–Wallis test, H(11) = 749, P = 1.91 × 10−153). b Relative importance of NrfA-driven ammonification and denitrification genetic potential in the rhizosphere of host species represented by more than 10 metagenomes (n = 263 metagenomes across 11 host species; Kruskal–Wallis test, H(10) = 174, P = 3.69 × 10−32). The red line indicates the median δnrfA-nir value across all rhizosphere metagenomes. *The biome name also includes savannas and shrublands.
Fig. 6
Fig. 6. Environmental predictors of the potential competition between nrfA-ammonifiers and denitrifiers in soil based on random forest models.
The difference in counts of nrfA and nir genes normalized by the number of base pairs sequenced (δnrfA-nir) was calculated per metagenome. The analysis was performed on a subset of the metagenomes for which environmental metadata, especially soil properties relevant for nitrate ammonification and denitrification, was available (n = 227; Table 1). The number of metagenomes corresponding to each biome is indicated after the biome name. Predictor variables selected by VSURF and biome category were used to generate accumulated local effects plots, which show the differences in prediction of the δnrfA-nir (y-axis) compared to the mean prediction along the range of each predictor (x-axis), while accounting for potential correlations amongst predictor values. The effect is centred so that the mean effect is zero. The random forest model was built with 500 trees, 2 features considered at each split and a tree depth set to 9 (variance explained: 55%, root mean square error: 40.6). SOC: soil organic carbon. *The biome name also includes savannas and shrublands.

References

    1. Steffen W, et al. Planetary boundaries: guiding human development on a changing planet. Science. 2015;347:1259855. doi: 10.1126/science.1259855. - DOI - PubMed
    1. Kanter DR, et al. Nitrogen pollution policy beyond the farm. Nat. Food. 2020;1:27–32. doi: 10.1038/s43016-019-0001-5. - DOI
    1. Tian H, et al. A comprehensive quantification of global nitrous oxide sources and sinks. Nature. 2020;586:248–256. doi: 10.1038/s41586-020-2780-0. - DOI - PubMed
    1. Thompson RL, et al. Acceleration of global N2O emissions seen from two decades of atmospheric inversion. Nat. Clim. Change. 2019;9:993–998. doi: 10.1038/s41558-019-0613-7. - DOI
    1. Stremińska MA, Felgate H, Rowley G, Richardson DJ, Baggs EM. Nitrous oxide production in soil isolates of nitrate-ammonifying bacteria. Environ. Microbiol. Rep. 2012;4:66–71. doi: 10.1111/j.1758-2229.2011.00302.x. - DOI - PubMed

Publication types