. 2023 Dec 12;13(1):22030.
doi: 10.1038/s41598-023-48515-5.

Metabolic brain imaging with glucosamine CEST MRI: in vivo characterization and first insights

Affiliations

Metabolic brain imaging with glucosamine CEST MRI: in vivo characterization and first insights

Michal Rivlin et al. Sci Rep. .

Abstract

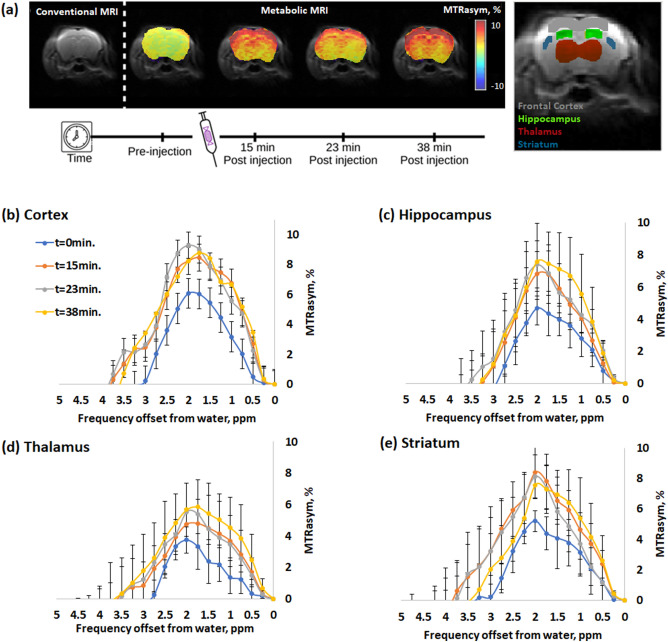
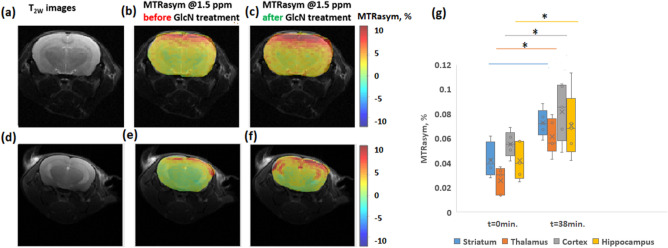
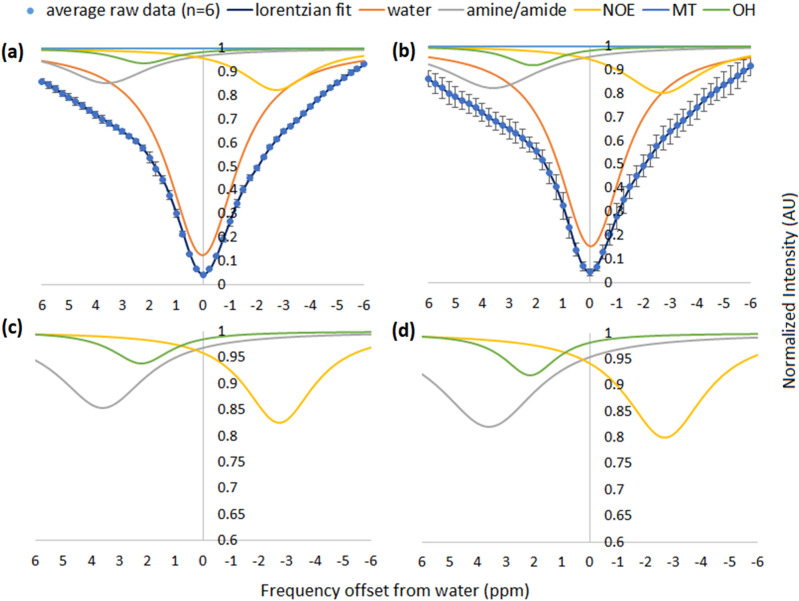
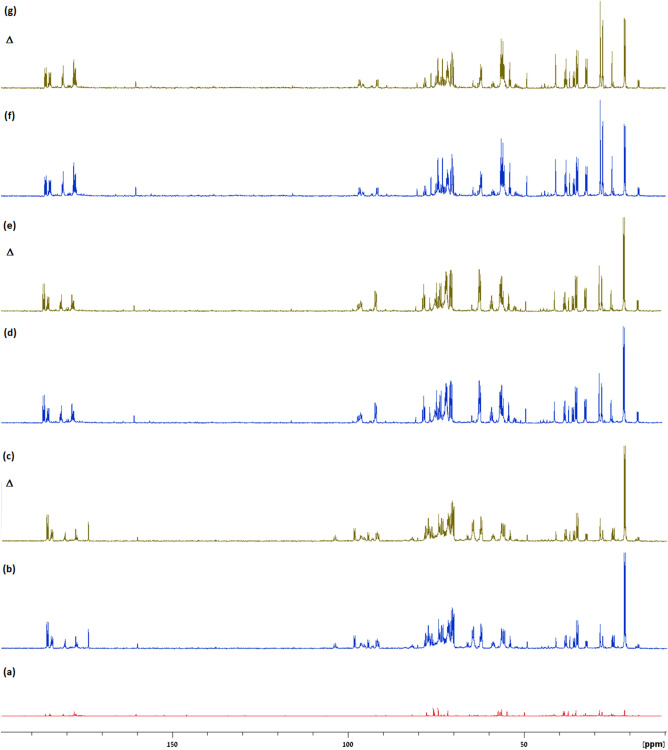
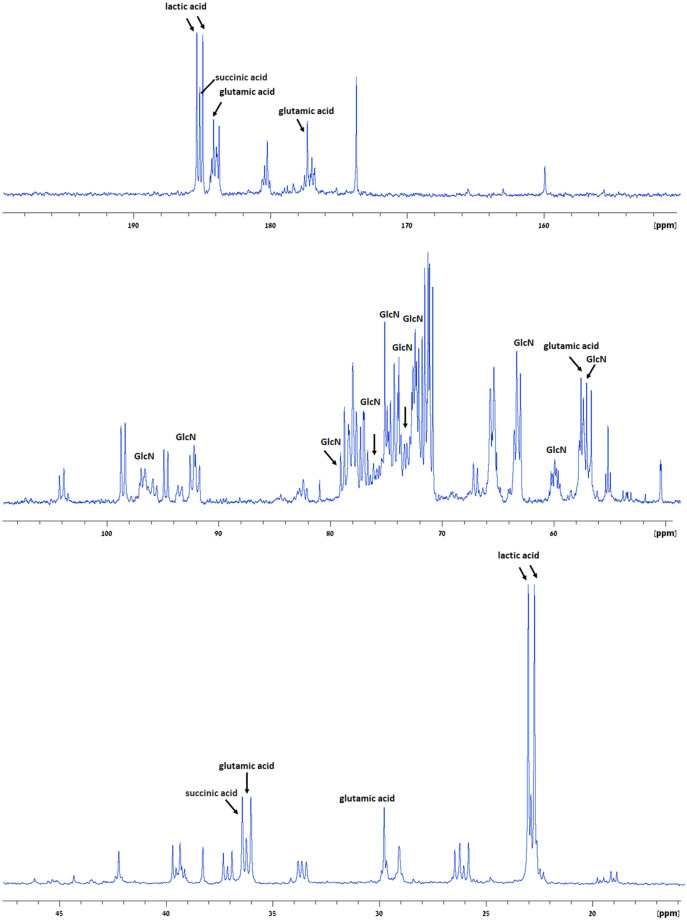
The utility of chemical exchange saturation transfer (CEST) MRI for monitoring the uptake of glucosamine (GlcN), a safe dietary supplement, has been previously demonstrated in detecting breast cancer in both murine and human subjects. Here, we studied and characterized the detectability of GlcN uptake and metabolism in the brain. Following intravenous GlcN administration in mice, CEST brain signals calculated by magnetization transfer ratio asymmetry (MTRasym) analysis, were significantly elevated, mainly in the cortex, hippocampus, and thalamus. The in vivo contrast remained stable during 40 min of examination, which can be attributed to GlcN uptake and its metabolic products accumulation as confirmed using 13C NMR spectroscopic studies of brain extracts. A Lorentzian multi-pool fitting analysis revealed an increase in the hydroxyl, amide, and relayed nuclear Overhauser effect (rNOE) signal components after GlcN treatment. With its ability to cross the blood-brain barrier (BBB), the GlcN CEST technique has the potential to serve as a metabolic biomarker for the diagnosis and monitoring various brain disorders.


Conflict of interest statement

The authors declare no competing interests.

Figures

Figure 1
Figure 1
(a) T2 (SE EPI) image of a representative mouse brain (left), followed by dynamic MTRasym maps (%, at 1.5ppm) before and after GlcN injection (2.5 g/kg, IV) at four time points. The brain with ROIs used is shown on the right. (b) MTRasym dynamic time curves of for the brain’s Cortex, (c) Hippocampus, (d) Thalamus, and (e) Striatum (7T, N=6).
Figure 2
Figure 2
(a,d) T2 anatomical images of two mice brains and their overlay CEST MTRasym maps generated at frequency offset of 1.5 ppm (b,e) before and (c,f) after GlcN treatment (2.5 g/kg, IV). (g) MTRasym plots (%, at 1.5 ppm) in different brain regions. (The circle in the box plot indicates the MTR value, while x is the averaged value). Significant changes between baseline (control) and 38 minutes after administration are indicated with an asterisk for P<0.05. (N = 6).
Figure 3
Figure 3
Z-spectra and multi-pool Lorentzian fitted compound contributions obtained from the cortex of mice (n=6) at 7T (a) before and (b) 15 minutes after the administration of GlcN (2.5 g/kg, IV). (c) and (d) shows the zoomed-in fitted pools separated from that correspond to (a) and (b) respectively (R2 > 0.99; residual errors < 2%).
Figure 4
Figure 4
1H‐decoupled 13C NMR spectra of pooled extracts from brains of mice (a) untreated (n=5), (b) 15 min after treatment with [UL‐13C] ‐GlcN·HCl (2 g/kg IV, n=5), (d) 30 minutes after treatment with [UL‐13C] ‐GlcN·HCl (2 g/kg IV, n=5), (f) 60 min after treatment with [UL‐13C] ‐GlcN·HCl (2 g/kg IV, n=5), and the (c,e,g) corresponding net* signal of GlcN and its metabolites in the brains, respectively (B0=11.7T, T=25°C, pH=7.4). *The green lines represent the difference between the treatment and the baseline.
Figure 5
Figure 5
1H-decoupled 13C NMR spectra of pooled brains extract 15 minutes after [UL-13C] -GlcN·HCl treatment (2 g/kg IV, n = 5) with the assignments of GlcN and main organic acids peaks.

References

    1. Mergenthaler P, Lindauer U, Dienel GA, Meisel A. Sugar for the brain: The role of glucose in physiological and pathological brain function. Trends Neurosci. 2013;36(10):587–97. doi: 10.1016/j.tins.2013.07.001. - DOI - PMC - PubMed
    1. Das K, Mittal BR, Vasistha RK, Singh P, Mathuriya SN. Role of (18)F-fluorodeoxyglucose Positron Emission Tomography scan in differentiating enhancing brain tumors. Indian J. Nucl. Med. 2011;26(4):171–176. doi: 10.4103/0972-3919.106698. - DOI - PMC - PubMed
    1. Yee E, Popuri K, Beg MF, Beg Faisal M. Quantifying brain metabolism from FDG-PET images into a probability of Alzheimer's dementia score. Hum. Brain Mapping. 2020;41:5–16. doi: 10.1002/hbm.24783. - DOI - PMC - PubMed
    1. Walker-Samuel S, et al. In vivo imaging of glucose uptake and metabolism in tumors. Nat. Med. 2013;19:1067–1072. doi: 10.1038/nm.3252. - DOI - PMC - PubMed
    1. Xu X, et al. d-glucose weighted chemical exchange saturation transfer (glucoCEST)-based dynamic glucose enhanced (DGE) MRI at 3T: Early experience in healthy volunteers and brain tumor patients. Magn. Reson. Med. 2020;84:247–261. doi: 10.1002/mrm.28124. - DOI - PMC - PubMed