. 2023 Dec 12;14(1):8235.
doi: 10.1038/s41467-023-43812-z.

Large scale purification in semiconductors using Rydberg excitons

Affiliations

Large scale purification in semiconductors using Rydberg excitons

Martin Bergen et al. Nat Commun. .

Abstract

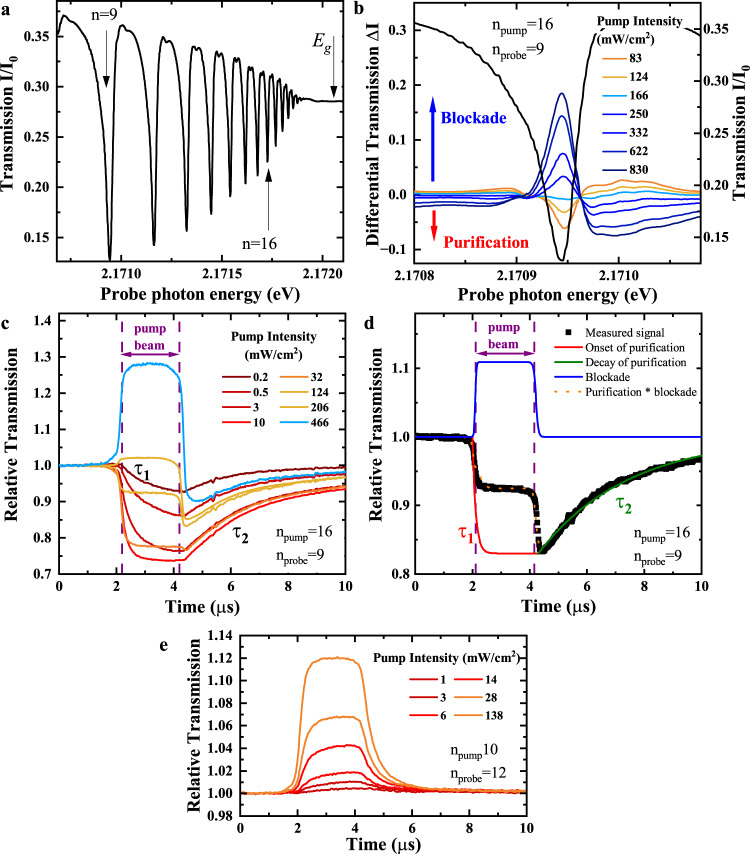
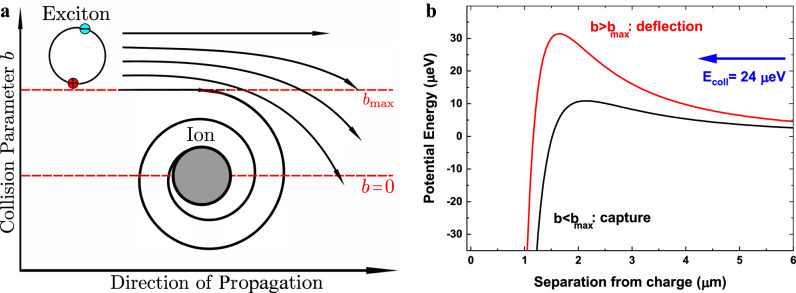
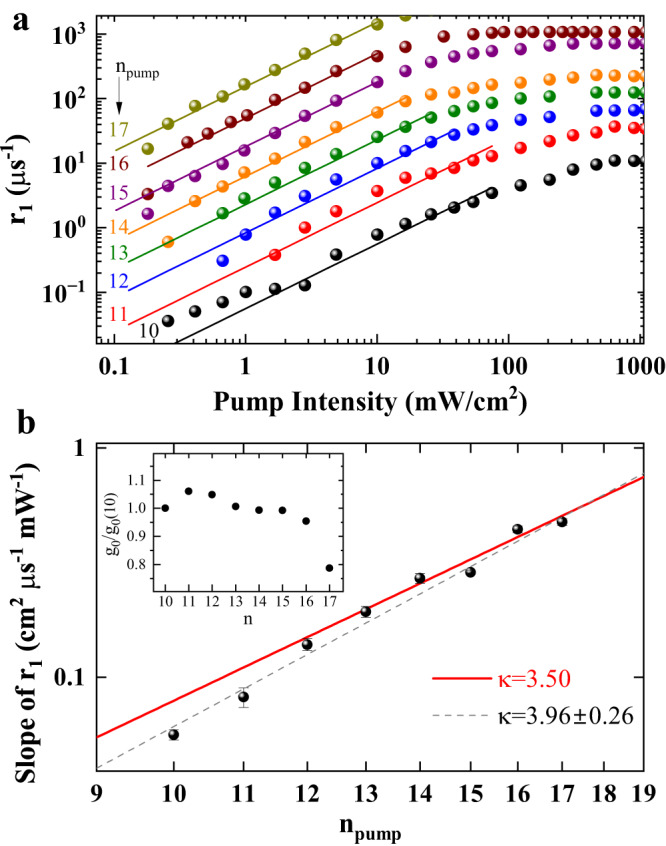
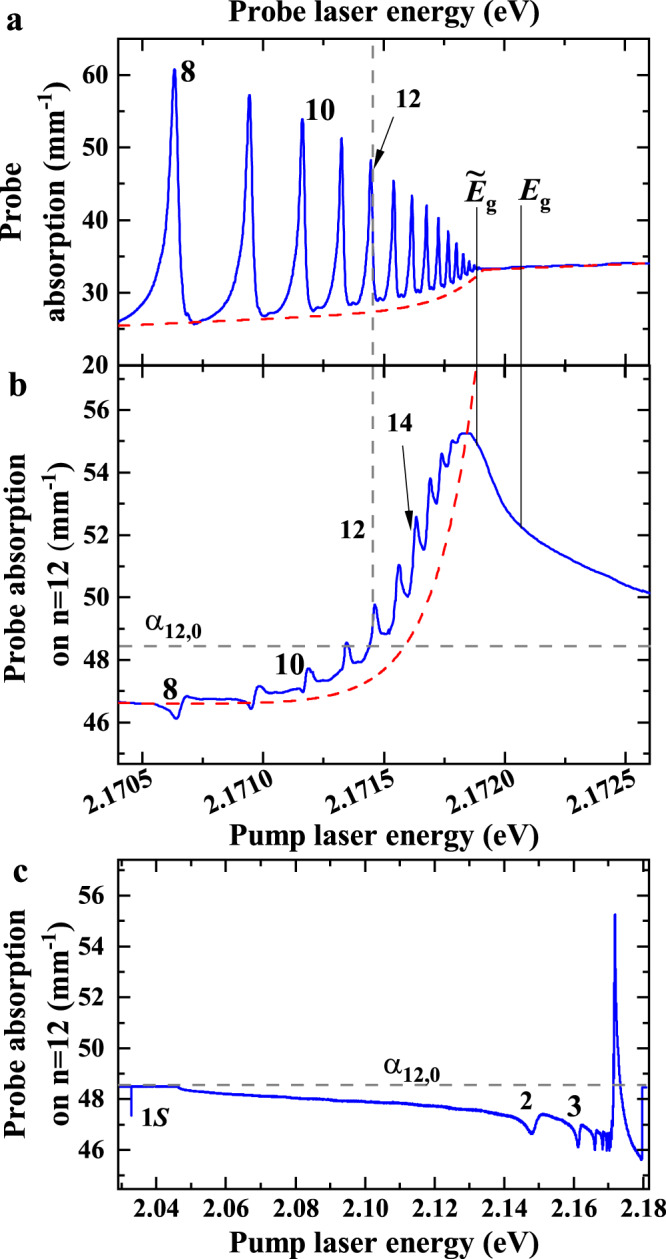
Improving the quantum coherence of solid-state systems is a decisive factor in realizing solid-state quantum technologies. The key to optimize quantum coherence lies in reducing the detrimental influence of noise sources such as spin noise and charge noise. Here we demonstrate that we can utilize highly-excited Rydberg excitons to neutralize charged impurities in the semiconductor Cuprous Oxide - an effect we call purification. Purification reduces detrimental electrical stray fields drastically. We observe that the absorption of the purified crystal increases by up to 25% and that the purification effect is long-lived and may persist for hundreds of microseconds or even longer. We investigate the interaction between Rydberg excitons and impurities and find that it is long-ranged and based on charge-induced dipole interactions. Using a time-resolved pump-probe technique, we can discriminate purification from Rydberg blockade, which has been a long-standing goal in excitonic Rydberg systems.


Conflict of interest statement

The authors declare no competing interests.

Figures

Fig. 1
Fig. 1. Time-resolved pump-probe spectroscopy.
a Normalized probe laser transmission spectrum of Rydberg excitons from n = 9 up to the band gap at 1.3 K. b Left axis: Differential transmission ΔI = I0 − I(pump) in a cw pump-probe experiment with npump = 16 and nprobe = 9. For low pump intensities the transmission is reduced (purification). For large pump intensities the transmission is enhanced (blockade). Right axis: Norm. transmission around the nprobe = 9 resonance for comparison. c Pump-intensity series of time resolved relative transmission in a pulsed pump-probe experiment for constant probe power. Purification and blockade may occur simultaneously, but are clearly distinguishable. τ1 decreases with pump power. The purple dashed lines indicate the duration of the pump pulse. d Breakdown of a typical relative transmission time trace for a pump intensity of 124 mWcm2. Upon the arrival of the pump beam indicated by the dashed purple lines, blockade sets in immediately and vanishes immediately at the end of the pump beam. Purification slowly builds up during a time τ1 and decays on an even slower time τ2. Considering blockade and purification simultaneously reproduces the step-like structure of the measured relative transmission. e Same as b but for npump < nprobe, where only positive amplitudes are observed.
Fig. 2
Fig. 2. Exciton capture process.
a Schematic depiction of the exciton capture process by a charged impurity. The collision parameter b is given by the distance between the initial trajectory of the exciton and a parallel trajectory passing through the center of the charged impurity. The collision parameter bmax divides trajectories that result in capture of the exciton and trajectories that result only in deflection of the exciton. b Shape of the total potential composed of the attractive second-order Stark shift and the repulsive centrifugal barrier term for two different collision parameters b. The collision energy of 24 μeV corresponds to the kinetic energy of the exciton which is determined by the recoil momentum of the photons. An exciton passing the impurity with large b results in a large angular momentum l which in turn increases the centrifugal barrier. The maximum value of the potential is larger than the collision energy, so the exciton becomes deflected. For small b, l is lower as well and the centrifugal barrier is reduced significantly. Here, the maximum value of the potential is below the collision energy an the exciton gets captured.
Fig. 3
Fig. 3. Scaling of decay rate r2.
a Time traces of the relative transmission for npump = 16 and nprobe = 9. With increasing probe powers the decay of purification becomes significantly faster. b Purification decay rate r2 against probe beam intensity for npump = 16 and nprobe = 10. At low probe intensities, a linear trend arises which saturates at higher intensities. The solid line denotes a linear fit to the low-intensity region. c Probe-power series of r2 for pumping at npump = 16 and varying nprobe from 5 to 15. The pump intensity is adjusted such that the highest possible purification is reached for each nprobe. Solid lines are linear fits to the linear regions. The data points and lines are offset vertically and plotted on a double-logarithmic scale for clarity. A small offset of r2 ≈ 0.025 μs−1 is subtracted from all curves. d Power law fit to the slopes of the purification rate r2. The error bars are obtained by varying the range of fitted data points in panel (c) by ± 1. For nprobe > 6, the scaling is close to n6.5.
Fig. 4
Fig. 4. Scaling of growth rate r1.
a Pump-power series of r1 in time-resolved relative transmission in a pulsed pump-probe experiment for probing at nprobe = 9 and varying npump from 10 to 17. The probe intensity amounts to 7.5 mW cm−2. Solid lines are linear fits to the linear regions. The data points and the lines are offset vertically and plotted on a double-logarithmic scale for clarity. All curves are corrected by a constant offset of 1.05 μs−1. b The red lines shows a scaling with n3.5 according to the model. For large n above 12, the data fits to this prediction well. For lower n the scaling becomes steeper. A fit to the whole range of principal quantum numbers yields n3.96±0.26. The error bars are obtained by varying the range of fitted data points in panel a by ± 1. The inset shows g0 estimated from the linear absorption spectrum. The variation of g0 is below 10% between n = 10 and 16.
Fig. 5
Fig. 5. Spectral dependence of the purification effect.
a The linear absorption spectrum from Fig. 1a in the energy range from n = 8 to the band gap, shown as a reference. The red dashed line indicates the background that is dominated by an exponential tail below the apparent band gap E~g. b Probe laser absorption coefficient as a function of pump laser energy. The probe laser energy is fixed to the peak of the nprobe = 12 exciton resonance, while the pump laser energy is scanned. The pump laser enhances the absorption of nprobe = 12 if its energy is set within a spectral range around the apparent band gap E~g. The grey dashed vertical line marks the resonance energy of n = 12, the grey dashed horizontal line marks the absorption coefficient of n = 12 without the presence of a pump laser α12,0. Panel (c) shows an extended energy range of panel (b).
Fig. 6
Fig. 6. Alternative fit routine for r1.
a Alternative fit routine using a sigmoid curve over the complete measured intensity range. This approach includes all phenomena, purification as well as Rydberg blockade. b Alternative slope values with corresponding numerical errors from the fits in panel (a). The results remain well within the theoretical expectation with slightly steeper progression towards lower npump.
Fig. 7
Fig. 7. Alternative fit routine for r2.
a Alternative fit routine using a sigmoid curve over the complete measured intensity range. Due to the fact that only the decay of the purification process is considered it is safe to assume that no or very little Rydberg blockade is included over the complete intensity range. The changes in the rates, however, are very small towards lower nprobe, which results in a large uncertainty for rA. b Alternative slope values with corresponding numerical errors from the fits in panel (a). There results are again very well within the expected range and also in agreement with the linear regression method.

References

    1. Kuhlmann AV, et al. Charge noise and spin noise in a semiconductor quantum device. Nat. Phys. 2013;9:570–575. doi: 10.1038/nphys2688. - DOI
    1. Hu X, Das Sarma S. Charge-fluctuation-induced dephasing of exchange-coupled spin qubits. Phys. Rev. Lett. 2006;96:100501. doi: 10.1103/PhysRevLett.96.100501. - DOI - PubMed
    1. Culcer D, Hu X, Das Sarma S. Dephasing of Si spin qubits due to charge noise. Appl. Phys. Lett. 2009;95:073102. doi: 10.1063/1.3194778. - DOI
    1. Basset J, et al. Evaluating charge noise acting on semiconductor quantum dots in the circuit quantum electrodynamics architecture. Appl. Phys. Lett. 2014;105:063105. doi: 10.1063/1.4892828. - DOI
    1. Nguyen NTT, Das Sarma S. Impurity effects on semiconductor quantum bits in coupled quantum dots. Phys. Rev. B. 2011;83:235322. doi: 10.1103/PhysRevB.83.235322. - DOI