. 2023 Dec 12;9(1):450.
doi: 10.1038/s41420-023-01752-z.

Cepharanthine, a regulator of keap1-Nrf2, inhibits gastric cancer growth through oxidative stress and energy metabolism pathway

Affiliations

Cepharanthine, a regulator of keap1-Nrf2, inhibits gastric cancer growth through oxidative stress and energy metabolism pathway

Yang-Yang Lu et al. Cell Death Discov. .

Abstract

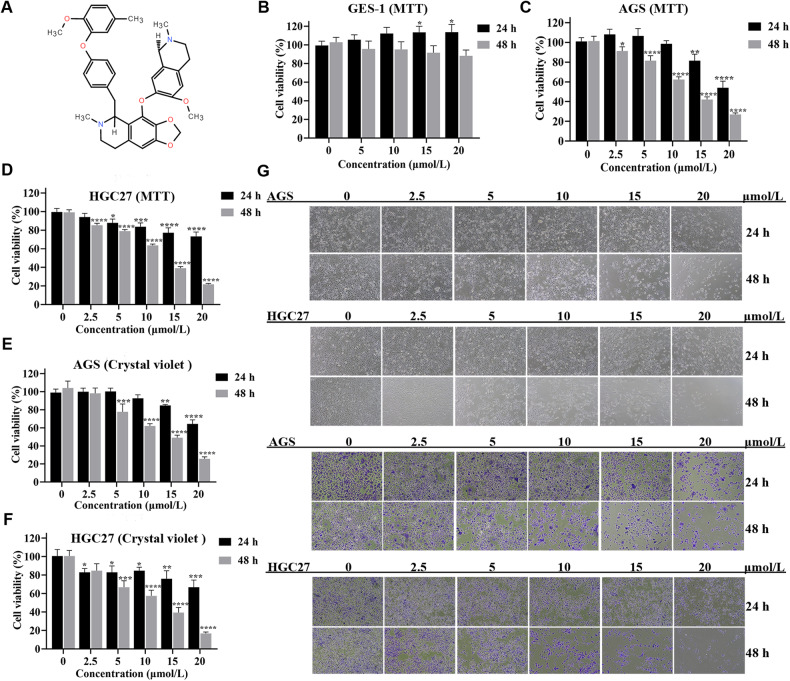
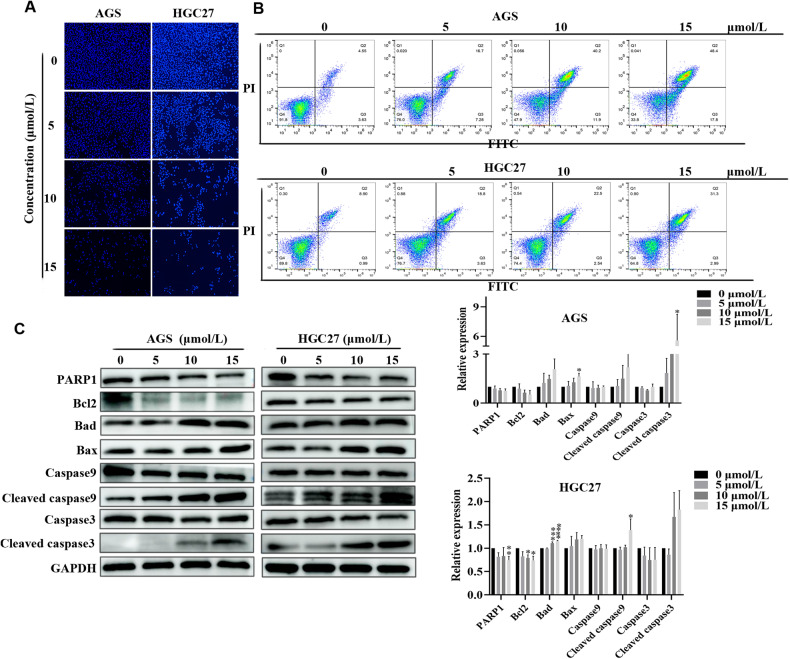
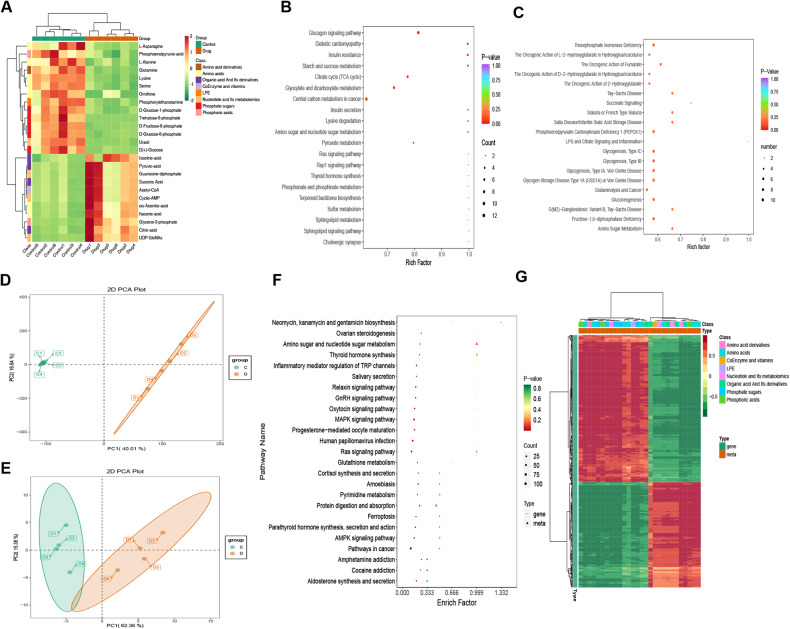
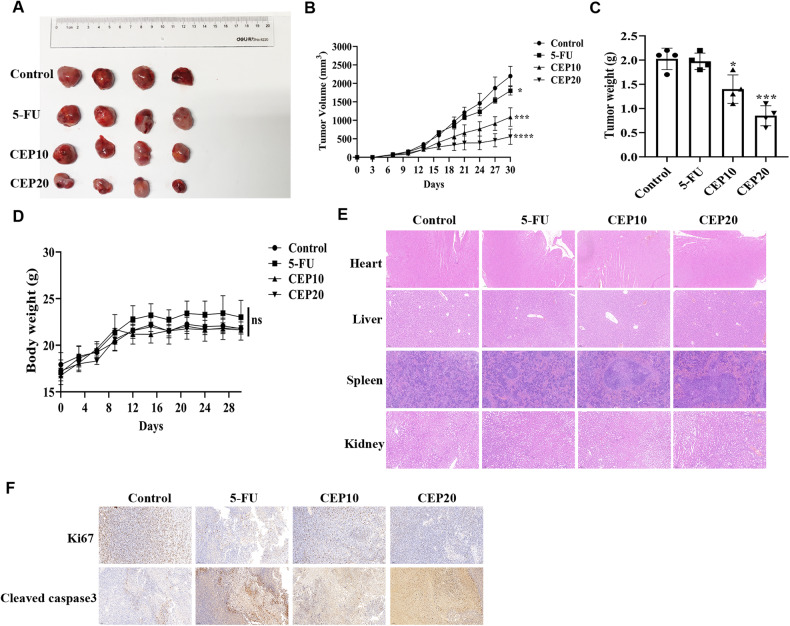
Cepharanthine (CEP), a bioactive compound derived from Stephania Cephalantha Hayata, is cytotoxic to various malignancies. However, the underlying mechanism of gastric cancer is unknown. CEP inhibited the cellular activity of gastric cancer AGS, HGC27 and MFC cell lines in this study. CEP-induced apoptosis reduced Bcl-2 expression and increased cleaved caspase 3, cleaved caspase 9, Bax, and Bad expression. CEP caused a G2 cell cycle arrest and reduced cyclin D1 and cyclin-dependent kinases 2 (CDK2) expression. Meanwhile, it increased oxidative stress, decreased mitochondrial membrane potential, and enhanced reactive oxygen species (ROS) accumulation in gastric cancer cell lines. Mechanistically, CEP inhibited Kelch-like ECH-associated protein (Keap1) expression while activating NF-E2 related factor 2 (Nrf2) nuclear translocations, increasing transcription of Nrf2 target genes quinone oxidoreductase 1 (NQO1), heme oxygenase 1 (HMOX1), and glutamate-cysteine ligase modifier subunit (GCLM). Furthermore, a combined analysis of targeted energy metabolism and RNA sequencing revealed that CEP could alter the levels of metabolic substances such as D (+) - Glucose, D-Fructose 6-phosphate, citric acid, succinic acid, and pyruvic acid, thereby altering energy metabolism in AGS cells. In addition, CEP significantly inhibited tumor growth in MFC BALB/c nude mice in vivo, consistent with the in vitro findings. Overall, CEP can induce oxidative stress by regulating Nrf2/Keap1 and alter energy metabolism, resulting in anti-gastric cancer effects. Our findings suggest a potential application of CEP in gastric cancer treatment.


Conflict of interest statement

The authors declare no competing interests.

Figures

Fig. 1
Fig. 1. CEP is toxic to gastric cancer cells.
A The structure of CEP. B Human gastric mucosal cell line GES-1 was treated with different concentrations of CEP for 24 or 48 h. The cell viability was detected by MTT assay (n = 4). C, D Human gastric cancer cell lines AGS and HGC27 were treated with the indicated concentration of CEP for 24 or 48 h. MTT assay (n = 4) was used to determine cell viability. E, F AGS and HGC27 cell lines were treated with the indicated concentration of CEP for 24 or 48 h. The cell viability was detected by crystal violet assay (n = 3). G AGS and HGC27 cell lines were treated with CEP for 24 or 48 h. Morphology was observed by live cell photography and crystal violet staining—scale bar: 100 μm. Data were expressed as mean ± SD, *p < 0.05, **p < 0.01, ***p < 0.001, and ****p < 0.0001, with significant differences from the control group.
Fig. 2
Fig. 2. CEP suppresses gastric cancer cell growth and migration.
A Cloning of AGS and HGC27 cells treated with CEP (5, 10, and 15 μmol/L). Quantify the clonal formation of AGS and HGC27 cells by measuring the absorbance of the solution obtained by dissolving crystal violet in glacial acetic acid (n = 3). B A scratch assay was performed to determine the migration of AGS and HGC27 cells treated with CEP (5, 10, and 15 μmol/L) for 48 h. Quantification of scratch images by calculating the area of cell migration (n = 3). C The cell cycle of AGS and HGC27 cells treated with CEP (5, 10, and 15 μmol/L) for 48 h was analyzed by flow cytometry. The percentage of AGS and HGC27 cells in different phases (n = 3). D After CEP treatment, a western blot was used to detect cyclinD1 and CDK2 levels in AGS and HGC27 cells. Protein levels were standardized using GAPDH levels, and data were expressed as mean ± SD, *p < 0.05, **p < 0.01, ***p < 0.001, and ****p < 0.0001, significantly different from the control group.
Fig. 3
Fig. 3. CEP induces apoptosis in gastric cancer cells.
A Cell apoptosis detected by Hoechst 33342 staining. AGS and HGC27 cells were exposed to CEP (5, 10, and 15 μmol/L) for 48 h, and fluorescence images were taken. Scale bar: 100 µm. B Flow cytometry assessed cell apoptosis in AGS and HGC27 cells treated with CEP (5, 10, 15 μmol/L) for 48 h. C Western blot was used to determine the levels of apoptosis-related proteins in AGS and HGC27 cells after CEP treatment. CEP treatment significantly increased the ratios of Cleaved caspase-3/capase-3, Cleaved caspase-9/caspase-9, significantly increased Bax, Bad protein levels, and significantly downregulated Bcl-2 and PARP1 (n = 3). The protein levels were standardized using GAPDH levels, and the data were expressed as means ± SD; *p < 0.05, **p < 0.01, ***p < 0.001, and ****p < 0.0001, significantly different from the control group.
Fig. 4
Fig. 4. RNA sequencing results of AGS cells treated with CEP.
A AGS cells were treated with 15 μmol/L CEP for 48 h. The RNA sequencing volcanic map revealed significant differentially expressed genes. The screening criteria for differential genes are |log2 Fold change| ≥ 1 and q < 0.05. Up for 1523; down for 2162. B The RNA sequencing heat map indicated significant differentially expressed genes. Red indicates high gene expression, while blue indicates low gene expression. The abscissa represents the sample clustering, and the ordinate represents the gene clustering. C GO annotation analysis of AGS cells treated with CEP compared to the control group. D KEGG pathway enrichment analysis of AGS cells treated with CEP revealed that different colors represented different enrichment levels, with the redder color representing more significant enrichment.
Fig. 5
Fig. 5. CEP increases oxidative stress levels in gastric cancer cells.
A AGS and HGC27 were treated with CEP (5, 10, and 15 μmol/L) for 48 h. The lactate dehydrogenase (LDH) release from the cells was measured (n = 3). B The mitochondrial membrane potential was measured with JC-1 dye. AGS and HGC27 cells were treated with CEP for 48 h—scale bar: 100 μm. C Intracellular ROS was detected by DCFH-DA staining (green) and DHE staining (red). AGS and HGC27 cells were treated with CEP (5, 10, and 15 μmol/L) for 48 h, and fluorescence images were captured (n = 3). Scale bar: 100 μm. The data were expressed as means ± SD; *p < 0.05, **p < 0.01, ***p < 0.001, and ****p < 0.0001, significantly different from the control group.
Fig. 6
Fig. 6. Keap1/Nrf2 is engaged in the CEP-induced cell death mechanism in gastric cancer.
A Molecular docking of CEP with Keap1. B RNA sequencing revealed that the Nrf2 target genes NQO1, GCLM, and HMOX1 were upregulated after 48 h of CEP treatment of AGS cells, while the SOD2 gene was downregulated. Red indicates high gene expression, while blue indicates low gene expression. C AGS/HGC27 cells were treated with 5, 10, and 15 μmol/L CEP for 48 h. The protein expression of SOD2, Nrf2, Keap1, GCLM, and NQO1 was measured by western blot (n = 3). D AGS/HGC27 cells were treated with 10 μmol/L CEP for 48 h. Measurement of Nrf2 protein nuclear translocation by laser confocal microscopy. Scale bar: 50 μm. The data were expressed as means ± SD; *p < 0.05, **p < 0.01, ***p < 0.001, and ****p < 0.0001, significantly different from the control group.
Fig. 7
Fig. 7. CEP can activate Nrf2 for nuclear translocation.
A AGS/HGC27 cells were treated with 5, 10, and 15 μmol/L CEP for 48 h. The protein expression of HMOX1 was measured by western blot (n = 3). B AGS/HGC27 cells were treated with 5, 10, and 15 μmol/L CEP for 48 h. The protein expression of cyto-Nrf2 and nucl-Nrf2 was measured by western blot (n = 3). C The protein expression of Nrf2 in AGS/HGC27 cells silenced by siRNA (siRNA1, siRNA2, and siRNA3) was measured by western blot. D AGS/HGC27 cells were treated with 10 μmol/L CEP or siRNA3 for 48 h. The protein expression of Nrf2 and HMOX1 in AGS/HGC27 cells was measured by western blot. The data were expressed as means ± SD; *p < 0.05, **p < 0.01, ***p < 0.001, and ****p < 0.0001, significantly different from the control group. #p < 0.05, ##p < 0.01, ###p < 0.001, and ####p < 0.0001, significantly different from the Negative-control-CEP group.
Fig. 8
Fig. 8. CEP can alter the energy metabolism level of AGS cells.
A The three-dimensional principal component analysis of the untreated and drug groups (15 μmol/L CEP) can effectively observe the sample variability in each group. B Use OPLS-DA score maps to evaluate the effectiveness of model construction for the untreated and drug groups. C A volcano map depicting the differential metabolites between the untreated and drug groups. Each point in the graph represents a metabolite, with the red point representing a significantly upregulated, the green point representing a significantly downregulated, and the gray point representing a level of insignificantly changed metabolites. D A bar chart of differential metabolites between the untreated and drug groups. Red represents significantly upregulated, while green represents significantly downregulated metabolites. E A violin chart indicating differences between the untreated and drug groups. Display the data distribution and probability density. The black horizontal line in the center represents the median, while the outer shape represents the data distribution density. F Correlation analysis of differential metabolites in the untreated and drug groups. Red represents a strong positive correlation, while green represents a strong negative correlation.
Fig. 9
Fig. 9. Combined analysis of RNA sequencing and energy metabolism in AGS cells treated with CEP.
A Cluster heat map of differential metabolites between the untreated and drug groups (15 μmol/L). Red represents high content, while green represents low content. B KEGG enrichment analysis of differential metabolites between the untreated and drug groups. Red represents a high degree of enrichment. C HMDB enrichment map of differential metabolites between the untreated and drug groups. Red represents a high level of enrichment. D Transcriptional component analysis in the untreated and drug groups. E Metabolic component analysis in the untreated and drug groups. F The transcriptome and metabolome of the untreated and drug groups were compared, and KEGG was used to enrich the analysis. Red represents a high degree of enrichment. G Cluster analysis heat map of differential genes and metabolites between the untreated and drug groups. Red represents a positive correlation between genes and metabolites, while green represents a negative correlation between genes and metabolites.
Fig. 10
Fig. 10. The anti-tumor efficacy of CEP was tested in vivo.
A Images of subcutaneous tumors in MFC BALB/c nude mice, as well as tumor volume (B) and tumor weight (C) (n = 4). D The changes in body weight of MFC BALB/c nude mice treated with different drugs (n = 4). E Pathological changes (HE staining) of important organs, including the heart, liver, spleen, and kidneys in MFC BALB/c nude mice treated with different groups (n = 4). Scale: 100 μm. F Expression of Ki67 and cleaved caspase3 in tumor tissues of different groups (n = 3) of MFC BALB/c nude mice (immunohistochemistry). Scale: 100 μm. Data were expressed as mean ± SD, *p < 0.05, **p < 0.01, ***p < 0.001, and ****p < 0.0001, with significant differences from the control group.

References

    1. Smyth EC, Nilsson M, Grabsch HI, van Grieken NC, Lordick F. Gastric cancer. Lancet. 2020;396:635–48. doi: 10.1016/S0140-6736(20)31288-5. - DOI - PubMed
    1. Hironaka S. Anti-angiogenic therapies for gastric cancer. Asia Pac J Clin Oncol. 2019;15:208–17. doi: 10.1111/ajco.13174. - DOI - PubMed
    1. Zheng S, Zhang Z, Ding N, Sun J, Lin Y, Chen J, et al. Identification of the angiogenesis related genes for predicting prognosis of patients with gastric cancer. BMC Gastroenterol. 2021;21:146. doi: 10.1186/s12876-021-01734-4. - DOI - PMC - PubMed
    1. Forman HJ, Zhang H. Targeting oxidative stress in disease: promise and limitations of antioxidant therapy. Nat Rev Drug Discov. 2021;20:689–709. doi: 10.1038/s41573-021-00233-1. - DOI - PMC - PubMed
    1. Rhee SG, Bae SH. The antioxidant function of sestrins is mediated by promotion of autophagic degradation of Keap1 and Nrf2 activation and by inhibition of mTORC1. Free Radic Biol Med. 2015;88:205–11. doi: 10.1016/j.freeradbiomed.2015.06.007. - DOI - PubMed