

Temperature-related death burden of various neurodegenerative diseases under climate warming: a nationwide modelling study
- PMID: 38086884
- PMCID: PMC10716387
- DOI: 10.1038/s41467-023-44066-5
Temperature-related death burden of various neurodegenerative diseases under climate warming: a nationwide modelling study
Abstract
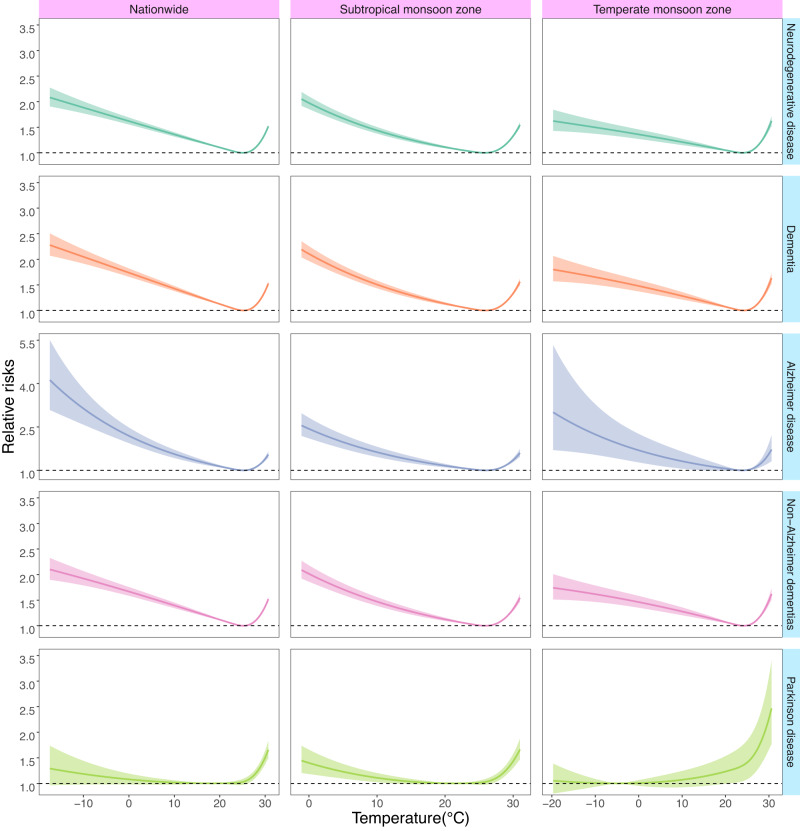
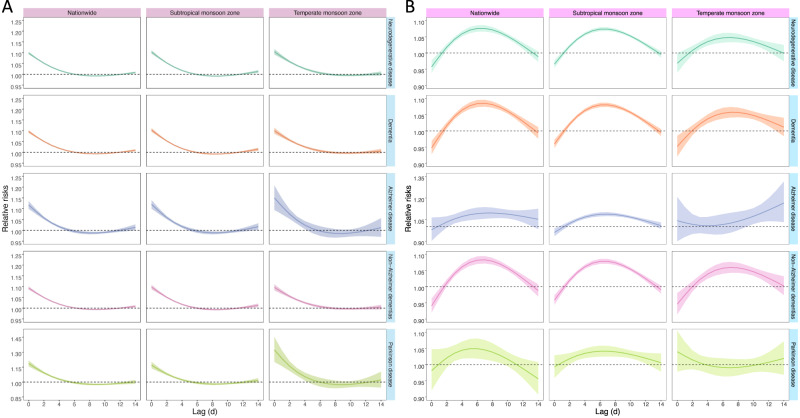
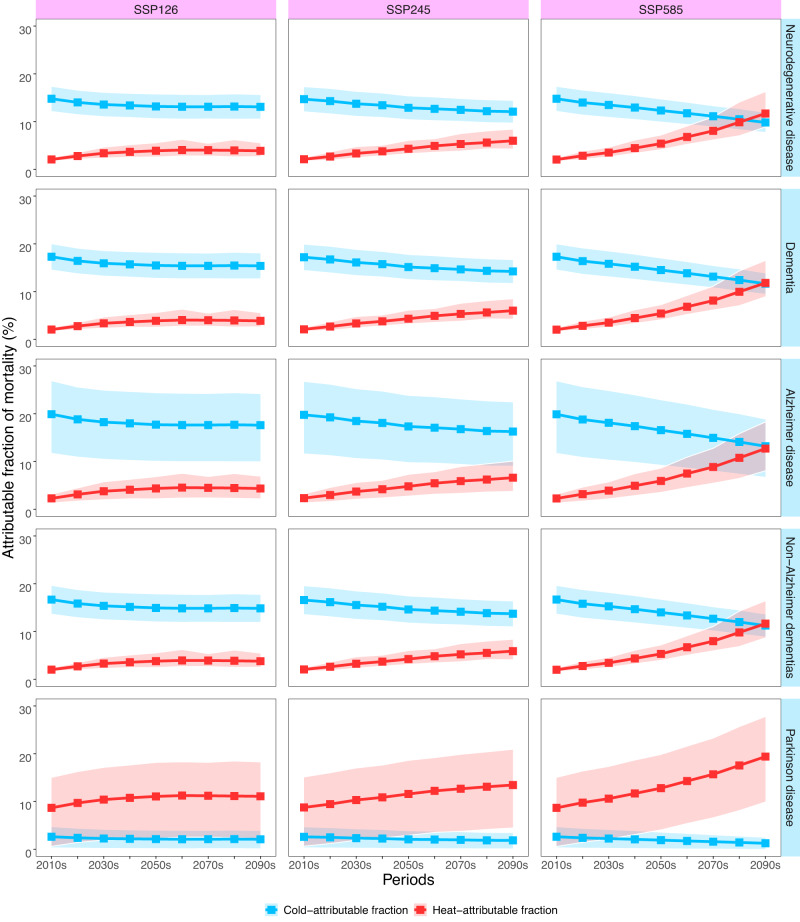
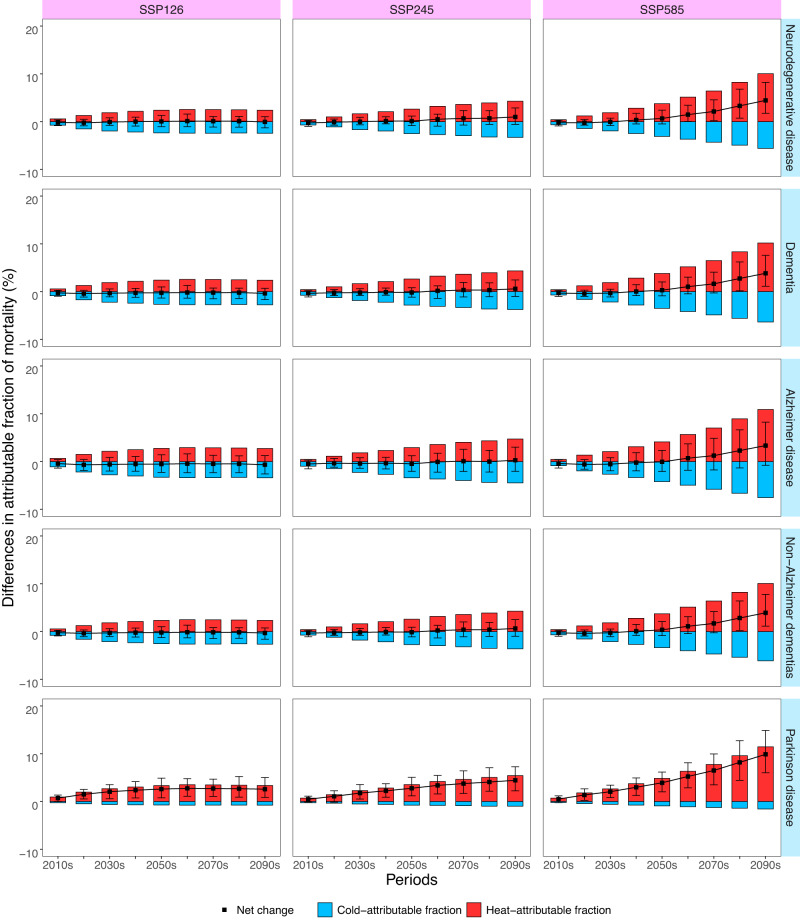
Limited knowledge exists regarding the ramifications of climate warming on death burden from neurodegenerative diseases. Here, we conducted a nationwide, individual-level, case-crossover study between 2013 and 2019 to investigate the effects of non-optimal temperatures on various neurodegenerative diseases and to predict the potential death burden under different climate change scenarios. Our findings reveal that both low and high temperatures are linked to increased risks of neurodegenerative diseases death. We project that heat-related neurodegenerative disease deaths would increase, while cold-related deaths would decrease. This is characterized by a steeper slope in the high-emission scenario, but a less pronounced trend in the scenarios involving mitigation strategies. Furthermore, we predict that the net changes in attributable death would increase after the mid-21st century, especially under the unrestricted-emission scenario. These results highlight the urgent need for effective climate and public health policies to address the growing challenges of neurodegenerative diseases associated with global warming.
© 2023. The Author(s).
Conflict of interest statement
The authors declare no competing interests.
Figures
Similar articles
-
Assessing the Burden of Suicide Death Associated With Nonoptimum Temperature in a Changing Climate.JAMA Psychiatry. 2023 May 1;80(5):488-497. doi: 10.1001/jamapsychiatry.2023.0301. JAMA Psychiatry. 2023. PMID: 36988931 Free PMC article.
-
Future ozone-related acute excess mortality under climate and population change scenarios in China: A modeling study.PLoS Med. 2018 Jul 3;15(7):e1002598. doi: 10.1371/journal.pmed.1002598. eCollection 2018 Jul. PLoS Med. 2018. PMID: 29969446 Free PMC article.
-
Cause-specific accidental deaths and burdens related to ambient heat in a warming climate: A nationwide study of China.Environ Int. 2023 Oct;180:108231. doi: 10.1016/j.envint.2023.108231. Epub 2023 Sep 25. Environ Int. 2023. PMID: 37778287
-
Impacts of exposure to ambient temperature on burden of disease: a systematic review of epidemiological evidence.Int J Biometeorol. 2019 Aug;63(8):1099-1115. doi: 10.1007/s00484-019-01716-y. Epub 2019 Apr 22. Int J Biometeorol. 2019. PMID: 31011886
-
Climate change and neurodegenerative diseases.Environ Res. 2021 Oct;201:111511. doi: 10.1016/j.envres.2021.111511. Epub 2021 Jun 12. Environ Res. 2021. PMID: 34126048 Review.
Cited by
-
Spatiotemporal distribution and lag effect of extreme temperature exposure on mortality of residents in Jiangsu, China.Heliyon. 2024 Apr 30;10(9):e30538. doi: 10.1016/j.heliyon.2024.e30538. eCollection 2024 May 15. Heliyon. 2024. PMID: 38765142 Free PMC article.
-
Effects of ambient temperature on mental and neurological conditions in older adults: A systematic review and meta-analysis.Environ Int. 2024 Dec;194:109166. doi: 10.1016/j.envint.2024.109166. Epub 2024 Nov 23. Environ Int. 2024. PMID: 39603080 Free PMC article.
-
The Role of the Neural Exposome as a Novel Strategy to Identify and Mitigate Health Inequities in Alzheimer's Disease and Related Dementias.Mol Neurobiol. 2025 Jan;62(1):1205-1224. doi: 10.1007/s12035-024-04339-6. Epub 2024 Jul 5. Mol Neurobiol. 2025. PMID: 38967905 Free PMC article. Review.
-
Effect of heatwaves on mortality of Alzheimer's disease and other dementias among elderly aged 60 years and above in China, 2013-2020: a population-based study.Lancet Reg Health West Pac. 2024 Oct 8;52:101217. doi: 10.1016/j.lanwpc.2024.101217. eCollection 2024 Nov. Lancet Reg Health West Pac. 2024. PMID: 39430125 Free PMC article.
-
Causal associations and shared genetic etiology between neurodegenerative diseases and constipation.J Alzheimers Dis Rep. 2025 Jul 23;9:25424823251362469. doi: 10.1177/25424823251362469. eCollection 2025 Jan-Dec. J Alzheimers Dis Rep. 2025. PMID: 40727259 Free PMC article.
References
Publication types
MeSH terms
Grants and funding
LinkOut - more resources
Full Text Sources
Medical
