. 2023 Dec 12;13(1):22046.
doi: 10.1038/s41598-023-49563-7.

AI-based diagnosis of nuclear cataract from slit-lamp videos

Affiliations

AI-based diagnosis of nuclear cataract from slit-lamp videos

Eisuke Shimizu et al. Sci Rep. .

Abstract

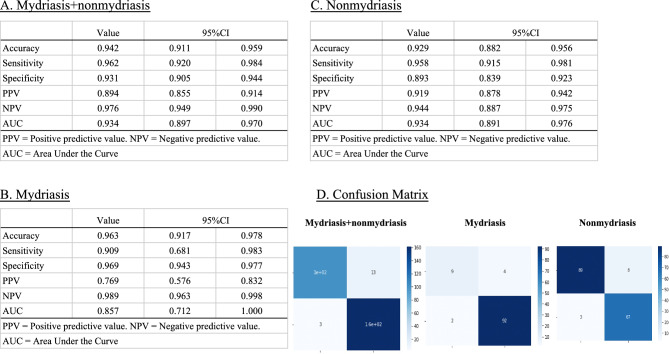
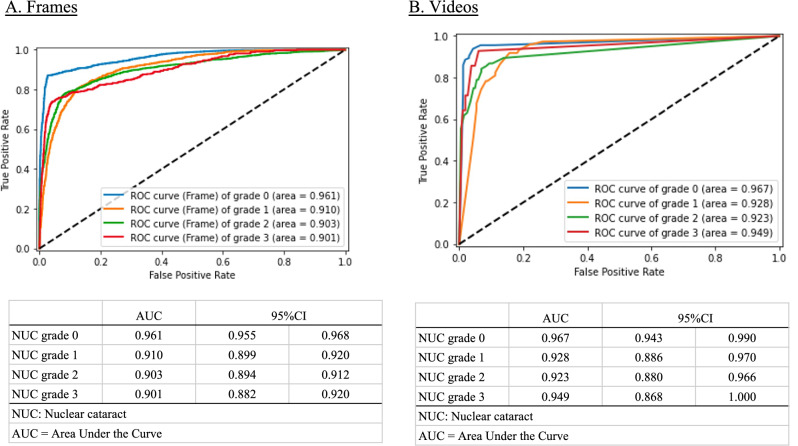
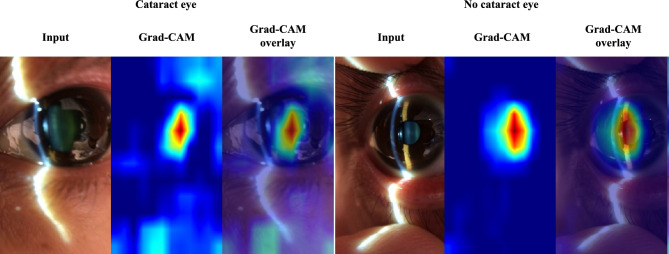
In ophthalmology, the availability of many fundus photographs and optical coherence tomography images has spurred consideration of using artificial intelligence (AI) for diagnosing retinal and optic nerve disorders. However, AI application for diagnosing anterior segment eye conditions remains unfeasible due to limited standardized images and analysis models. We addressed this limitation by augmenting the quantity of standardized optical images using a video-recordable slit-lamp device. We then investigated whether our proposed machine learning (ML) AI algorithm could accurately diagnose cataracts from videos recorded with this device. We collected 206,574 cataract frames from 1812 cataract eye videos. Ophthalmologists graded the nuclear cataracts (NUCs) using the cataract grading scale of the World Health Organization. These gradings were used to train and validate an ML algorithm. A validation dataset was used to compare the NUC diagnosis and grading of AI and ophthalmologists. The results of individual cataract gradings were: NUC 0: area under the curve (AUC) = 0.967; NUC 1: AUC = 0.928; NUC 2: AUC = 0.923; and NUC 3: AUC = 0.949. Our ML-based cataract diagnostic model achieved performance comparable to a conventional device, presenting a promising and accurate auto diagnostic AI tool.


Conflict of interest statement

E.S. is the founder of OUI Inc. and owns stock in OUI Inc. The other authors declare no competing interest associated with this manuscript. OUI Inc. did not have any additional role in the study design, data collection and analysis, decision to publish, or preparation of the manuscript.

Figures

Figure 1
Figure 1
Diagnostic performance according to frames. Diagnostic performance of our machine learning model against ophthalmologist diagnosis according to frame. (A) Mydriasis + Non mydriasis: Accuracy: 0.941 (95% confidence interval [CI], 0.935–0.946); Sensitivity: 0.928 (95% CI, 0.918–0.938); Specificity: 0.945 (95% CI, 0.941–0.949); Positive predictive value (PPV): 0.872 (95% CI, 0.862–0.880); Negative predictive value (NPV): 0.971 (95% CI, 0.967–0.975); the area under the curve (AUC) for the receiver operating characteristic: 0.921 (95% CI, 0.912–0.931). (B) Mydriasis only: Accuracy: 0.969 (95% CI, 0.935–0.946); Sensitivity: 0.800 (95% CI, 0.763–0.831); Specificity: 0.985 (95% CI, 0.982–0.988); PPV: 0.835 (95% CI, 0.796–0.867); NPV: 0.981 (95% CI, 0.978–0.984); AUC: 0.908 (95% CI, 0.881–0.935). (C) Non mydriasis only: Accuracy: 0.912 (95% CI, 0.903–0.921); Sensitivity: 0.951 (95% CI, 0.941–0.960); Specificity: 0.876 (95% CI, 0.867–0.884); PPV: 0.877 (95% CI, 0.868–0.885); NPV: 0.951 (95% CI, 0.941–0.959); AUC: 0.914 (95% CI, 0.903–0.925). (D) Confusion matrices of mydriasis + Non mydriasis, mydriasis only, and Non mydriasis only.
Figure 2
Figure 2
Diagnostic performance according to the videos. Diagnostic performance of our machine learning model against ophthalmologist diagnoses according to each video. (A) Mydriasis + Non mydriasis: Accuracy: 0.942 (95% confidence interval [CI], 0.911–0.959); Sensitivity: 0.962 (95% CI, 0.920–0.984); Specificity: 0.931 (95% CI, 0.905–0.944); PPV: 0.894 (95% CI, 0.855–0.914); NPV: 0.976 (95% CI, 0.949–0.990); the AUC for the receiver operating characteristic: 0.934 (95% CI, 0.897–0.970). (B) Mydriasis only: Accuracy: 0.963 (95% CI, 0.917–0.978); Sensitivity: 0.909 (95% CI, 0.681–0.983); Specificity: 0.969 (95% CI, 0.943–0.977); PPV: 0.769 (95% CI, 0.576–0.832); NPV: 0.989 (95% CI, 0.963–0.998); AUC: 0.857 (95% CI, 0.712–1.000). (C) Non mydriasis only: Accuracy: 0.929 (95% CI, 0.882–0.956); Sensitivity: 0.958 (95% CI, 0.915–0.981); Specificity: 0.893 (95% CI, 0.839–0.923); PPV: 0.919 (95% CI, 0.878–0.942); NPV: 0.944 (95% CI, 0.887–0.975); AUC: 0.934 (95% CI, 0.891–0.976). (D) Confusion matrices of mydriasis + Non mydriasis, mydriasis only, and Non mydriasis only.
Figure 3
Figure 3
Diagnostic performance of our machine learning model by each severity grade against the performance of an ophthalmologist. (A) According to each frame: nuclear cataract (NUC) grade 0: AUC, 0.961 (95% CI, 0.955–0.968); NUC grade 1: AUC, 0.910 (95% CI, 0.899–0.920); NUC grade 2: AUC, 0.903 (95% CI, 0.894–0.912); NUC grade 3: AUC, 0.901 (95% CI, 0.882–0.920). (B) According to each eye: NUC grade 0: AUC, 0.967 (95% CI, 0.943–0.990); NUC grade 1: AUC, 0.928 (95% CI, 0.886–0.970); NUC grade 2: AUC, 0.923 (95% CI, 0.880–0.966); NUC grade 3: AUC, 0.949 (95% CI, 0.868–1.000).
Figure 4
Figure 4
Visualization Using Grad-CAM (Gradient-weighted Class Activation Mapping): The cataract frames extracted were subjected to a post-hoc visual explanation methodology. The input data, as visualized by Grad-CAM activation mapping, produced a heatmap. Overlaying this heatmap on the input image revealed the focal region on the crystalline lens. Interestingly, for both cataract and non-cataract eyes, the model directed significant attention to the crystalline lens, as indicated by the intense heatmap.
Figure 5
Figure 5
Study outline. Demographic steps of the study. (A) Explanation of dataset creation. (B) Diagnosable frame extraction. We divided all the data into diagnosable (38,320 frames) and nondiagnosable (168,254 frames). (C) Cataract grade annotation and machine learning. Representative images of the annotated frames. The distribution of annotations was as follows: 18.40% were classified as NUC 0, 31.04% as NUC1, 41.84% as NUC2, and 8.71% as NUC3. (D) Validation and visualization. Demographic images for validation.

References

    1. Bourne RRA, et al. Magnitude, temporal trends, and projections of the global prevalence of blindness and distance and near vision impairment: A systematic review and meta-analysis. Lancet Glob. Health. 2017;5:e888–e897. doi: 10.1016/S2214-109X(17)30293-0. - DOI - PubMed
    1. Flaxman SR, et al. Global causes of blindness and distance vision impairment 1990–2020: A systematic review and meta-analysis. Lancet Glob. Health. 2017;5:e1221–e1234. doi: 10.1016/S2214-109X(17)30393-5. - DOI - PubMed
    1. He M, Wang W, Huang W. Variations and trends in health burden of visual impairment due to cataract: A global analysis. Invest. Ophthalmol. Vis. Sci. 2017;58:4299–4306. doi: 10.1167/iovs.17-21459. - DOI - PubMed
    1. Zhu M, et al. The relationship between disability-adjusted life years of cataracts and ambient erythemal ultraviolet radiation in China. J. Epidemiol. 2015;25:57–65. doi: 10.2188/jea.JE20140017. - DOI - PMC - PubMed
    1. World Health Organization. Global Health Estimates 2016: Disease Burden by Cause, Age, Sex, by Country and by Region, 2000–2016 (World Health Organization, 2018).

Supplementary concepts