. 2023 Dec 12;6(1):1258.
doi: 10.1038/s42003-023-05641-0.

Acute irradiation induces a senescence-like chromatin structure in mammalian oocytes

Affiliations

Acute irradiation induces a senescence-like chromatin structure in mammalian oocytes

Claudia Baumann et al. Commun Biol. .

Abstract

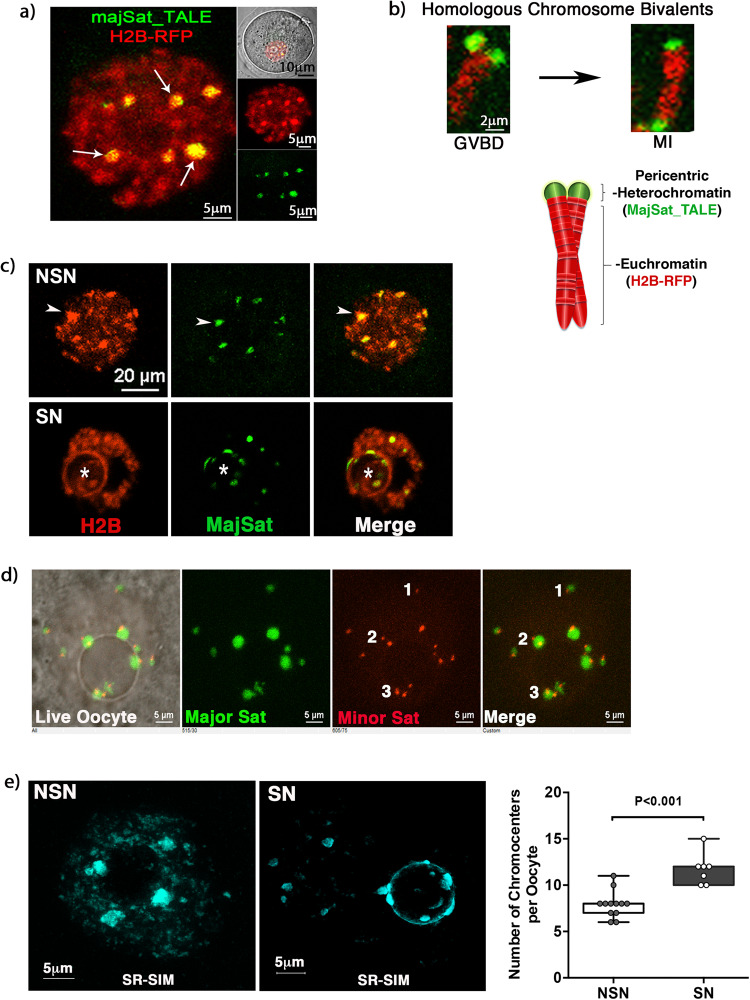
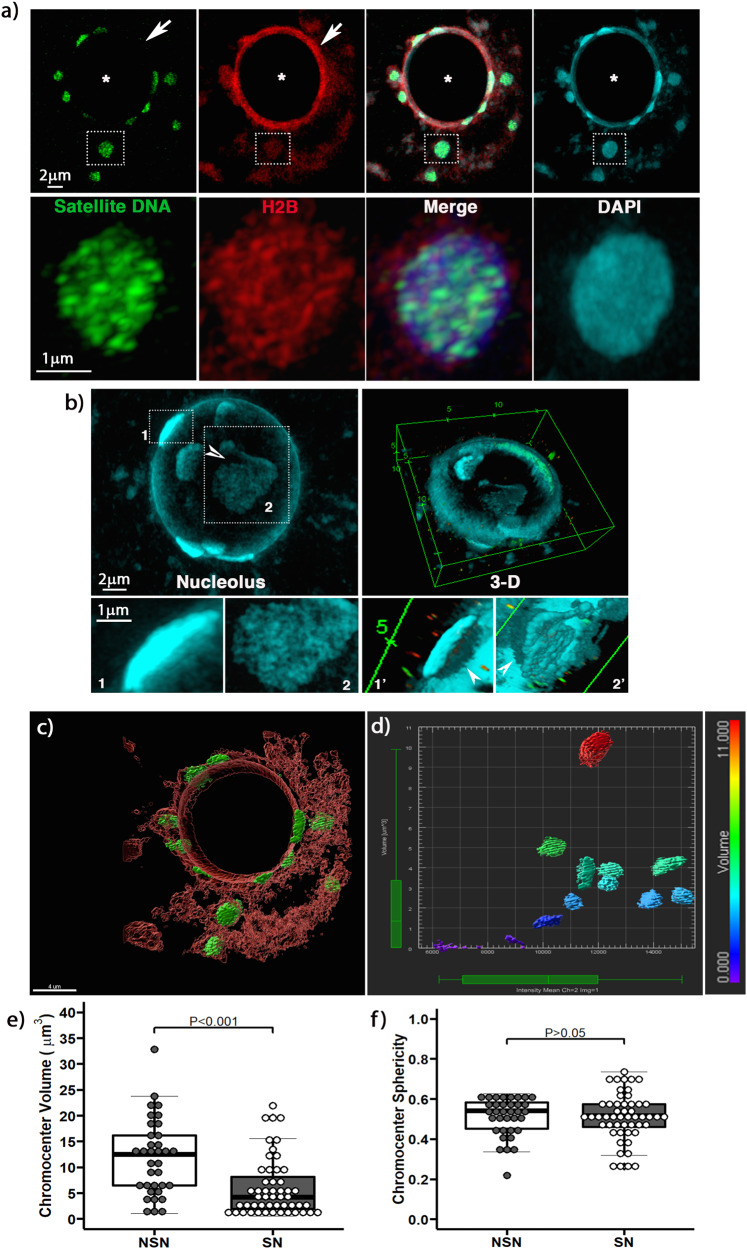
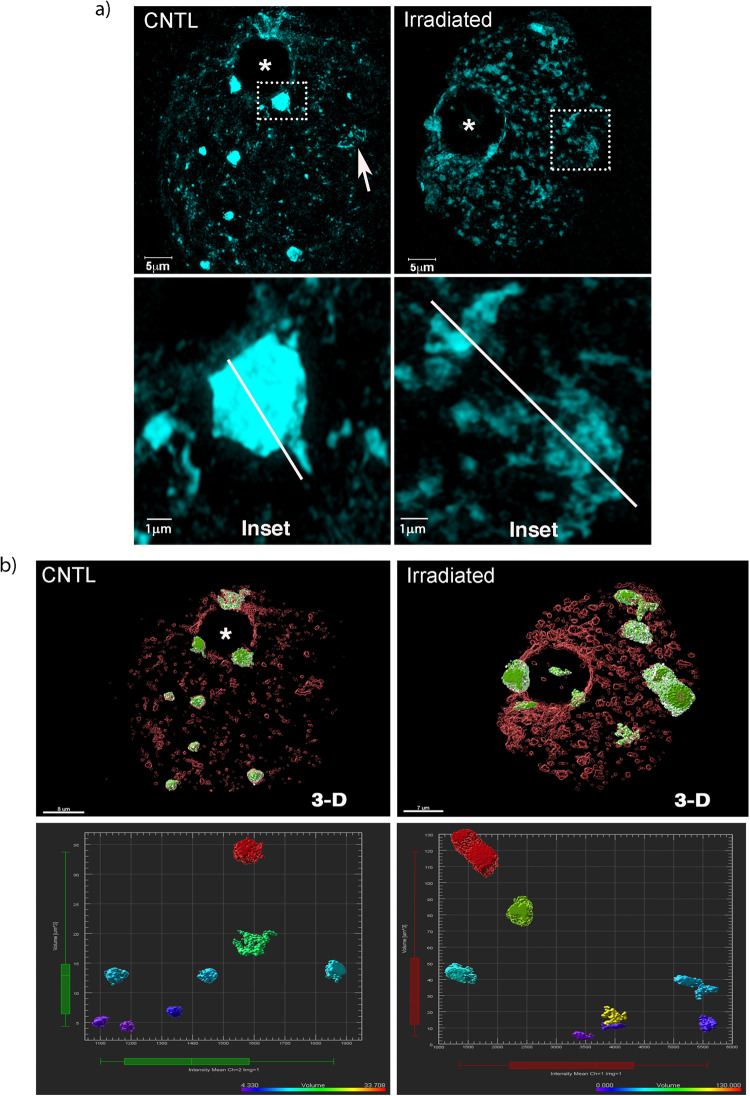
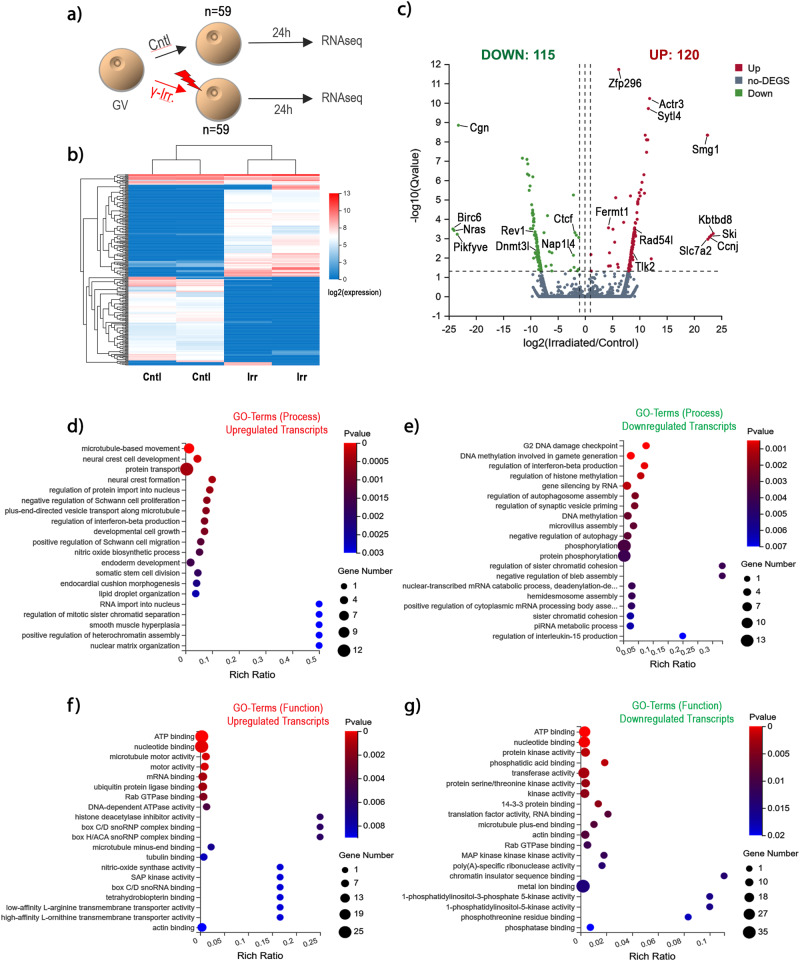
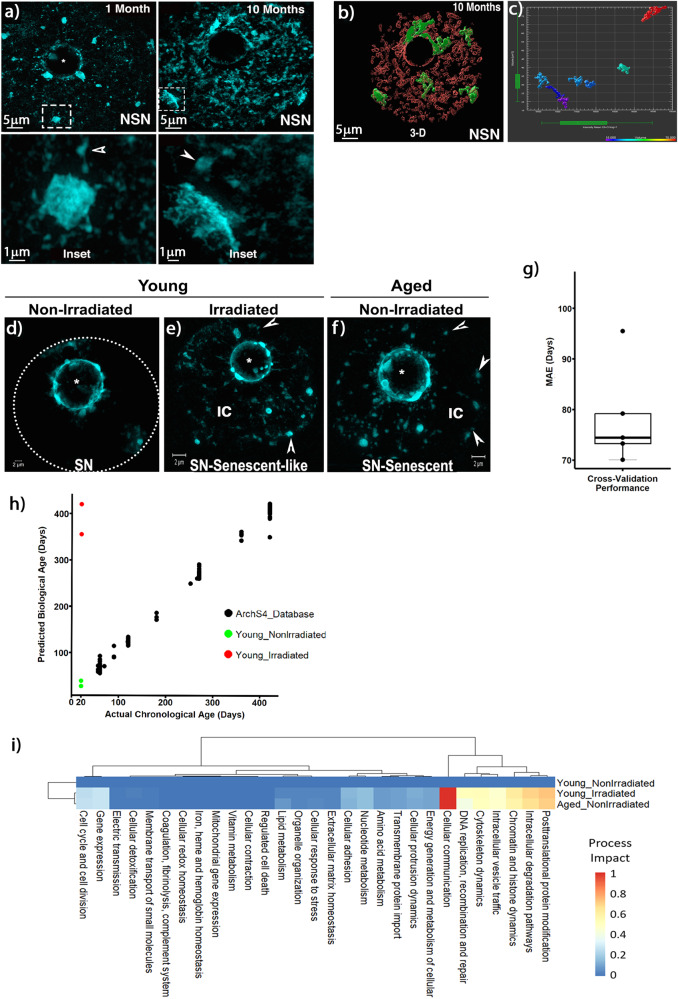
The mechanisms leading to changes in mesoscale chromatin organization during cellular aging are unknown. Here, we used transcriptional activator-like effectors, RNA-seq and superresolution analysis to determine the effects of genotoxic stress on oocyte chromatin structure. Major satellites are organized into tightly packed globular structures that coalesce into chromocenters and dynamically associate with the nucleolus. Acute irradiation significantly enhanced chromocenter mobility in transcriptionally inactive oocytes. In transcriptionally active oocytes, irradiation induced a striking unfolding of satellite chromatin fibers and enhanced the expression of transcripts required for protection from oxidative stress (Fermt1, Smg1), recovery from DNA damage (Tlk2, Rad54l) and regulation of heterochromatin assembly (Zfp296, Ski-oncogene). Non-irradiated, senescent oocytes exhibit not only high chromocenter mobility and satellite distension but also a high frequency of extra chromosomal satellite DNA. Notably, analysis of biological aging using an oocyte-specific RNA clock revealed cellular communication, posttranslational protein modifications, chromatin and histone dynamics as the top cellular processes that are dysregulated in both senescent and irradiated oocytes. Our results indicate that unfolding of heterochromatin fibers following acute genotoxic stress or cellular aging induced the formation of distended satellites and that abnormal chromatin structure together with increased chromocenter mobility leads to chromosome instability in senescent oocytes.


Conflict of interest statement

The authors declare no competing interests.

Figures

Fig. 1
Fig. 1. Live-cell imaging of major satellite DNA using fluorescent TALEs.
a Germinal vesicle stage oocyte microinjected with a transcriptional activator-like effector (majSat_TALE). Major satellite sequences (arrows, green) cluster into large chromocenters. Histone H2B-RFP (red). b MajSat_TALE reveals the physical proximity of pericentric heterochromatin domains from a homologous chromosome bivalent after germinal vesicle breakdown (GVBD) and their polar orientation at the metaphase-I (MI) stage. c Distinct chromocenter distribution in NSN and SN oocytes. Live cell imaging and confocal microscopy indicate that NSN oocytes exhibit chromocenters (green) distributed throughout the nucleoplasm (red) including the nuclear periphery (arrowheads). In SN oocytes, most chromocenters become associated with the nucleolus (asterisk). d Microinjection of majSat_TALE to detect pericentric heterochromatin domains (green) and MinSat_TALE to detect minor satellite sequences at the centromere (red) revealed that small chromocenters are formed by a single homologous chromosome bivalent with fused centromeres whereas large chromocenters are formed by the interaction and coalescence of pericentric heterochromatin domains from 2 or 3 homologous chromosome bivalents. e Superresolution structured illumination (SR-SIM) confirmed the presence of large chromocenters in NSN oocytes and revealed a significant (p = 0.0002) increase in the number of chromocenters in SN oocytes compared to NSN oocytes in (n = 7) and (n = 12) biologically independent samples, respectively. Box and whiskers plot with minimum, maximum and 25th and 75th percentiles. Mann–Whitney Test with a Cohen’s d effect size of 2.23 and actual confidence intervals of the median of 96.14% (NSN) and 98.44% (SN). Shown are maximum intensity projections of the entire oocyte nucleus stained with DAPI and pseudo colored in cyan for contrast.
Fig. 2
Fig. 2. Superresolution analysis of major satellite DNA and chromocenter organization in the oocyte genome.
a Superresolution structured illumination resolves a network of densely packed major satellite chromatin fibers (green) within compact chromocenters (inset). Histone H2B (red). DAPI is shown in Cyan. Scale bar = 2 μm. b Reconstruction of the oocyte nucleolus using 3D-SIM. Chromocenters show differences in size and topographical organization (insets 1–2). 3D-renderings reveal chromocenter splitting (arrowhead) and chromatin fibers interacting with the nucleolar surface (insets 1’–2’; arrowheads). Scale bar = 2 μm. c Quantification of chromocenter volume using a 3-D rendering of superresolved Z stack images of the entire nucleus of an SN oocyte. Major satellite DNA (green), histone H2B (red). (*) Demarcates the nucleolus. Scale bar = 4 μm. d Quantitative volumetric analysis was conducted using the 3-D surface renderings of each chromocenter. Differences in volume (μm3) are indicated according to the color-coded volumetric scale bar. e Analysis of the average chromocenter volume in NSN oocytes (n = 12) and SN oocytes (n = 7) of biologically independent samples (P = 0.000203). f Similar chromocenter sphericity indicates that chromocenters form globular structures in both NSN and SN oocytes (P = 0.9297). Box plots indicate the median, minimum and maximum values as well as the 25th and 75th percentiles. T-Test with a Cohen’s d effect size of 0.91 (E) and −0.22 (F) and actual 95% confidence intervals of 2.88 and 8.78 (E) and −0.05 and 0.04 (F), respectively.
Fig. 3
Fig. 3. γ-Irradiation increases chromocenter mobility in the oocyte genome.
a Live-cell analysis of chromocenter dynamics in control SN oocytes using majSat-TALE (green), Histone H2B (red). (*) Demarcates the position of the nucleolus. Speed (μm/s) and path length (μm) were quantified over a period of 5 h. b γ-Irradiation increased chromocenter mobility and induced detachment from the nucleolus. c Non-irradiated senescent oocytes exhibit inherently high chromocenter mobility. d Average mobility patterns observed in chromocenters from young control oocytes (n = 11), young, irradiated oocytes (n = 10) and non-irradiated, senescent oocytes (n = 11). Data presented as the mean ± S.D. of three independent experimental replicates. One-way ANOVA with Tukey’s multiple comparisons test with ****P < 0.0001 and P = 0.9997 for ns (not significant) for chromocenter speed and ****P < 0.0001 and P = 0.9421 for ns (not significant) for chromocenter path length. 95% confidence intervals were −0.002415 to −0.001602 (CNTL versus IRRAD.), −0.002445 to −0.001580 (CNTL vs. SENESC.), and −0.0004204 to 0.0004122 (IRRAD. versus SENESC.) for chromocenter speed. For chromocenter path length, 95% confidence intervals were −40.18 to −26.79 (CNTL versus IRRAD.), −41.57 to −27.31 (CNTL vs. SENESC.), and −7.816 to 5.905 (IRRAD. versus SENESC.) for chromocenter speed.
Fig. 4
Fig. 4. Distention of major satellite DNA sequences and abnormal chromatin fiber folding in response to γ-irradiation.
a Structured illumination of control and irradiated oocytes 24 h following γ-irradiation. DNA is stained with DAPI (Cyan). Non-irradiated oocytes exhibit highly condensed chromocenters with DAPI-bright staining (Inset). Scale bar = 5 μm. In contrast, irradiated oocytes exhibit a striking decondensation of chromocenters (Inset). Scale bar= 5 μm. Note the separation of chromatin fibers in a cross-section of the chromocenter (Inset; Line scan). b 3D-reconstruction of SR-SIM images to quantify chromocenter volume (μm3) and fluorescence intensity in control and irradiated oocytes. Major satellite DNA sequences (green); histone H2B (red). (*) Demarcates the nucleolus.
Fig. 5
Fig. 5. Transcriptome analysis following γ-irradiation of NSN oocytes.
a Germinal vesicle (GV) stage oocytes on day 16 of post-natal development were exposed to γ-irradiation (5 Gy) in n = 2 independent biological experiments. b Heatmap generated from transcriptional changes detected in control (n = 59) versus γ-irradiated (n = 59) oocytes, respectively 24 h post-irradiation in two replicates. Color shading indicates changes in log2 expression values. c Volcano plot of Control-vs-Irradiated transcript levels (DEseq2 method) depicting the log2-fold change of differential transcript expression. The Y axis represents log10 significance value. Upregulated transcripts (red); downregulated transcripts (green). d Overrepresented GO-Terms (biological process) for upregulated transcripts. Shading indicates level of significance. Size of the bubble represents number of transcripts in category. e Overrepresented GO-Terms (biological process) for downregulated transcripts. f Overrepresented GO-Terms (molecular function) for upregulated transcripts. g Overrepresented GO-Terms (molecular function) for downregulated transcripts.
Fig. 6
Fig. 6. Senescent oocytes exhibit distension of major satellites and share dysregulated cellular processes with irradiated oocytes.
a Comparison of large-scale chromatin structure between young (1-month old) and senescent oocytes (10-month old). SR-SIM resolves tightly packed chromatin fibers at condensed chromocenters in young oocytes (Inset). Senescent oocytes exhibit aberrant chromatin structure due to abnormal chromatin fiber folding and highly decondensed chromocenters (Inset). Scale bar = 5 μm. Inset scale bar = 1 μm. Arrowheads indicate euchromatin fibers. b 3D-SIM surface rendering of a 10-month-old oocyte showing distension of major satellite DNA fibers at chromocenters (green). Histone H2B (red). Scale bar = 5 μm. c Quantitative analysis of chromocenter volume (μm3) from the senescent oocyte shown in (b). d In young SN oocytes, chromatin is highly condensed around the nucleolus with limited contact with the nuclear periphery (dashed circle). e Following γ-irradiation several chromocenters detach from the nucleolus and chromatin fibers re-establish contacts with the nuclear periphery (arrowheads). Abnormal chromatin fiber folding and decondensation leads to the formation of a large interchromatin (IC) space. f Notably, non-irradiated senescent SN oocytes (10-month-old) exhibit a similar nuclear architecture as irradiated oocytes and chromocenters remain highly condensed. g Oocyte-specific RNA clock to identify cellular mechanisms dysregulated in both senescent and irradiated oocytes. Cross-validation performance of the oocyte-specific RNA clock given as mean absolute error (MAE) in days. The box plot indicates the minimum, maximum and median values and the 25% and 75% percentiles. h Scatter plot of actual chronological age (in days) versus predicted biological age (in days) for all training samples used. i Heatmap showing the level of impact on the oocyte-specific RNA clock model exerted by the dysregulation of top-level processes from the mouse version of the Molecular-Biology-of-the-Cell Ontology database.

References

    1. Allshire RC, Madhani HD. Ten principles of heterochromatin formation and function. Nat. Rev. Mol. Cell Biol. 2018;19:229–244. doi: 10.1038/nrm.2017.119. - DOI - PMC - PubMed
    1. Barra V, Fachinetti D. The dark side of centromeres: types, causes and consequences of structural abnormalities implicating centromeric DNA. Nat. Commun. 2018;9:4340–4340. doi: 10.1038/s41467-018-06545-y. - DOI - PMC - PubMed
    1. Baumann C, Zhang X, De La Fuente R. Loss of CBX2 induces genome instability and senescence-associated chromosomal rearrangements. J. Cell Biol. 2020;219:e201910149. doi: 10.1083/jcb.201910149. - DOI - PMC - PubMed
    1. Swanson EC, Manning B, Zhang H, Lawrence JB. Higher-order unfolding of satellite heterochromatin is a consistent and early event in cell senescence. J. Cell Biol. 2013;203:929–942. doi: 10.1083/jcb.201306073. - DOI - PMC - PubMed
    1. Chandra T, et al. Global reorganization of the nuclear landscape in senescent cells. Cell Rep. 2015;10:471–483. doi: 10.1016/j.celrep.2014.12.055. - DOI - PMC - PubMed

Publication types