

Construction of a risk stratification model integrating ctDNA to predict response and survival in neoadjuvant-treated breast cancer
- PMID: 38087296
- PMCID: PMC10717175
- DOI: 10.1186/s12916-023-03163-4
Construction of a risk stratification model integrating ctDNA to predict response and survival in neoadjuvant-treated breast cancer
Abstract
Background: The pathological complete response (pCR) to neoadjuvant chemotherapy (NAC) of breast cancer is closely related to a better prognosis. However, there are no reliable indicators to accurately identify which patients will achieve pCR before surgery, and a model for predicting pCR to NAC is required.
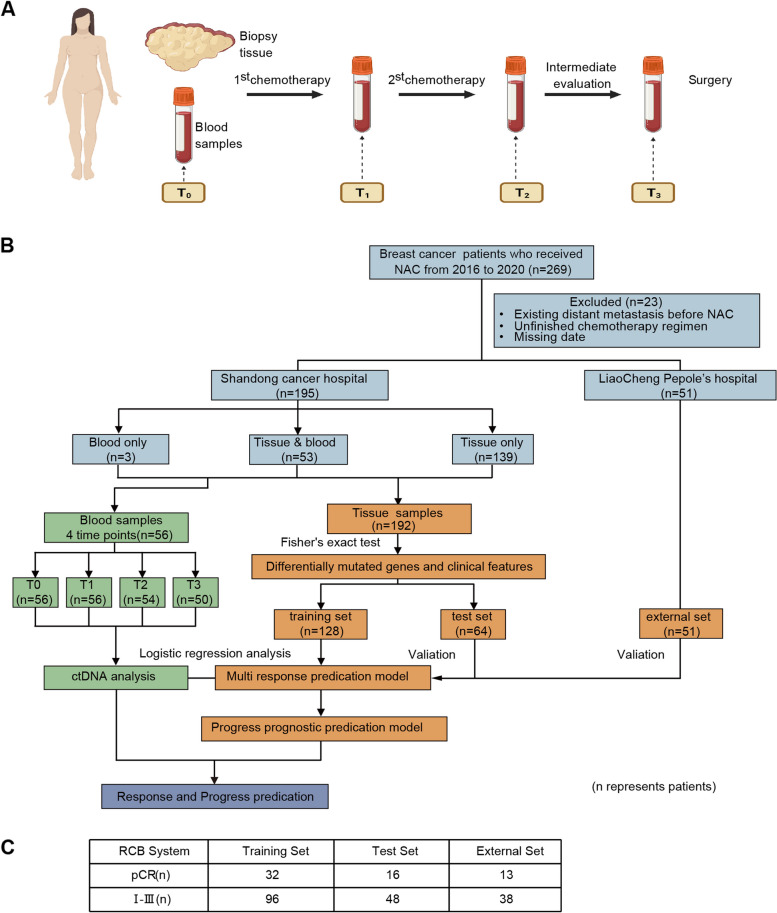
Methods: A total of 269 breast cancer patients in Shandong Cancer Hospital and Liaocheng People's Hospital receiving anthracycline and taxane-based NAC were prospectively enrolled. Expression profiling using a 457 cancer-related gene sequencing panel (DNA sequencing) covering genes recurrently mutated in breast cancer was carried out on 243 formalin-fixed paraffin-embedded tumor biopsies samples before NAC from 243 patients. The unique personalized panel of nine individual somatic mutation genes from the constructed model was used to detect and analyze ctDNA on 216 blood samples. Blood samples were collected at indicated time points including before chemotherapy initiation, after the 1st NAC and before the 2nd NAC cycle, during intermediate evaluation, and prior to surgery. In this study, we characterized the value of gene profile mutation and circulating tumor DNA (ctDNA) in combination with clinical characteristics in the prediction of pCR before surgery and investigated the prognostic prediction. The median follow-up time for survival analysis was 898 days.
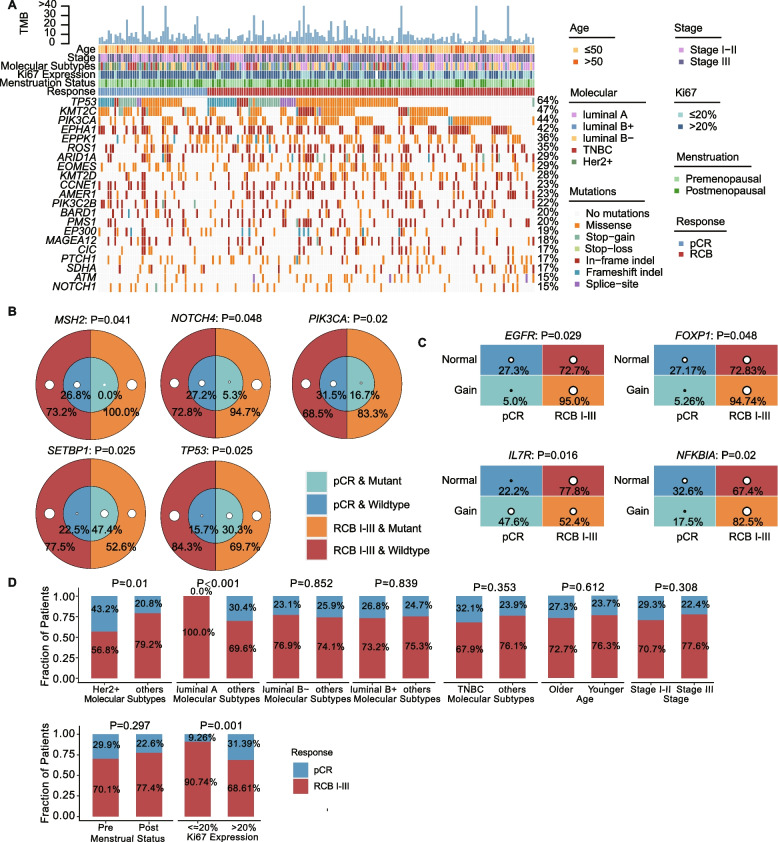
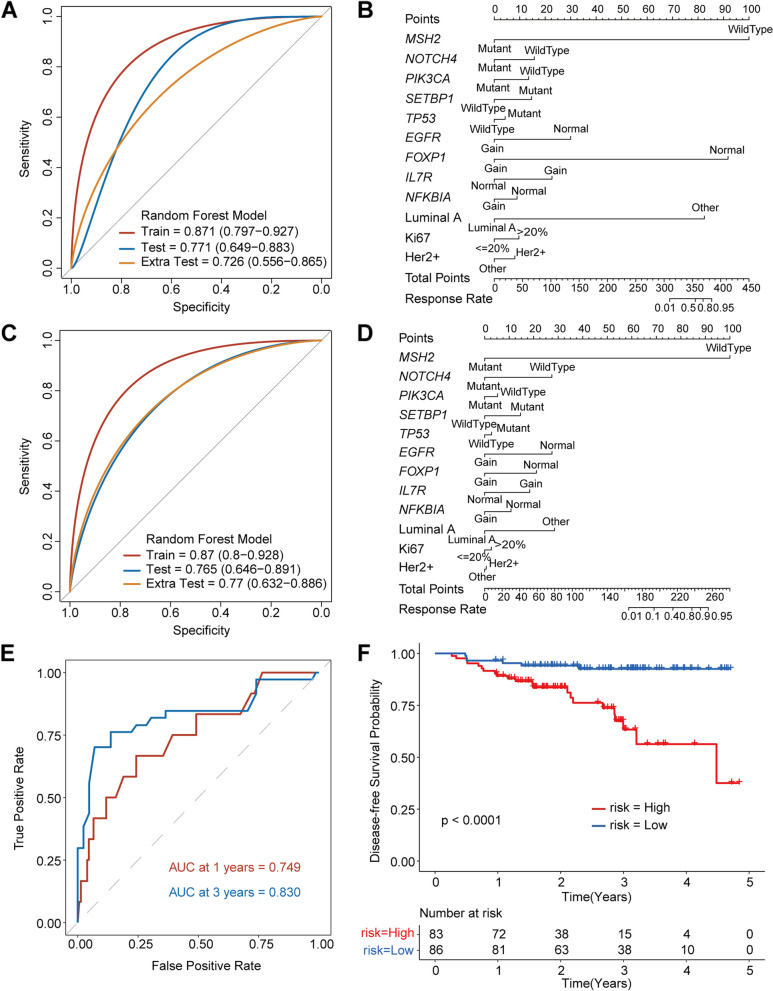
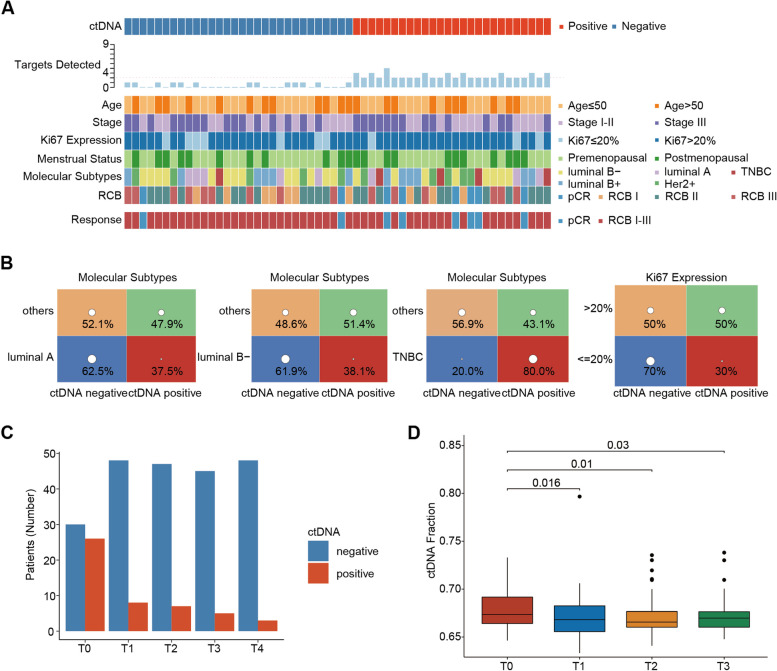
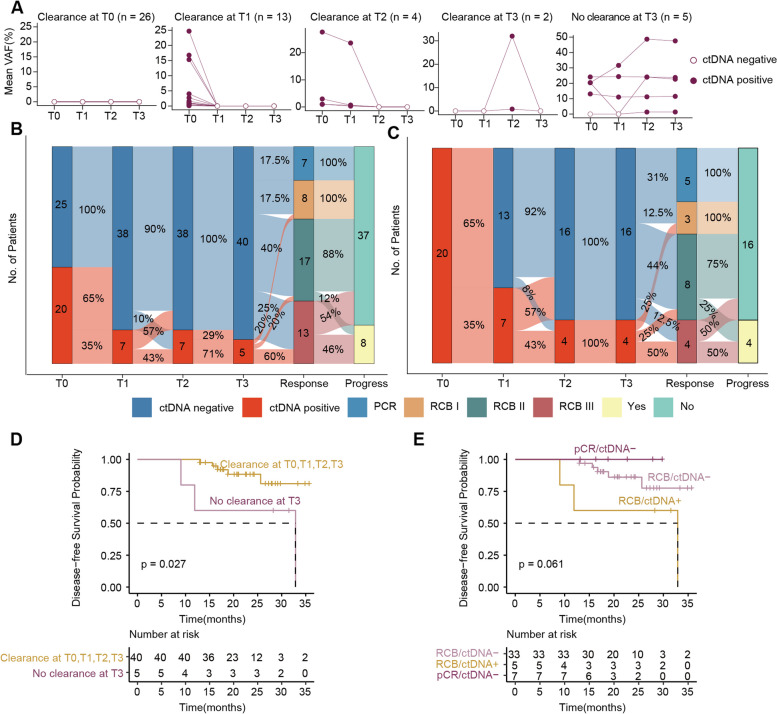
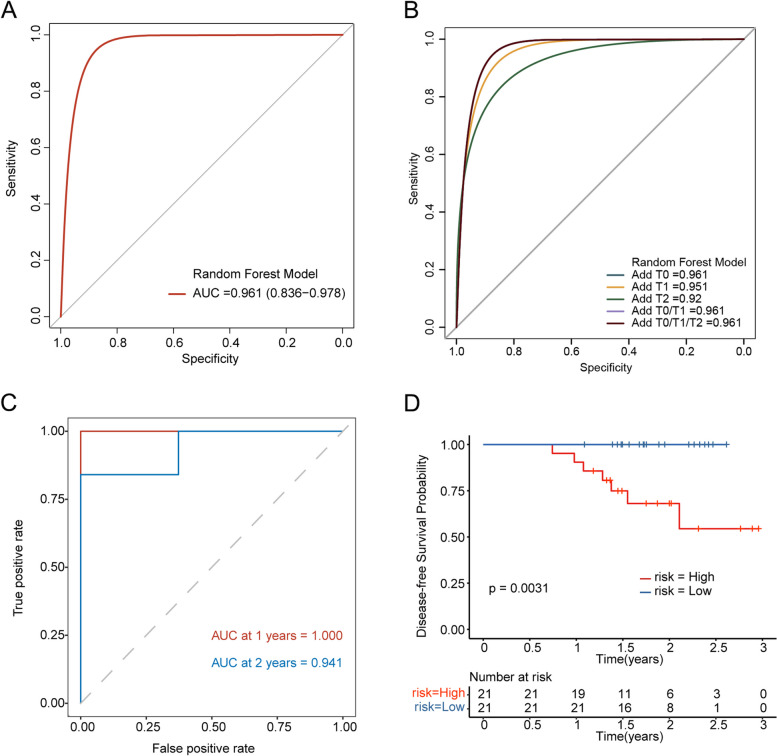
Results: Firstly, we constructed a predictive NAC response model including five single nucleotide variant (SNV) mutations (TP53, SETBP1, PIK3CA, NOTCH4 and MSH2) and four copy number variation (CNV) mutations (FOXP1-gain, EGFR-gain, IL7R-gain, and NFKB1A-gain) in the breast tumor, combined with three clinical factors (luminal A, Her2 and Ki67 status). The tumor prediction model showed good discrimination of chemotherapy sensitivity for pCR and non-pCR with an AUC of 0.871 (95% CI, 0.797-0.927) in the training set, 0.771 (95% CI, 0.649-0.883) in the test set, and 0.726 (95% CI, 0.556-0.865) in an extra test set. This tumor prediction model can also effectively predict the prognosis of disease-free survival (DFS) with an AUC of 0.749 at 1 year and 0.830 at 3 years. We further screened the genes from the tumor prediction model to establish a unique personalized panel consisting of 9 individual somatic mutation genes to detect and analyze ctDNA. It was found that ctDNA positivity decreased with the passage of time during NAC, and ctDNA status can predict NAC response and metastasis recurrence. Finally, we constructed the chemotherapy prediction model combined with the tumor prediction model and pretreatment ctDNA levels, which has a better prediction effect of pCR with the AUC value of 0.961.
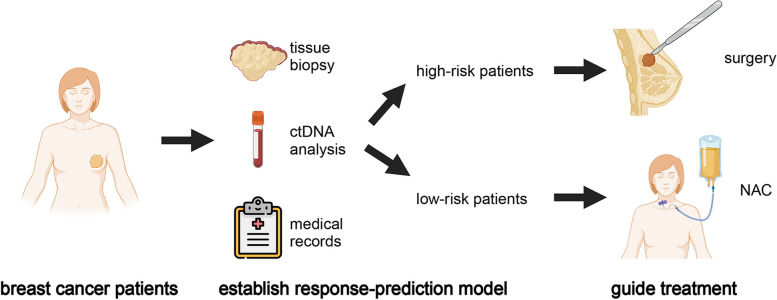
Conclusions: In this study, we established a chemotherapy predictive model with a non-invasive tool that is built based on genomic features, ctDNA status, as well as clinical characteristics for predicting pCR to recognize the responders and non-responders to NAC, and also predicting prognosis for DFS in breast cancer. Adding pretreatment ctDNA levels to a model containing gene profile mutation and clinical characteristics significantly improves stratification over the clinical variables alone.
Keywords: Breast cancer; Neoadjuvant chemotherapy; Prediction model; ctDNA; pCR.
© 2023. The Author(s).
Conflict of interest statement
The authors declare that they have no competing interests.
Figures
Similar articles
-
Circulating tumor DNA in neoadjuvant-treated breast cancer reflects response and survival.Ann Oncol. 2021 Feb;32(2):229-239. doi: 10.1016/j.annonc.2020.11.007. Epub 2020 Nov 21. Ann Oncol. 2021. PMID: 33232761 Free PMC article.
-
Utility of ctDNA in predicting response to neoadjuvant chemoradiotherapy and prognosis assessment in locally advanced rectal cancer: A prospective cohort study.PLoS Med. 2021 Aug 31;18(8):e1003741. doi: 10.1371/journal.pmed.1003741. eCollection 2021 Aug. PLoS Med. 2021. PMID: 34464382 Free PMC article.
-
Unraveling breast cancer response to neoadjuvant chemotherapy through integrated genomic, transcriptomic, and circulating tumor DNA analysis.Breast Cancer Res. 2025 May 1;27(1):64. doi: 10.1186/s13058-025-02026-5. Breast Cancer Res. 2025. PMID: 40312292 Free PMC article.
-
A nomogram to predict pathologic complete response (pCR) and the value of tumor-infiltrating lymphocytes (TILs) for prediction of response to neoadjuvant chemotherapy (NAC) in breast cancer patients.Breast Cancer Res Treat. 2019 Jan;173(2):255-266. doi: 10.1007/s10549-018-4981-x. Epub 2018 Oct 15. Breast Cancer Res Treat. 2019. PMID: 30324273 Review.
-
Circulating Tumour DNA and Its Prognostic Role in Management of Muscle Invasive Bladder Cancer: A Narrative Review of the Literature.Biomedicines. 2024 Apr 21;12(4):921. doi: 10.3390/biomedicines12040921. Biomedicines. 2024. PMID: 38672275 Free PMC article. Review.
Cited by
-
Integrated analysis of oral rinse-derived and plasma circulating tumour DNA for mutation profiling and outcome prediction with oral squamous cell carcinoma.NPJ Precis Oncol. 2025 Jun 13;9(1):183. doi: 10.1038/s41698-025-00976-9. NPJ Precis Oncol. 2025. PMID: 40514434 Free PMC article.
-
Circulating tumor DNA to monitor treatment response in solid tumors and advance precision oncology.NPJ Precis Oncol. 2025 Mar 24;9(1):84. doi: 10.1038/s41698-025-00876-y. NPJ Precis Oncol. 2025. PMID: 40122951 Free PMC article. Review.
-
Role of Circulating Tumor DNA in Adapting Immunotherapy Approaches in Breast Cancer.Curr Oncol. 2025 Jun 26;32(7):373. doi: 10.3390/curroncol32070373. Curr Oncol. 2025. PMID: 40710184 Free PMC article. Review.
-
The potential role of breast MRI in evaluation of triple-negative breast cancer and fibroadenoma of less than 3 cm.Transl Cancer Res. 2024 Aug 31;13(8):4042-4051. doi: 10.21037/tcr-24-498. Epub 2024 Aug 27. Transl Cancer Res. 2024. PMID: 39262467 Free PMC article.
-
Circulating tumor DNA fraction predicts residual cancer burden post-neoadjuvant chemotherapy in triple negative breast cancer.J Liq Biopsy. 2024 Sep 27;6:100168. doi: 10.1016/j.jlb.2024.100168. eCollection 2024 Dec. J Liq Biopsy. 2024. PMID: 40027305 Free PMC article.
References
Publication types
MeSH terms
Substances
Grants and funding
- 2019ZL002/the Academic Promotion Program of Shandong First Medical University
- 2019RU071/Research Unit of Radiation Oncology, Chinese Academy of Medical Sciences
- 81627901/the foundation of National Natural Science Foundation of China
- 81972863/the foundation of National Natural Science Foundation of China
- 82030082/the foundation of National Natural Science Foundation of China
LinkOut - more resources
Full Text Sources
Medical
Research Materials
Miscellaneous
