

The effect of metformin on senescence of T lymphocytes
- PMID: 38087369
- PMCID: PMC10714529
- DOI: 10.1186/s12979-023-00394-0
The effect of metformin on senescence of T lymphocytes
Abstract
Background: Immunosenescence occurs as people age, leading to an increased incidence of age-related diseases. The number of senescent T cells also rises with age. T cell senescence and immune response dysfunction can result in a decline in immune function, especially in anti-tumor immune responses. Metformin has been shown to have various beneficial effects on health, such as lowering blood sugar levels, reducing the risk of cancer development, and slowing down the aging process. However, the immunomodulatory effects of metformin on senescent T cells still need to be investigated.
Methods: PBMCs isolation from different age population (n = 88); Flow Cytometry is applied to determine the phenotypic characterization of senescent T lymphocytes; intracellular staining is applied to determine the function of senescent T cells; Enzyme-Linked Immunosorbent Assay (ELISA) is employed to test the telomerase concentration. The RNA-seq analysis of gene expression associated with T cell senescence.
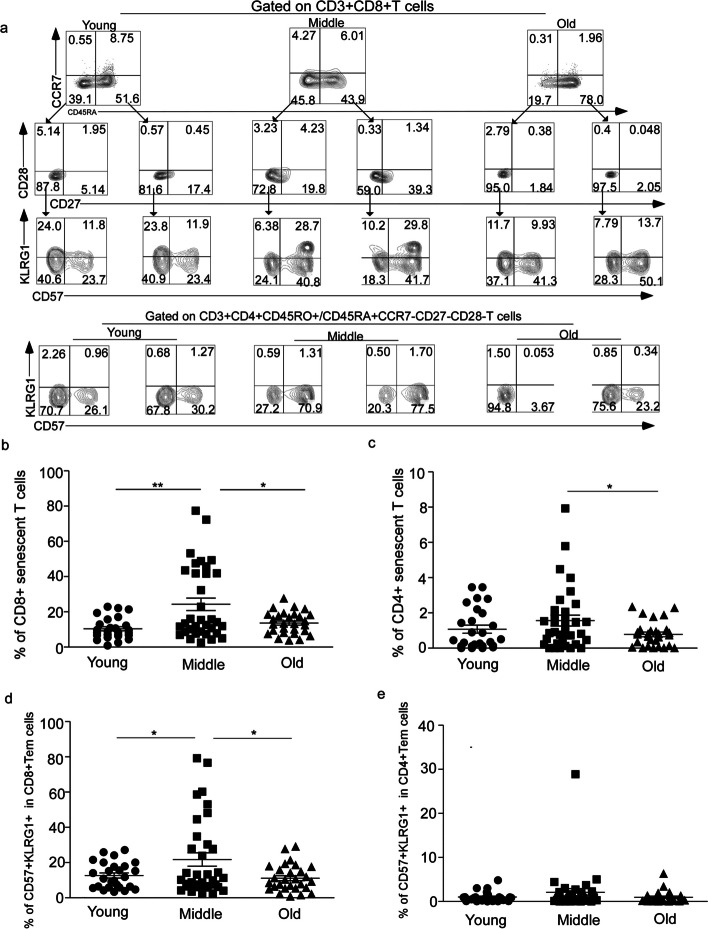
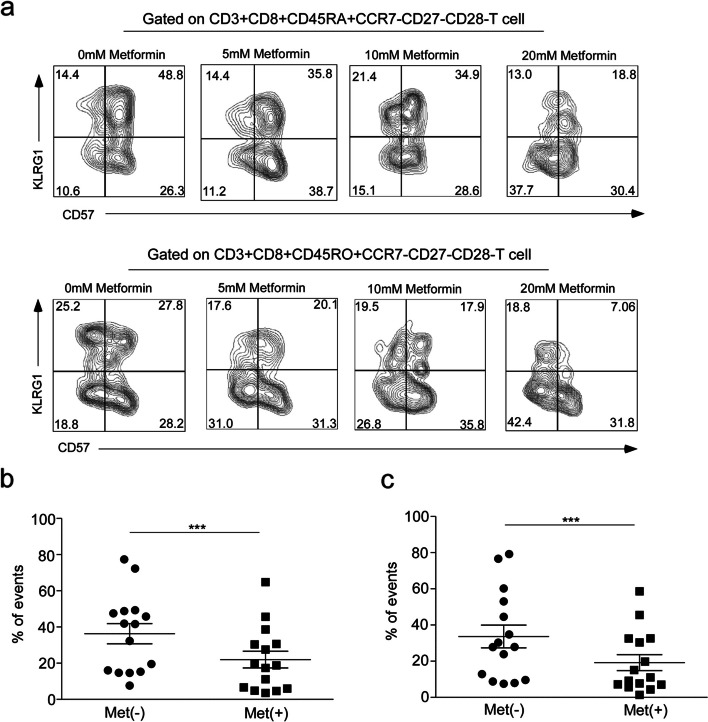
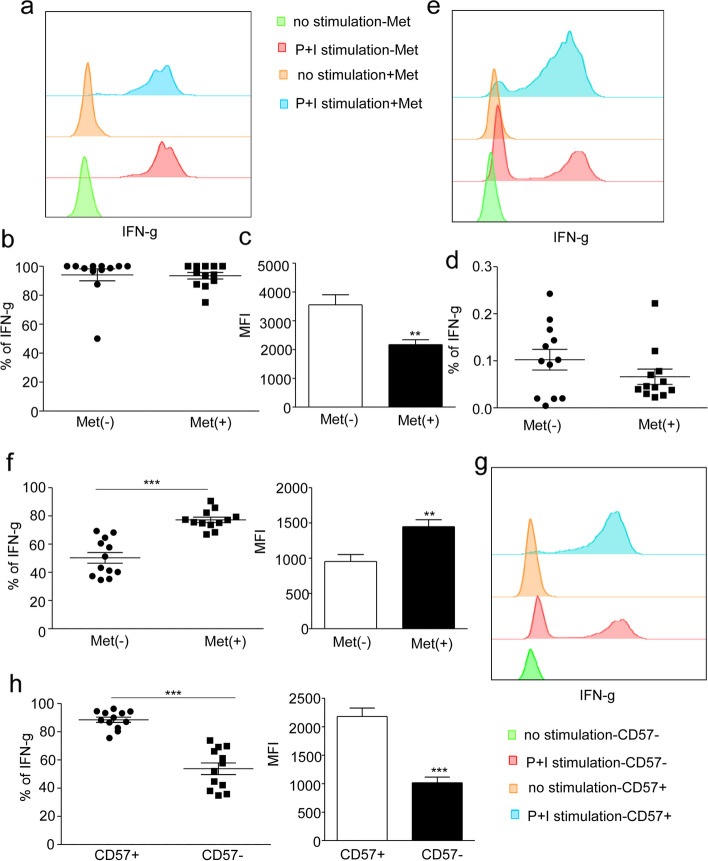
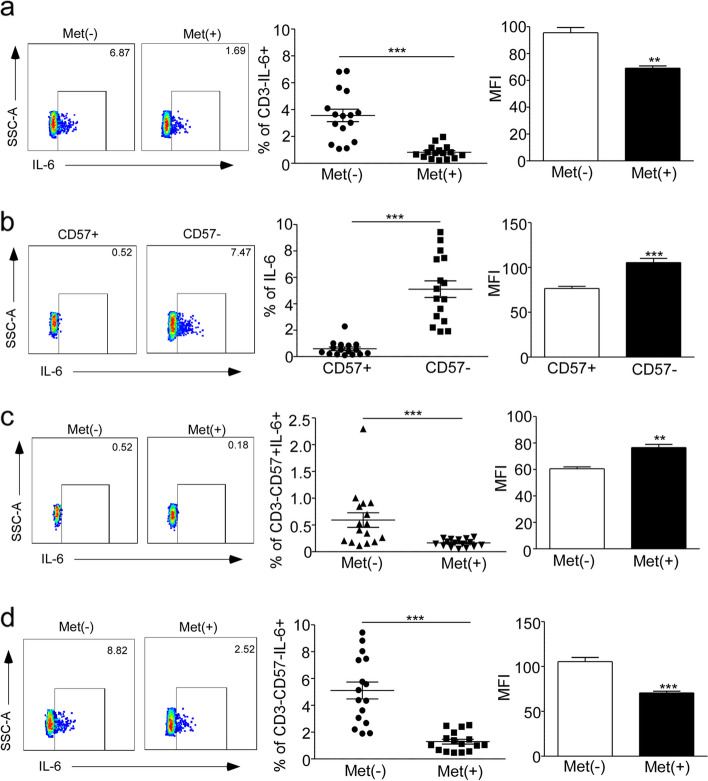
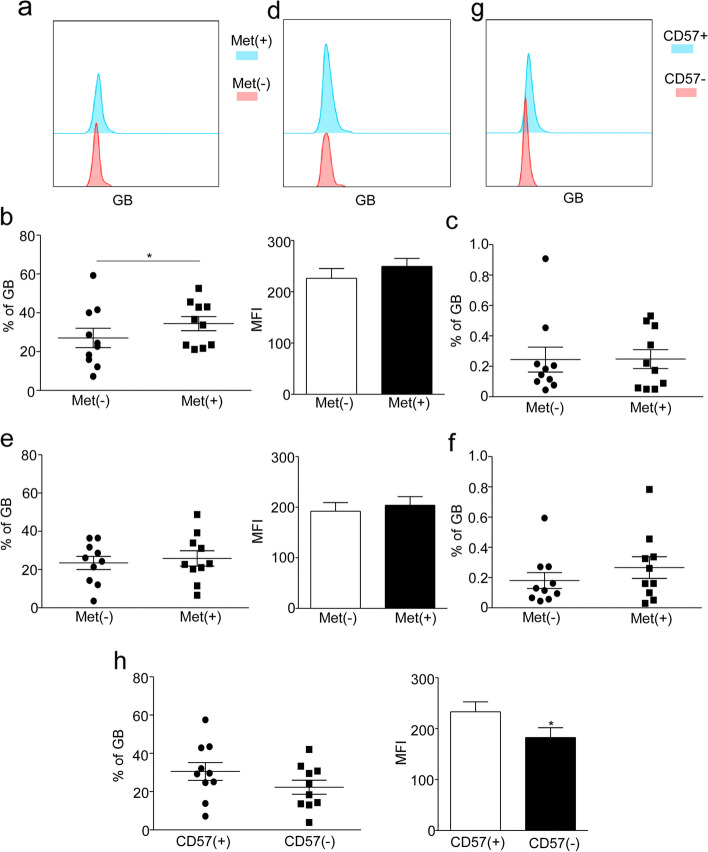
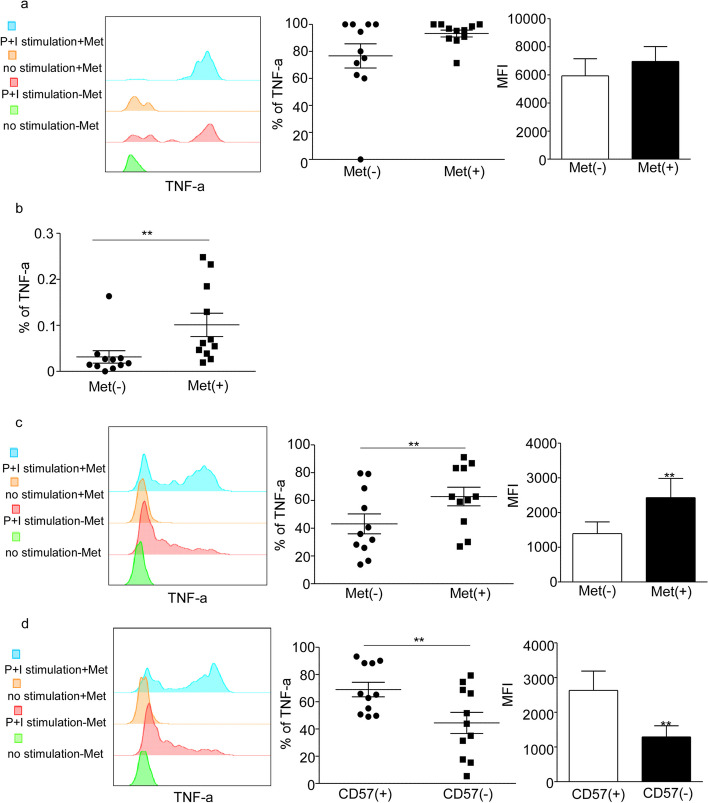
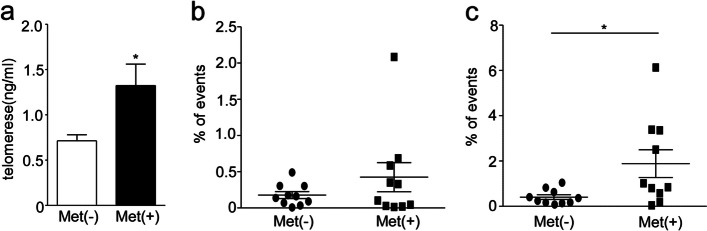
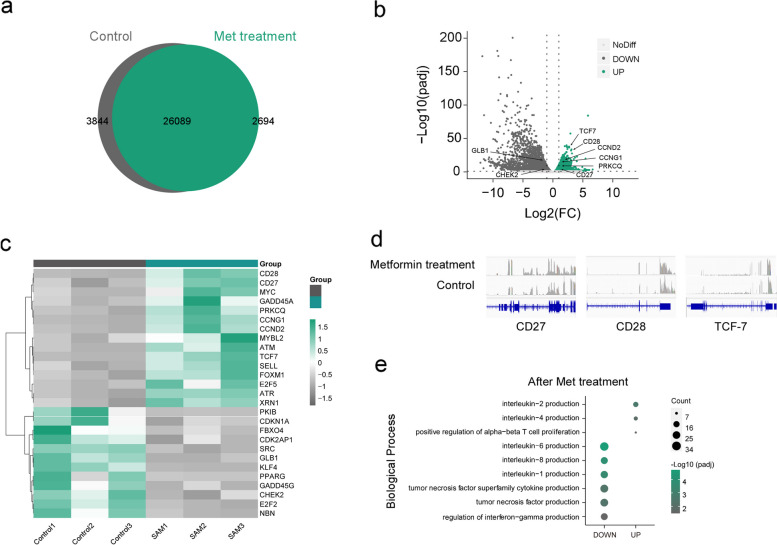
Results: The middle-aged group had the highest proportion of senescent T cells. We found that metformin could decrease the number of CD8 + senescent T cells. Metformin affects the secretion of SASP, inhibiting the secretion of IFN-γ in CD8 + senescent T cells. Furthermore, metformin treatment restrained the production of the proinflammatory cytokine IL-6 in lymphocytes. Metformin had minimal effects on Granzyme B secretion in senescent T cells, but it promoted the production of TNF-α in senescent T cells. Additionally, metformin increased the concentration of telomerase and the frequency of undifferentiated T cells. The results of RNA-seq showed that metformin promoted the expression of genes related to stemness and telomerase activity, while inhibiting the expression of DNA damage-associated genes.
Conclusion: Our findings reveal that metformin could inhibit T cell senescence in terms of cell number, effector function, telomerase content and gene expression in middle-aged individuals, which may serve as a promising approach for preventing age-related diseases in this population.
Keywords: Inhibition; Metformin; SASP; Senescent T cell.
© 2023. The Author(s).
Conflict of interest statement
The authors declare no competing interests.
Figures
Similar articles
-
Metformin mitigates SASP secretion and LPS-triggered hyper-inflammation in Doxorubicin-induced senescent endothelial cells.Front Aging. 2023 Apr 24;4:1170434. doi: 10.3389/fragi.2023.1170434. eCollection 2023. Front Aging. 2023. PMID: 37168843 Free PMC article.
-
Methods for Characterization of Senescent Circulating and Tumor-Infiltrating T-Cells: An Overview from Multicolor Flow Cytometry to Single-Cell RNA Sequencing.Methods Mol Biol. 2021;2325:79-95. doi: 10.1007/978-1-0716-1507-2_6. Methods Mol Biol. 2021. PMID: 34053052 Review.
-
IFN-γ and TNF Induce Senescence and a Distinct Senescence-Associated Secretory Phenotype in Melanoma.Cells. 2022 Apr 30;11(9):1514. doi: 10.3390/cells11091514. Cells. 2022. PMID: 35563820 Free PMC article.
-
Metformin and the ATM DNA damage response (DDR): accelerating the onset of stress-induced senescence to boost protection against cancer.Aging (Albany NY). 2011 Nov;3(11):1063-77. doi: 10.18632/aging.100407. Aging (Albany NY). 2011. PMID: 22170748 Free PMC article. Review.
-
Bronchiolitis obliterans syndrome is associated with increased senescent lymphocytes in the small airways.J Heart Lung Transplant. 2021 Feb;40(2):108-119. doi: 10.1016/j.healun.2019.12.005. Epub 2020 Nov 25. J Heart Lung Transplant. 2021. PMID: 33317956
Cited by
-
Senescent cells as a target for anti-aging interventions: From senolytics to immune therapies.J Transl Int Med. 2025 Mar 19;13(1):33-47. doi: 10.1515/jtim-2025-0005. eCollection 2025 Feb. J Transl Int Med. 2025. PMID: 40115034 Free PMC article.
-
Metformin Beyond Diabetes: A Precision Gerotherapeutic and Immunometabolic Adjuvant for Aging and Cancer.Cancers (Basel). 2025 Jul 25;17(15):2466. doi: 10.3390/cancers17152466. Cancers (Basel). 2025. PMID: 40805165 Free PMC article. Review.
-
Deciphering the impact of TERT/telomerase on immunosenescence and T cell revitalization.Front Immunol. 2024 Sep 23;15:1465006. doi: 10.3389/fimmu.2024.1465006. eCollection 2024. Front Immunol. 2024. PMID: 39376566 Free PMC article. Review.
-
T-Cell Senescence in Human Metabolic Diseases.Diabetes Metab J. 2024 Sep;48(5):864-881. doi: 10.4093/dmj.2024.0140. Epub 2024 Aug 28. Diabetes Metab J. 2024. PMID: 39192822 Free PMC article. Review.
-
Ageing-related bone and immunity changes: insights into the complex interplay between the skeleton and the immune system.Bone Res. 2024 Aug 5;12(1):42. doi: 10.1038/s41413-024-00346-4. Bone Res. 2024. PMID: 39103328 Free PMC article. Review.
References
-
- Rodriguez IJ. N Lalinde Ruiz, M Llano León, L Martínez Enríquez, MDP Montilla Velásquez, JP Ortiz Aguirre, OM Rodríguez Bohórquez, EA Velandia Vargas, ED Hernández, CA Parra López, Immunosenescence Study of T Cells: A Systematic Review. Frontiers in immunology. 2020;11:604591. doi: 10.3389/fimmu.2020.604591. - DOI - PMC - PubMed
-
- Carrasco E, Gómez de Las Heras MM, Gabandé-Rodríguez E, Desdín-Micó G, Aranda JF, Mittelbrunn M. The role of T cells in age-related diseases nature reviews. Immunology. 2022;22:97–111. - PubMed
Grants and funding
LinkOut - more resources
Full Text Sources
Research Materials
