. 2024 Feb;11(7):e2305620.
doi: 10.1002/advs.202305620. Epub 2023 Dec 12.

Transgelin Promotes Glioblastoma Stem Cell Hypoxic Responses and Maintenance Through p53 Acetylation

Affiliations

Transgelin Promotes Glioblastoma Stem Cell Hypoxic Responses and Maintenance Through p53 Acetylation

Huan Li et al. Adv Sci (Weinh). 2024 Feb.

Abstract

Glioblastoma (GBM) is a lethal cancer characterized by hypervascularity and necrosis associated with hypoxia. Here, it is found that hypoxia preferentially induces the actin-binding protein, Transgelin (TAGLN), in GBM stem cells (GSCs). Mechanistically, TAGLN regulates HIF1α transcription and stabilizes HDAC2 to deacetylate p53 and maintain GSC self-renewal. To translate these findings into preclinical therapeutic paradigm, it is found that sodium valproate (VPA) is a specific inhibitor of TAGLN/HDAC2 function, with augmented efficacy when combined with natural borneol (NB) in vivo. Thus, TAGLN promotes cancer stem cell survival in hypoxia and informs a novel therapeutic paradigm.

Keywords: HDAC2; HIF1α Hypoxia; glioblastoma stem cells; natural borneol; sodium valproate; transgelin.


Conflict of interest statement

The authors declare no conflict of interest.

Figures
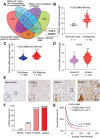
Figure 1
Figure 1
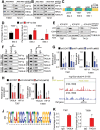
TAGLN is highly expressed in glioblastoma. A) Venn diagram showing the overlapping of four datasets, hypoxia and GSC‐related genes in Genecards, DEGs associated with high HIF1A expression,intersection of DEGs in three databases of TISCH2 and DGEs from GEPIA2 GBM, comprised two genes: TAGLN and EFEMP1. B) TAGLN expression in a panel of GBM (IDH‐WT) and normal brain samples from the Gliovis TCGA RNA‐seq dataset. Unpaired t‐tests were used to calculate statistical significance, p<0.01. C) Histogram of TAGLN expression in IDH wild‐type and mutant GBM samples from the Gliovis TCGA_GBM/LGG (IDH‐WT) RNA‐seq dataset. Unpaired t‐tests were used to calculate statistical significance, p<0.0001. D) Plot of TAGLN expression in patients from the CGGA (IDH‐WT) database (Student's t‐test). E) Representative images of glioma tissue microarray samples showing TAGLN expression. Scale bar, 50 µm. F) The proportion of TAGLN‐positive tissues in glioma or normal brain tissue was shown. G) Kaplan‐Meier survival analysis of patients with different TAGLN expression levels in the Gliovis CGGA (IDH‐WT) dataset (log‐rank test). Data are represented as mean ± SD (**p < 0.01, ***p < 0.001, and ****p < 0.0001).
Figure 2
Figure 2
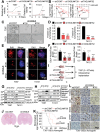
Preferential expression of TAGLN in hypoxia‐induced GSCs. A) Volcano plot of differentially expressed genes at peritumoral regions and pseudopalisades in GBM tissue. Red dots, genes upregulated in hypoxia; Blue dots, genes downregulated in hypoxia. B) Representative images of HE (Scale bar, 100 µm) and IHC (Scale bar, 50 µm) stained in pseudopalisades located around the necrosis (upper) and other areas (lower) of serial sections of hGBM samples. The red arrow points to the necrosis (N) in GBM and the black arrow represents the pseudopalisades (P) around the necrosis. The large black square in the lower‐left corner of the image is an enlarged view of the small black square in the image. C) Representative images of IF staining for TAGLN, CA9, and HIF1α in hGBM tissues. Scale bar, 50 µm. D) Expression levels of TAGLN and HIF1α were examined by IB in GSCs cultured in 1% O2 for the indicated time. E) Representative images of IF staining for TAGLN and putative GSCs markers in hGBM sections. Scale bar, 25µm. F) Cell lysates were analyzed by IB for TAGLN, OLIG2, and GFAP expression. G) The expression of TAGLN in GSCs and glioma cells was tested by IB. H) IB analyzed TAGLN expression in GSCs and NPCs. I) Kaplan‐Meier curve showing patient survival based on HIF1A mRNA expression in the CGGA GBM (IDH‐WT) dataset. J) The Kaplan‐Meier survival curve was calculated to measure survival in the group of TAGLN hi HIF1A hi (n = 139), TAGLN hi HIF1A lo, (n = 73), TAGLN lo HIF1A hi, (n = 73), and TAGLN lo HIF1A lo (n = 139).
Figure 3
Figure 3
The hypoxic transcription factor‐TAGLN. A,B) IB showed the indicated protein levels in GSCs after targeting HIF1α or HIF2α. C) Schematic representation of the three predicted HRE‐binding sites in the TAGLN promoter. D) ChIP‐qPCR analysis of HRE site occupancy in TAGLN promoter (Student's t‐test). E) IB showed protein expression in GSCs after TAGLN targeting. F) Co‐IP analysis of endogenous TAGLN (left) or HIF1α (right) in GSCs, followed by determination of the expression of HIF1α and TAGLN by IB. G) mRNA expression of HIF1A and TAGLN was assessed by qRT‐PCR following HIF1A knockdown. H) Expression of TAGLN and HIF1A after targeting TAGLN in GSCs was examined by qRT‐PCR. I) TAGLN‐binding peak in HIF1A. J) HIF1A motif to which TAGLN binds. K) ChIP‐qPCR of the indicated genes in GSCs (Student's t‐test). Values in (D,G,H, and K) represent the mean ± SD from three independent experiments (*p < 0.05, **p < 0.01, ***p < 0.001, and ****p < 0.0001).
Figure 4
Figure 4
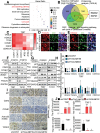
Targeting TAGLN impairs GSC self‐renewal and tumorigenicity. A) Cell viability assay of GSCs infected with the two shRNAs against TAGLN (Two Way ANOVA). B) In the limiting dilution assays, the sphere‐forming frequency was examined following TAGLN knockdown (ELDA). C,D) Representative images of neurospheres derived from GSCs expressing shCONT or C) shTAGLN and D) quantification. Scale bar, 100 µm. E) Representative images of the EdU assay after TAGLN knockdown and F) the ratio of EdU‐positive cells was calculated. Scale bar, 50 µm. G) Expression of the indicated proteins during TAGLN targeting was detected by IB. H) IB of apoptotic proteins in GSCs after TAGLN knockdown. I) Experimental design. J) Representative images of HE staining in the brains of tumor‐bearing mice. The scale bar is 10 mm. K) Kaplan‐Meier curves of mice were drawn to determine the burden of tumor progression on GSCs expressing shCONT or shTAGLN (log‐rank test, n = 9 for each group). L) Representative IHC images of the indicated proteins stained on frozen sections of the GBM xenografts. The bar represents 50 µm. Values in (A, B, and D) represent the mean ± SD from three independent experiments (**p < 0.01, ***p < 0.001, and ****p < 0.0001).
Figure 5
Figure 5
The preservation of the self‐renewal capacity of GSCs benefits from the activation of the TAGLN/HDAC2 deacetylated p53 signaling. A) Scatter plot of KEGG pathway enrichment analysis of differentially expressed genes in the RNA‐seq data after TAGLN knockdown. B) Proteins interacting with TAGLN were analyzed in HitPredict (high confidence, n = 185), proteins co‐precipitated with TAGLN were detected by mass spectrometry (n = 190), and proteins associated with glioma stem cells, hypoxia, p53 signaling pathway, and cell cycle in Genecards (> median, n = 1362), and overlapping proteins HDAC2 and HCFC1 were identified using Venn diagram. C) Heat map showing the differentially expressed genes after TAGLN knockdown. D) IF staining of TAGLN and p53 in hGBM tissues. Scale bar, 25 µm. E) Expression of HDAC2 and p53 in hGBM tissues was observed by IF. Scale bar, 25 µm. F,G) The indicated protein levels were examined in cell lysates of GSCs expressing shTAGLN, shHDAC2, or shCONT. H) mRNA levels of TAGLN and TAGLN target genes were assessed by qRT‐PCR following HDAC2 knockdown. I) IHC staining of TAGLN and p53 signaling elements in GBM xenografts with TAGLN knockdown. Scale bar, 50 µm. J) Quantification of the indicated protein intensities in IHC by measuring IOD (I). Values in (H and J) represent the mean ± SD from three independent experiments (*p < 0.05, **p < 0.01, ***p < 0.001, and ****p < 0.0001).
Figure 6
Figure 6
TAGLN binds to HDAC2 to form a co‐transcriptional activator complex. A) Expression of HDAC2 and TAGLN was detected by IB. B) Expression of TAGLN and HDAC2 in GSCs after HDAC2 knockdown was examined by IB. C) Expression of HDAC2, TAGLN, and HIF1α during HIF1α targeting was detected by IB under hypoxia. D) Representative IHC images of TAGLN, HDAC2, CA9, and HIF1α expression in the xenografts. Scale bar, 50 µm. E) IOD of HDAC2, TAGLN, CA9, and HIF1α were measured in (D). F) IB analysis of TAGLN and HDAC2 in different treatment groups. G,H) IF staining of HDAC2 (red) and LAMP1 (lysosomal marker; green) after DMSO or chloroquine treatment of TAGLN targeted GSCs. Scale bar, 10 µm. I) IHC staining revealed HDAC2, HIF1α, CA9, and TAGLN expression in pseudopalisades (upper) or other areas (lower) of GBM. Scale bar,50 µm. J) Representative images of TAGLN and HDAC2 expression in GBM specimens. Scale bar, 25 µm. K) Co‐IP analysis of TAGLN and HDAC2 in three GSC cell lines. Values in (E) represent the mean ± SD from three independent experiments (*p < 0.05, **p < 0.01, and ***p < 0.001).
Figure 7
Figure 7
Sodium valproate blocks TAGLN/HDAC2 to promote P53 acetylation and the self‐renewal of GSCs. A) Schematic representation of the structural formula of sodium valproate. B) T387 and T3691 GSCs were treated with 2 or 4 mM sodium valproate for 48 h in hypoxia, and the levels of TAGLN, HDAC1, and HDAC2 were analyzed by IB. C) Viability of GSCs over a 3‐day period following sodium valproate treatment (Two Way ANOVA). D) GSCs’ markers expression detected by IB in sodium valproate‐treated GSCs. E) Expression of apoptotic proteins in GSCs was analyzed following treatment with sodium valproate. F) Representative images and G) quantification of neurosphere formation in GSCs treated with sodium valproate (Student's t‐test). Scale bar, 100 µm. H) Cell viability assays after sodium valproate or normal saline treatment in GSCs with or without TAGLN overexpression (Student's t‐test). I) p53 signaling elements were assessed following sodium valproate treatment. J) Schematic of the structural formula of natural borneol. K) Experimental design. L) Kaplan‐Meier curves of tumor‐bearing mice treated with the indicated treatments (Log‐rank test, n = 5 for each group). M) Mechanistic model diagram of TAGLN regulating GSC stability. Under normoxia, TAGLN remained at a low level, and the transcriptional activity of HDAC2, which interacted with TAGLN, was reduced and degradation was enhanced, resulting in a decrease in the self‐renewal of GSC. Hypoxia can induce upregulation of TAGLN expression, by forming a transcriptional complex with HIF1α and upregulating the level of deacetylation of p53 after binding to HDAC2, thereby promoting cell cycle progression and maintaining the stability of GSC. Values in (C, G, and H) represent the mean ± SD from three independent experiments (*p < 0.05, **p < 0.01, and ****p < 0.0001).

References

    1. a) Janjua T. I., Rewatkar P., Ahmed‐Cox A., Saeed I., Mansfeld F. M., Kulshreshtha R., Kumeria T., Ziegler D. S., Kavallaris M., Mazzieri R., Popat A., Adv Drug Deliv Rev 2021, 171, 108; - PubMed
    2. b) Liu S., Shi W., Zhao Q., Zheng Z., Liu Z., Meng L., Dong L., Jiang X., Biomed. Pharmacother. 2021, 141, 111810. - PubMed
    1. a) Brennan C. W., Verhaak R. G. W., Mckenna A., Campos B., Noushmehr H., Salama S. R., Zheng S., Chakravarty D., Sanborn J. Z., Berman S. H., Beroukhim R., Bernard B., Wu C. J., Genovese G., Shmulevich I., Barnholtz‐Sloan J., Zou L., Vegesna R., Shukla S. A., Ciriello G., Yung W. K., Zhang W., Sougnez C., Mikkelsen T., Aldape K., Bigner D. D., Van Meir E. G., Prados M., Sloan A., Black K. L., et al., Cell 2013, 155, 462; - PMC - PubMed
    2. b) Parsons D. W., Jones S., Zhang X., Lin J. C.‐H., Leary R. J., Angenendt P., Mankoo P., Carter H., Siu I. M., Gallia G. L., Olivi A., Mclendon R., Rasheed B. A., Keir S., Nikolskaya T., Nikolsky Y., Busam D. A., Tekleab H., Diaz L. A., Hartigan J., Smith D. R., Strausberg R. L., Marie S. K. N., Shinjo S. M. O., Yan H., Riggins G. J., Bigner D. D., Karchin R., Papadopoulos N., Parmigiani G., et al., Science 2008, 321, 1807. - PMC - PubMed
    1. a) Obacz J., Pastorekova S., Vojtesek B., Hrstka R., Molecular Cancer 2013, 12; - PMC - PubMed
    2. b) Sermeus A., Michiels C., Cell Death Dis. 2011, 2, e164; - PMC - PubMed
    3. c) Koshikawa N., Maejima C., Miyazaki K., Nakagawara A., Takenaga K., Oncogene 2006, 25, 917; - PubMed
    4. d) Jing X., Yang F., Shao C., Wei K., Xie M., Shen H., Shu Y., Mol Cancer 2019, 18, 157; - PMC - PubMed
    5. e) Ashur‐Fabian O., Avivi A., Trakhtenbrot L., Adamsky K., Cohen M., Kajakaro G., Joel A., Amariglio N., Nevo E., Rechavi G., Proc. Natl. Acad. Sci. U. S. A. 2004, 101, 12236. - PMC - PubMed
    1. a) Zhang Y., Dube C., Gibert M., Cruickshanks N., Wang B., Coughlan M., Yang Y., Setiady I., Deveau C., Saoud K., Grello C., Oxford M., Yuan F., Abounader R., Cancers, Basel 2018, 10, 297; - PMC - PubMed
    2. b) Wang L. B., Karpova A., Gritsenko M. A., Kyle J. E., Cao S., Li Y., Rykunov D., Colaprico A., Rothstein J. H., Hong R., Stathias V., Cornwell M., Petralia F., Wu Y., Reva B., Krug K., Pugliese P., Kawaler E., Olsen L. K., Liang W. W., Song X., Dou Y., Wendl M. C., Caravan W., Liu W., Cui Zhou D., Ji J., Tsai C. F., Petyuk V. A., Moon J., et al., Cancer Cell 2021, 34, 509; - PMC - PubMed
    3. c) Cancer N., Nature 2008, 455, 1061. - PubMed
    1. a) Brooks C. L., Gu W., Protein Cell 2011, 2, 456; - PMC - PubMed
    2. b) Beckerman R., Prives C., Cold Spring Harb Perspect Biol 2010, 2, a000935. - PMC - PubMed

Publication types