. 2024 Mar;20(3):1725-1738.
doi: 10.1002/alz.13565. Epub 2023 Dec 13.

Predicting clinical progression trajectories of early Alzheimer's disease patients

Affiliations

Predicting clinical progression trajectories of early Alzheimer's disease patients

Viswanath Devanarayan et al. Alzheimers Dement. 2024 Mar.

Abstract

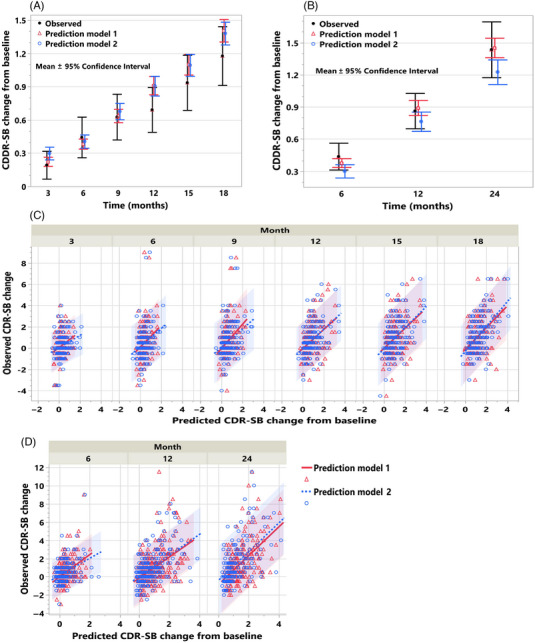
Background: Models for forecasting individual clinical progression trajectories in early Alzheimer's disease (AD) are needed for optimizing clinical studies and patient monitoring.

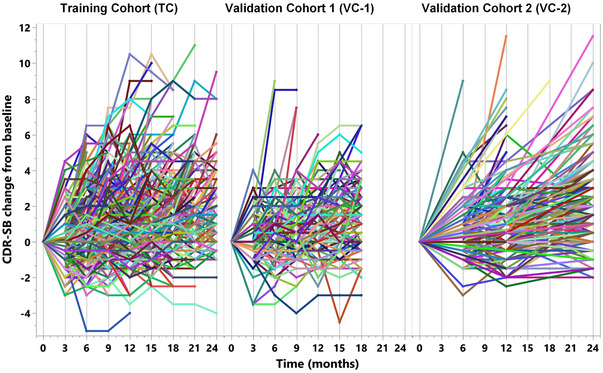
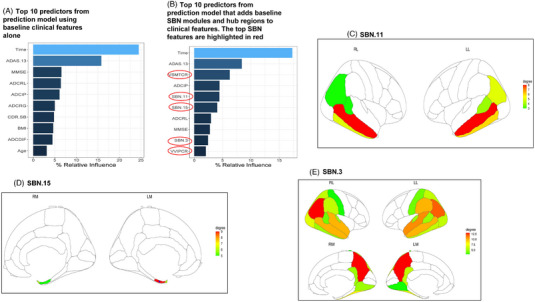
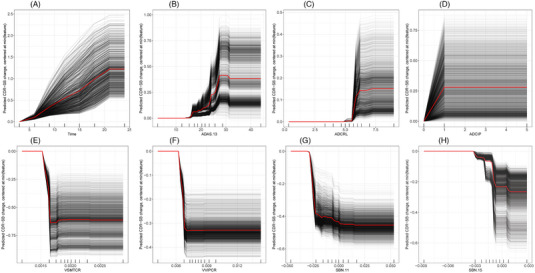
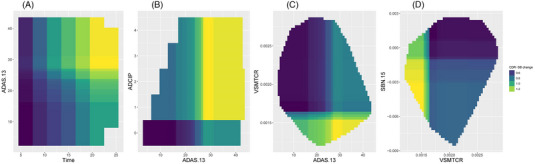
Methods: Prediction models were constructed using a clinical trial training cohort (TC; n = 934) via a gradient boosting algorithm and then evaluated in two validation cohorts (VC 1, n = 235; VC 2, n = 421). Model inputs included baseline clinical features (cognitive function assessments, APOE ε4 status, and demographics) and brain magnetic resonance imaging (MRI) measures.

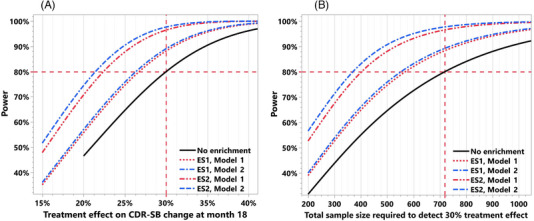
Results: The model using clinical features achieved R2 of 0.21 and 0.31 for predicting 2-year cognitive decline in VC 1 and VC 2, respectively. Adding MRI features improved the R2 to 0.29 in VC 1, which employed the same preprocessing pipeline as the TC. Utilizing these model-based predictions for clinical trial enrichment reduced the required sample size by 20% to 49%.

Discussion: Our validated prediction models enable baseline prediction of clinical progression trajectories in early AD, benefiting clinical trial enrichment and various applications.

Trial registration: ClinicalTrials.gov NCT02956486 NCT03036280 NCT01767311.

Keywords: clinical trial enrichment; disease progression; machine learning; mild cognitive impairment; prognosis.


Conflict of interest statement

V.D., Y.Y., A.C., E.A., P.S., L.Z., H.H., L.K., S.D., and MI are employees of Eisai Inc. HH is also the Senior Associate Editor for the journal Alzheimer's & Dementia. No competing disclosures to report for DAL and LT. Author disclosures are available in the supporting information.

Figures

FIGURE 1
FIGURE 1
Longitudinal cognitive trajectory. The longitudinal profiles of the change from baseline of CDR‐SB of 934, 235, and 421 subjects in the training and the two validation cohorts, respectively, reflect the considerable heterogeneity in progression over a typical 18‐ to 24‐month duration of AD clinical trials.
FIGURE 2
FIGURE 2
(A‐E) Top 10 predictors in prediction models and brain heatmaps of key SBN modules and hub regions. The relative influence of the top 10 predictors in the prediction model based on the baseline clinical features alone (A) and in the model that also includes MRI‐based SBN modules and hub regional measures (B) are shown here. The key baseline clinical predictors in these models include ADAS‐Cog‐13 (ADAS.13), Mini‐Mental State Examination (MMSE), word recall (ADCRL), ideational praxis (ADCIP), word recognition (ADCRG), CDR‐SB, and word‐finding difficulty (ADCDIF), along with demographic features, body mass index (BMI), and age. The key MRI‐based predictors include the SBN hub regional measures, middle temporal cortical area (VSMTCR), and inferior parietal cortical volume (VVIPCR), along with the SBN modules, SBN.11 (C) that includes the inferior parietal gyri, inferior temporal gyri, middle temporal gyri, and banks of the superior temporal sulci, SBN.15 (D) that includes the entorhinal cortices and temporal poles, and SBN.3 (E) that includes the superior parietal gyri, precunei, isthmus of the cingulate gyri, lateral occipital gyri, postcentral gyri, supramarginal gyri, superior temporal gyri, fusiform gyri, lingual gyri, transverse temporal gyri; the regions in SBN.11. RL, LL, RM, LM refer to right lateral, left lateral, right medial, and left medial, respectively. Degree refers to the number of spatially connected (correlated) neighboring regions.
FIGURE 3
FIGURE 3
(A‐H) Individual conditional expectation profiles of some key predictors. The nature of the relationship between some of the key baseline clinical and MRI‐based SBN predictors versus the predicted clinical decline (CDR‐SB change from baseline) is shown here for each subject (in black) and the average subject (in red) via these individual conditional expectations (ICE) profiles. The prediction profile of each subject was centered by subtracting from the predicted CDR‐SB change corresponding to the lowest value of the predictor. The intersubject heterogeneity in these ICE profiles is mostly due to the strong interaction between the predictors, which is evident in Figure 4. The SGBM algorithm accounts for these non‐linear relationships and interactions without prior assumptions on the distribution or mathematical forms of the relationships.
FIGURE 4
FIGURE 4
(A‐D) Interaction prediction profiles between some key predictors. These interaction prediction profiles reveal the strong dependence between some key predictors that were accounted for by the SGBM algorithm.
FIGURE 5
FIGURE 5
(A‐D) Prognostic prediction of average cognitive decline and cognitive decline of individual subjects in the two validation cohorts. Mean and 95% confidence interval of the observed and predicted CDR‐SB change from baseline using the models based on the baseline clinical features (model 1) alone and with the addition of MRI‐based SBN features (model 2) are shown in (A) for validation cohort (VC) 1 and in (B) for VC 2. The observed versus predicted CDR‐SB change from baseline for individual subjects at each time point from models 1 and 2 along with the 95% prediction intervals are shown for VC 1 in (C) and VC 2 in (D).
FIGURE 6
FIGURE 6
(A and B) Application of prognostic prediction of longitudinal cognitive decline for clinical trial enrichment. The impact on the sample size reduction and power increase is shown here when enriching the clinical trial for subjects with predicted 18‐month CDR‐SB change of at least 0.5 and 1. 500 clinical trial simulations based on the placebo arm data from a clinical trial (validation cohort 1) were used to study the impact of this enrichment. In panel (A), when using the predictions from the model based on baseline clinical features alone for enrichment (model 1), the power increases from 80% to 88.3% and 96.5%, respectively, for the two enrichment scenarios (ES1, ES2). Fixing the power at 80%, these enrichment scenarios with model 1 improve the ability to detect the treatment effect from 30% to 26.7% and 22.3%, respectively.​ In panel (B), the total sample size required to detect a 30% treatment effect reduces from 718 to 568 and 398 (20.9% and 44.6% reduction), respectively, for the two enrichment scenarios with model 1. Modest improvement in these numbers is seen when using the model based on both the baseline clinical features and the MRI‐based SBN features (model 2) for enrichment; for the two enrichment scenarios the power increases from 80% to 89.2% and 97.6%, respectively, and the minimum treatment effect that can be detected with 80% power improves from 30% to 26.3% and 21.3% (Figure 6A). The total sample size required to detect a 30% treatment effect reduces from 718 to 552 and 364 (23.2% and 49.4% reduction), respectively, for the two ESs using model 2 predictions.

References

    1. Mills EA, Begay JA, Fisher C, Mao‐Draayer Y. Impact of trial design and patient heterogeneity on the identification of clinically effective therapies for progressive MS. Mult Scler. 2018;24:1795‐1807. - PMC - PubMed
    1. van Eijk RPA, Nikolakopoulos S, Roes KCB, et al. Innovating clinical trials for amyotrophic lateral sclerosis: challenging the established order. Neurology. 2021;97:528‐536. - PMC - PubMed
    1. Catenacci DV. Next‐generation clinical trials: novel strategies to address the challenge of tumor molecular heterogeneity. Mol Oncol. 2015;9:967‐996. - PMC - PubMed
    1. Duara R, Barker W. Heterogeneity in Alzheimer's disease diagnosis and progression rates: implications for therapeutic trials. Neurotherapeutics. 2022;19:8‐25. - PMC - PubMed
    1. Manton KG, Vertrees JC, Woodbury MA. Functionally and medically defined subgroups of nursing home populations. Health Care Financ Rev. 1990;12:47‐62. - PMC - PubMed

Publication types

Associated data