. 2024 Feb;11(5):e2304084.
doi: 10.1002/advs.202304084. Epub 2023 Dec 13.

Deciphering Immune Landscape Remodeling Unravels the Underlying Mechanism for Synchronized Muscle and Bone Aging

Affiliations

Deciphering Immune Landscape Remodeling Unravels the Underlying Mechanism for Synchronized Muscle and Bone Aging

Pengbin Yin et al. Adv Sci (Weinh). 2024 Feb.

Abstract

Evidence from numerous studies has revealed the synchronous progression of aging in bone and muscle; however, little is known about the underlying mechanisms. To this end, human muscles and bones are harvested and the aging-associated transcriptional dynamics of two tissues in parallel using single-cell RNA sequencing are surveyed. A subset of lipid-associated macrophages (triggering receptor expressed on myeloid cells 2, TREM2+ Macs) is identified in both aged muscle and bone. Genes responsible for muscle dystrophy and bone loss, such as secreted phosphoprotein 1 (SPP1), are also highly expressed in TREM2+ Macs, suggesting its conserved role in aging-related features. A common transition toward pro-inflammatory phenotypes in aged CD4+ T cells across tissues is also observed, activated by the nuclear factor kappa B subunit 1 (NFKB1). CD4+ T cells in aged muscle experience Th1-like differentiation, whereas, in bone, a skewing toward Th17 cells is observed. Furthermore, these results highlight that degenerated myocytes produce BAG6-containing exosomes that can communicate with Th17 cells in the bone through its receptor natural cytotoxicity triggering receptor 3 (NCR3). This communication upregulates CD6 expression in Th17 cells, which then interact with TREM2+ Macs through CD6-ALCAM signaling, ultimately stimulating the transcription of SPP1 in TREM2+ Macs. The negative correlation between serum exosomal BCL2-associated athanogene 6 (BAG6) levels and bone mineral density further supports its role in mediating muscle and bone synchronization with aging.

Keywords: aging; bone loss; muscle loss; sarcopenia; single cell analysis.


Conflict of interest statement

The authors declare no conflict of interest.

Figures
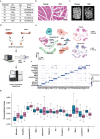
Figure 1
Figure 1
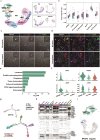
Study design and the cellular landscape of the aging human musculoskeletal system. a) The baseline information of enrolled patients is shown. b) Representative H&E staining images showing a cross‐section view of myofibers from young and older individuals. c) Representative micro‐CT reconstruction images showing the trabecular bones from young and older individuals. d) Schematic representation of our workflow; for enrolled patients, both bone and muscle were dissected. Cells from bone and muscle tissues were isolated, purified, and generated as a single‐cell library separately. e) Cell clustering projected by UMAP plots showing major cell types in musculoskeletal tissues detected by scRNA‐seq; colored by tissue (top) and age distribution (bottom). EC: endothelial cells, FB: fibroblasts. SMC: smooth muscle cells, MSC: mesenchymal stem cells. f) Dot plot showing signature gene expression in each cell type. Circle size indicates the cell fraction expressing the signature gene, and color indicates the gene expression level. g) Transcriptional noise comparison of major cell types between young and old individuals. Blue: young individuals. Red: old individuals.
Figure 2
Figure 2
Cellular diversity of myeloid cells in human musculoskeletal tissues. a) UMAP plots of myeloid cell subsets, colored by tissue (bottom) and age distribution (up). b) Transcriptional noise comparison of myeloid cell subsets between young and old individuals. Blue: young individuals. Red: old individuals. M_ = Muscle_; B_ = Bone_. c,d) Representative images of immunofluorescent staining for TREM2+ macrophages (Macs) in both muscle and bone from young and aged individuals. e) KEGG enrichment of highly expressed genes in TREM2 + Macs. f) Violin plots of expression levels of representative genes enriched in the GO terms, namely tissue homeostasis in (e). g) Pseudo‐time analysis by Monocle estimating macrophage development in musculoskeletal tissues and pinpointing that NR1H3 may play a distinct role in the development of TREM2 + Macs. h) SCENIC analysis indicated the regulon of NR1H3 was switched on in TREM2 + Macs.Black bars suggested that TF regulon was active in the corresponding cell subsets. i) Transcription factor (TF) in myeloid subsets.
Figure 3
Figure 3
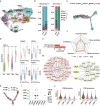
Lymphoid subset reprogramming in aged human musculoskeletal tissues. a) UMAP plots of T and NK cells identified in bone and muscle. b) The proportion of CD4+ T cell subsets across age groups, according to tissue type. c) Trajectory inference of CD4+ T cells assessed by Monocle. d) Differentiation trajectories of CD4+ T cells by URD showing naïve CD4+ T cells gave rise to Th1, Th2, Th17, and Treg. The right panel displays the expression of classic transcription factors on each developmental tree. e) GO enrichment for highly expressed genes in Th17. f) The functional enrichment of highly expressed genes in Th1, Th2, Th17, and Treg, visualized by a Radar plot. g) Gene regulatory network inferring NFKB1 targets in Th1 and Th17, respectively. h) Trajectory analysis of CD8+ T subsets highlighted that virtual memory CD8+ T cells were significantly distinct from effector CD8+ T cells. i) Dot plot showing differential gene expression across CD8+ T subsets. Circle size indicates the cell fraction expressing the signature gene, and color indicates the gene expression level. j) Exhaustion score and senescence score comparison among CD8+ T subsets.
Figure 4
Figure 4
Sub‐clustering analysis of myocytes in aging human muscle. a) UMAP plots showing the diversity of myocyte subsets. b) The functional score of aging‐related terms in fast and slow myocytes between young and old individuals. _O is for _Old; _Y is for _Young. Fast_ is for Fast myocytes; Slow_ is for Slow myocytes. c) The pseudo‐trajectory analysis identified five distinct States in myocytes. d) Violin plot for the expression of muscle‐specific aging hallmark genes (TRIM63 and FBXO32) across the five States. e) GO enrichment of highly expressed genes in State 4 and State 5. f) Pearson's correlation analysis between interleukin‐18 (IL‐18) levels in human serum and grip strength (n = 90). g) Comparison of State composition in each subset. h) Overall expression comparison of five mitochondrial respiratory chain complexes in Slow C2 and MYL12Ahi Slow in old individuals. i) Detailed illustration of energy metabolism difference in Slow C2 and MYL12Ahi Slow. The red arrow indicates genes upregulated in the MYL12Ahi cluster, and the grey arrow infers genes upregulated in Slow C2. j,k) Representative Fluorescence in situ hybridization (FISH) images by RNAscope and quantification for LDHA (green) and LDHB (red) expression in young and aged human muscle (n = 3). The significance (p‐value) was calculated using Pearson's correlation analysis (f) and the Mann–Whitney t‐test (k); * p < 0.05; ** p < 0.01; *** p < 0.001.
Figure 5
Figure 5
Cellular communication among different cell subsets in human bone and muscle tissues. a) Incoming and outgoing interaction strength of different cell subsets in old individuals. b) Autocrine and paracrine counts of selected cell subsets in old (top) and young (bottom) individuals. c) Cellular communication signaling variation in different cell subsets between old and young individuals. d,e) Circos plot showing the expression of ligand‐receptor pairs BAG3‐NCR3 and CD6‐ALCAM. f) Characterization of exosomes by TEM harvested from the blood plasma of young and old individuals. M for _Muscle, _B for _Bone. g) BAG6 expression in exosomes from human participants in either young or aged groups was determined by enzyme‐linked immunosorbent assay (ELISA)(n = 24). h) Representative immunofluorescent images showing the uptake of exosomes by Th cells. Exosomes were labeled by PKH26 and incubated with Th cells for 12 h. i) Intracellular CD6 expression of T cells after incubation with BAG6‐shuttled exosomes compared to PBS controls, as tested by qPCR (n = 3 independent experiments). j) Expression level of SPP1 in the conditioned medium of macrophages and Th17 cells co‐culture system, determined by ELSIA. The conditioned medium contained the same quantity of either BAG6hi exosomes (BAG6hi Exos) or BAG6low exosomes (BAG6low Exos), or the same volume of PBS. k) Schematic representation of predicted cell‐cell interactions across aged muscle and bone. Degenerated muscle secretes exosomes containing BAG6, the latter of which travel through blood vessels and promote the interaction between Th17 cells and TREM2+ Macs in bone. The TREM2+ Macs potentially facilitate the differentiation of osteoclasts and bone resorption. The significance (p‐value) was calculated using the Mann–Whitney t‐test (g and i) and the one‐way ANOVA test (j); * p < 0.05; ** p < 0.01; *** p < 0.001.

References

    1. Kirk B., Zanker J., Duque G., J. Cachexia Sarcopenia Muscle 2020, 11, 609. - PMC - PubMed
    1. Compston J. E., Mcclung M. R., Leslie W. D., Lancet 2019, 393, 364. - PubMed
    1. Cruz‐Jentoft A. J., Sayer A. A., Lancet 2019, 393, 2636. - PubMed
    1. Reid I. R., Billington E. O., Lancet 2022, 399, 1080. - PubMed
    1. Brotto M., Bonewald L., Bone 2015, 80, 109. - PMC - PubMed

Publication types

LinkOut - more resources