. 2024 Jan 23;98(1):e0135123.
doi: 10.1128/jvi.01351-23. Epub 2023 Dec 13.

High fusion and cytopathy of SARS-CoV-2 variant B.1.640.1

Affiliations

High fusion and cytopathy of SARS-CoV-2 variant B.1.640.1

William Bolland et al. J Virol. .

Abstract

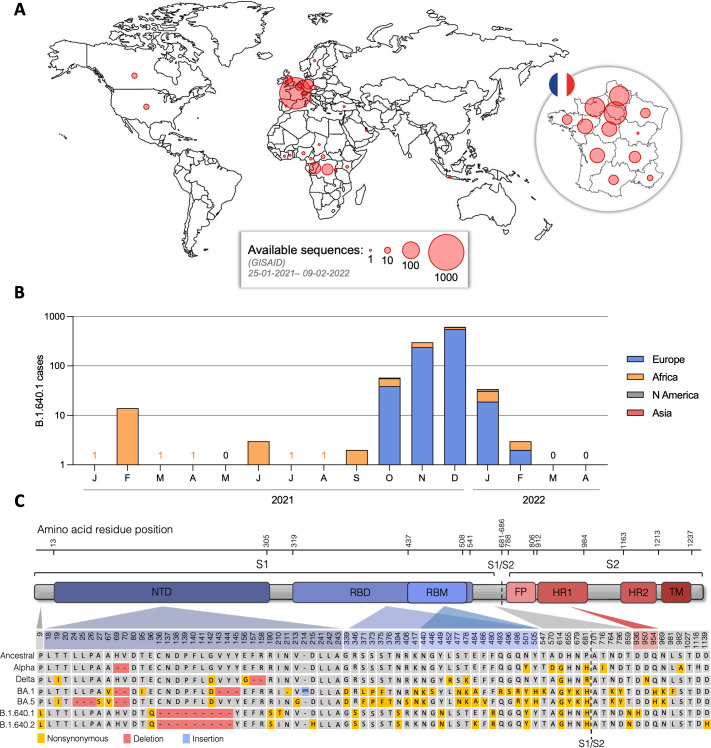
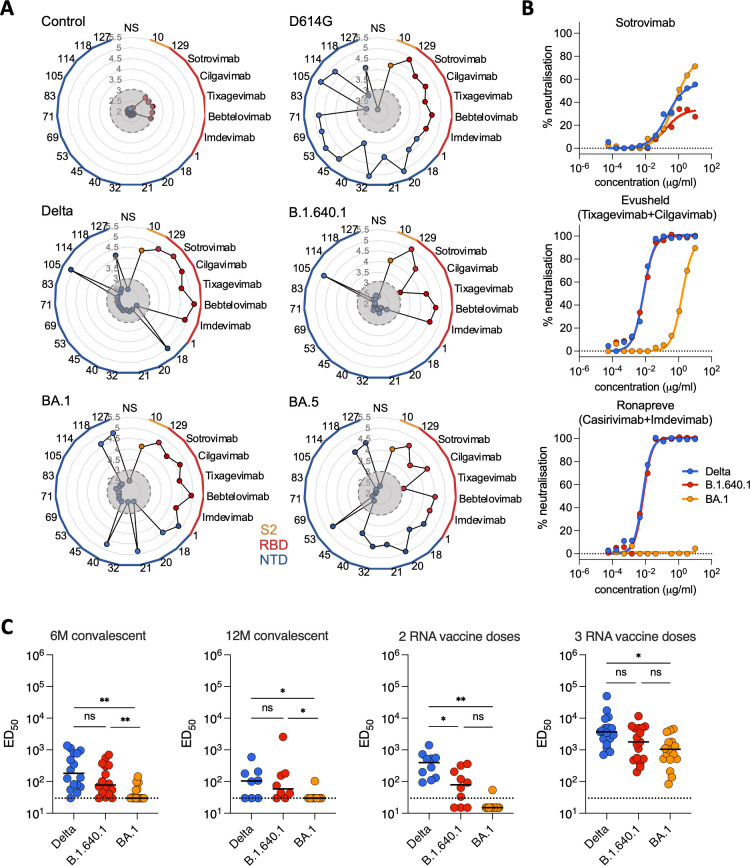
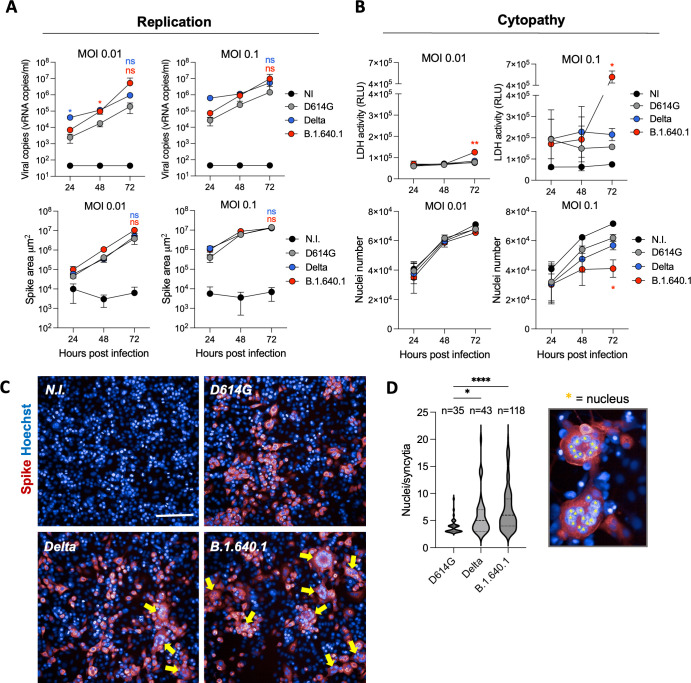
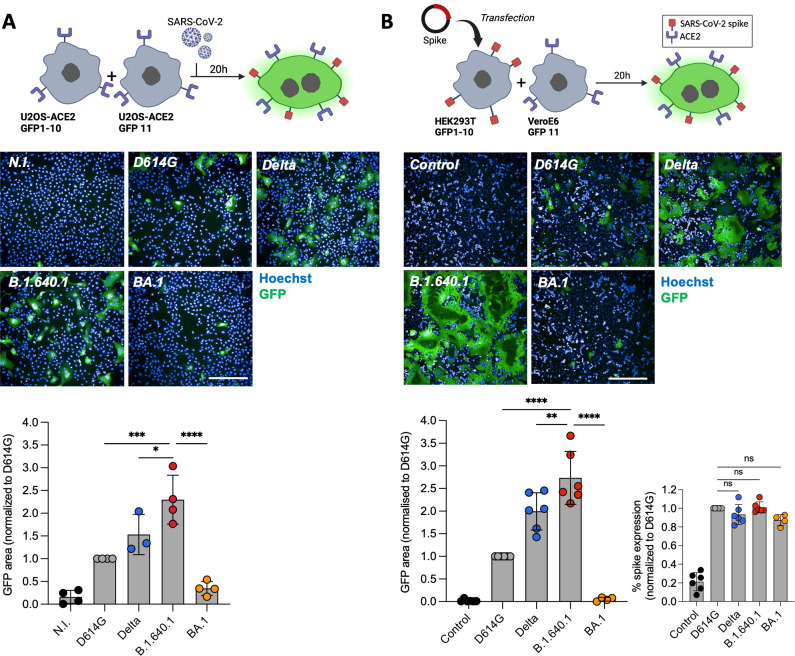
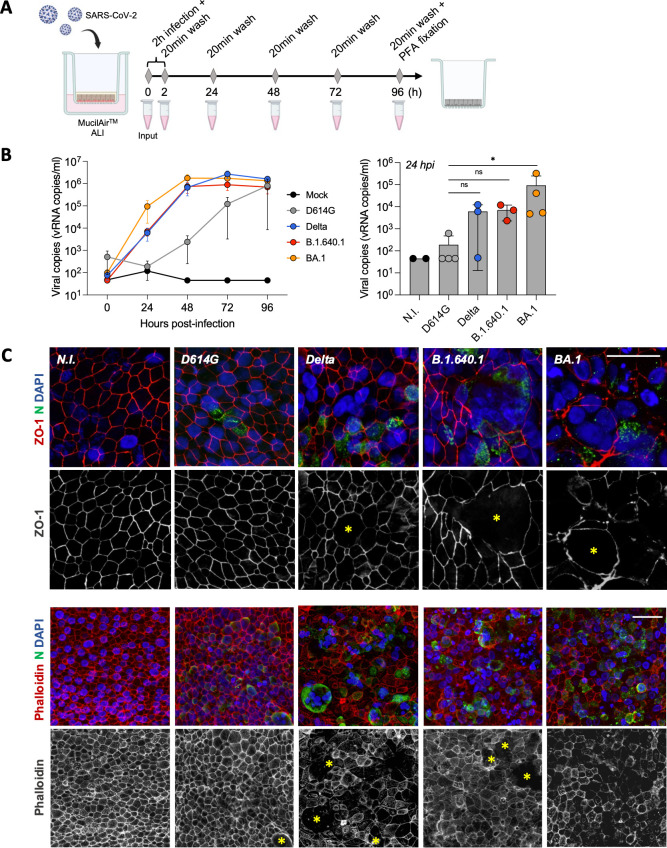
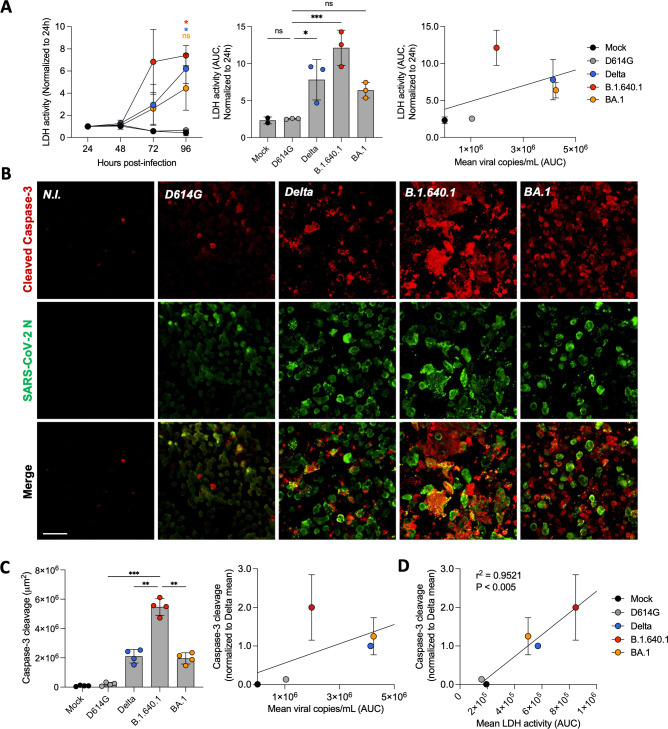
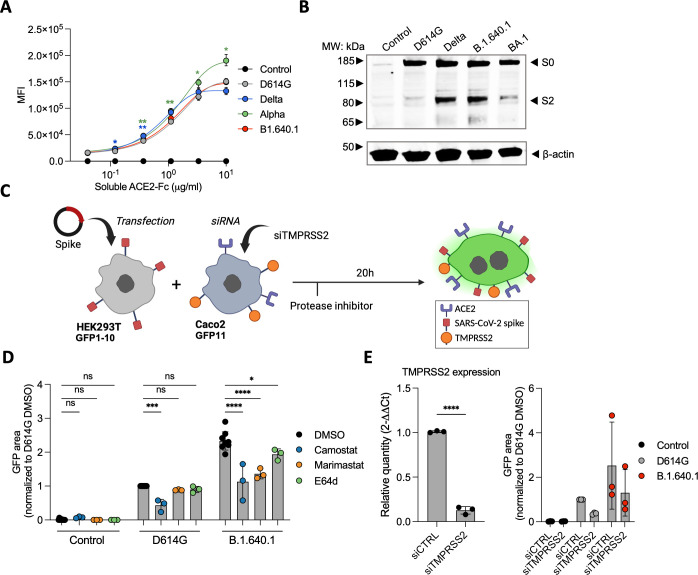
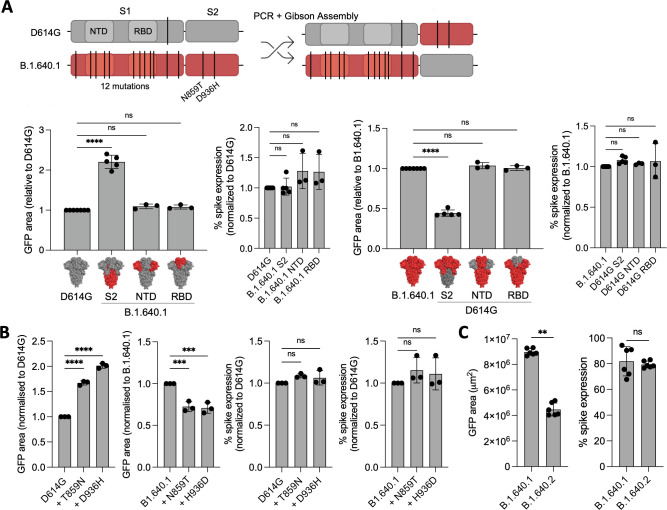
SARS-CoV-2 variants with undetermined properties have emerged intermittently throughout the COVID-19 pandemic. Some variants possess unique phenotypes and mutations which allow further characterization of viral evolution and Spike functions. Around 1,100 cases of the B.1.640.1 variant were reported in Africa and Europe between 2021 and 2022, before the expansion of Omicron. Here, we analyzed the biological properties of a B.1.640.1 isolate and its Spike. Compared to the ancestral Spike, B.1.640.1 carried 14 amino acid substitutions and deletions. B.1.640.1 escaped binding by some anti-N-terminal domain and anti-receptor-binding domain monoclonal antibodies, and neutralization by sera from convalescent and vaccinated individuals. In cell lines, infection generated large syncytia and a high cytopathic effect. In primary airway cells, B.1.640.1 replicated less than Omicron BA.1 and triggered more syncytia and cell death than other variants. The B.1.640.1 Spike was highly fusogenic when expressed alone. This was mediated by two poorly characterized and infrequent mutations located in the Spike S2 domain, T859N and D936H. Altogether, our results highlight the cytopathy of a hyper-fusogenic SARS-CoV-2 variant, supplanted upon the emergence of Omicron BA.1. (This study has been registered at ClinicalTrials.gov under registration no. NCT04750720.)IMPORTANCEOur results highlight the plasticity of SARS-CoV-2 Spike to generate highly fusogenic and cytopathic strains with the causative mutations being uncharacterized in previous variants. We describe mechanisms regulating the formation of syncytia and the subsequent consequences in a primary culture model, which are poorly understood.

Keywords: SARS-CoV-2; cytopathy; fusion; hNECs; syncytia.


Conflict of interest statement

The authors declare no conflict of interest.

Figures

Fig 1
Fig 1
Epidemiology and Spike mutations of SARS-CoV-2 B.1.640.1. (A) Total number of B.1.640.1 variant cases by country as displayed by red circles. Also shown is total case number of B.1.640.1 variant by region of France. Data on sample number and location were obtained from GISAID EpiCoV database. Total case number = 1,107. (B) Total case number of B.1.640.1 variant per month during its circulation between January 2021 and April 2022. Data are grouped by continent. Data on sample collection date and sample location were obtained from GISAID EpiCoV database. (C) Schematic view of B.1.640.1 and B.1.640.2 Spike sequences and their respective amino acid mutations compared to the ancestral Wuhan Spike sequence (NC_045512.2) and Alpha, Delta, BA1, and BA5 variants.
Fig 2
Fig 2
Binding and neutralization of B.1.640.1 by monoclonal antibodies and sera from convalescent and vaccinated individuals. (A) Radial plots showing binding of a panel of mAbs that target the S2, RBD, and NTD of Spike, as depicted by color. HEK293T cells were transfected with Spike or control plasmids 24 hours before staining with mAbs. Binding is quantified by mean fluorescence intensity (MFI) of each mAb, with the y-axis showing log10(MFI). Gray circles indicate the limit of detection [MFI = log10 (3)]. N = 3. (B) Neutralization activity of therapeutic mAbs. Dose-response analysis of the neutralization of Delta, B.1.640.1, and BA.1 virus by sotrovimab and the combinations of tixagevimab + cilgavimab and casirivimab + imdevimab. Data points are a mean of two independent repeated experiments. (C) Neutralization activity of sera from convalescent individuals, 6 and 12 months after infection, and 1 month post second and third Pfizer RNA vaccine doses. Dotted line represents the limit of detection (ED50 = 30). Solid black bars represent median values. Data points are a mean of two independent repeated experiments. Mann-Whitney tests were performed to compare the respective variants, *P < 0.05, **P < 0.001, ns = not significant.
Fig 3
Fig 3
Cytopathic effects of B.1.640.1 infection on A549-ACE2 cells. (A) (Top) Replication kinetics of D614G, Delta, and B.1.640.1 in A549-ACE2 cells shown by quantification of the viral E protein gene in the cell supernatant by RT-qPCR at the respective timepoints. (Bottom) Area of Spike-positive A549-ACE2-infected cells from respective variants over 72 hours. Cells were stained with anti-Spike mAb (mAb102) before staining with an Alexa-Fluor 647 conjugated secondary to allow quantification of infection. N = 4. (B) (Top) Quantification of LDH release in A549-ACE2-infected cell supernatant through a luciferase-based assay. N = 4. (Bottom) Nuclei count following infection of A549-ACE2 cells at the indicated timepoints with the respective variants. Nuclei were stained with Hoechst dye prior to quantification. (C) Confocal immunofluorescence of A549-ACE2 cells infected with MOI 0.1 D614G, Delta, and B.1.640.1 cells and control cells 48 hpi. Yellow arrows indicate the presence of syncytia. Scale bar = 200 µm. (D) Violin plot of number of nuclei per syncytia 48 hpi with D614G, Delta, and B.1.640.1 infection (MOI = 0.1). Results were taken from two independent experiments, with 12 fields analyzed per variant. Nuclei counting was performed manually using ImageJ software. Ordinary one-way ANOVA tests were performed with Tukey’s multiple comparison test to compare D614G to respective variants, *P < 0.05, ****P < 0.00001, ns = not significant. For A and B, two-way ANOVA tests were performed with Geisser-Greenhouse correction to compare Delta and B.1.640.1 to D614G, *P < 0.05. Error bars represent SD.
Fig 4
Fig 4
B.1.640.1 virus and Spike display high fusogenicity in cell lines. (A) (Top) Schematic of S-fuse assay utilizing U2OS S-fuse GFP-split cells to quantify viral fusion following infection (MOI = 0.01). (Middle) Confocal microscopy images of cells infected with respective variants at MOI 0.01. Hoechst dye stains the nuclei. (Bottom) Quantification of GFP area was performed 20 hpi, and data are normalized to D614G fusion. (B) (Top) Schematic of HEK293T-GFP1-10 and VeroE6-GFP11 co-culture system. HEK293T-GFP1-10 cells were transfected with Spike or control plasmids before co-culture with VeroE6-GFP11 cells. (Middle) Confocal microscopy images of co-cultured cells 20 hpi. Hoechst dye stains the nuclei. (Bottom) Quantification of GFP area 20 hours post-transfection and surface Spike expression by staining of HEK293T-GFP1-10 cells with an anti-S2 mAb. For A and B, ordinary one-way ANOVA tests were performed with Tukey’s multiple comparison test to compare D614G to respective variants, *P < 0.05, **P < 0.001, ***P < 0.0001, ****P < 0.00001, ns = not significant. Error bars represent SD. Scale bars = 400 µm.
Fig 5
Fig 5
Apical replication and syncytia formation in hNEC air-liquid interface culture. (A) Schematic of hNEC ALI culture infection with SARS-CoV-2 variants over 96 hours followed by cell fixation. (B) Viral RNA release from apical side of hNECs as measured by RT-qPCR targeting the SARS-CoV-2 E gene (n = 3/4; left). Apical viral RNA release measured at 24 hpi; bars represent mean values (right). Dotted lines and error bars represent SD. Mann-Whitney tests were performed to compare the respective variants to D614G, *P < 0.05. (C) Confocal immunofluorescence of hNECs 96 hpi with respective variants displaying syncytia formation (yellow asterisks) through ZO-1, phalloidin, SARS-CoV-2 nucleoprotein, and DAPI staining. Upper scale bar = 20 µm. Lower scale bar = 40 µm.
Fig 6
Fig 6
Cytopathic effects of hNEC infection with B.1.640.1. (A) LDH release from apical side of hNEC ALI culture over the time course of infection with respective SARS-CoV-2 variants (n = 3/4; left). Area under the curve (AUC) representation of LDH activity, bars represent mean values (middle). Linear regression analysis of LDH release (AUC) compared to viral copies/mL (AUC) from 96 hours of infection with respective SARS-CoV-2 variants (right). Asterisk colours represent respective variants. (B) Immunofluorescence of hNECs stained for cleavage products of caspase-3 and SARS-CoV-2 nucleoprotein. Shown is one field of each variant. Scale bar = 40 µm. (C) Quantification of total area of cleavage products of caspase-3. Each data point represents one randomly assigned field from a single biological repeat (left). An ordinary one-way ANOVA test was performed with Tukey’s multiple comparison test to compare D614G to respective variants, *P < 0.05, ***P < 0.0001, ns = not significant. Linear regression analysis of caspase-3 cleavage from two biological repeats (total number of fields = 8) normalized to Delta compared to mean viral copies/mL (AUC) 96 hpi (right). (D) Linear regression analysis of caspase-3 cleavage normalized to Delta compared to LDH activity (AUC) over 96 hours of infection. Error bars represent SD.
Fig 7
Fig 7
The impact of host cell proteases on B.1.640.1 Spike fusion. (A) Staining of HEK293T cells transfected with Spike or control plasmids and stained with a serial dilution of soluble human ACE2-Fc followed by staining with anti-human-Fc secondary antibody. A two-way ANOVA test was performed with Geisser-Greenhouse correction to compare D614G to the respective variants, *P < 0.05, **P < 0.001. (B) S1/S2 cleavage of respective variant Spike proteins measured by western blot. HEK293T cells transfected with respective Spikes or control plasmids and cell lysates were analyzed 24 hours later (n = 2). (C) Schematic of HEK293T-GFP1-10 cells transfected with D614G Spike, B.1.640.1 Spike, or control plasmids and co-cultured with Caco-2-GFP11 in the presence of protease inhibitors. (D) Fusion of D614G and B.1.640.1 Spikes, quantified by GFP area, in the presence 10 mM camostat, marimastat, E64d, or a DMSO control. (E) (Left) Total RNA was extracted from Caco2 cells treated with TMPRSS2 siRNA or siCTRL, and RT-qPCR was performed. Data were normalized to β-Tubulin levels. Relative mRNA expression normalized to siCtrl condition (2−ΔΔCT) was plotted. (Right) Fusion of D614G and B.1.640.1, quantified by GFP, in the presence of TMPRSS2 knockdown or wild-type Caco-2 cells. For (D) and (E), ordinary one-way ANOVA tests were performed with Tukey’s multiple comparison test to compare D614G to respective variants, *P < 0.05, ***P < 0.0001, ****P < 0.00001. Error bars represent SD.
Fig 8
Fig 8
B.1.640.1 Spike S2 mutations increase fusogenicity. (A) (Top) Schematic of D614G and B.1.640.1 chimeric Spike production through Gibson’s assembly. The NTD, RBD, and S2 domains of both Spikes were swapped to generate chimeric Spikes. For simplicity, only S1/S2 chimeras are shown. (Bottom) Fusion of D614G and B.1.640.1 Spike chimeras in HEK293T-GFP1-10 and VeroE6-GFP11 co-culture system. HEK293T-GFP1-10 cells were transfected with Spikes or control plasmids and then co-cultured with VeroE6-GFP11. Fusion was quantified by GFP area 18 hours post-transfection. Spike expression was assessed by surface staining of transfected HEK293T-GFP1-10 cells with an anti-S2 mAb. (B) D614G and B.1.640.1 Spikes were mutated to incorporate or revert B.1.640.1 S2-specific mutations, respectively. HEK293T-GFP1-10 cells were transfected with Spikes or control plasmids before co-culture with VeroE6-GFP11 cells. Fusion was assessed by GFP area 18 hours post-transfection. Spike expression was assessed by surface staining of transfected HEK293T-GFP1-10 cells with an anti-S2 mAb. (C) HEK293T-GFP1-10 cells were transfected with B.1.640.1 or B.1.640.2 Spikes or control plasmids before co-culture with VeroE6-GFP11 cells. Fusion was assessed by GFP area 18 hours post-transfection. Spike expression was assessed by surface staining of transfected HEK293T-GFP1-10 cells with an anti-S2 mAb. Mann-Whitney tests were performed to compare GFP area and spike expression, **P < 0.001. For (A) and (B), ordinary one-way ANOVA tests were performed with Tukey’s multiple comparison test to compare respective variants, **P < 0.001, ***P < 0.0001, ****P < 0.00001, ns = not significant. Error bars represent SD.

References

    1. El-Shabasy RM, Nayel MA, Taher MM, Abdelmonem R, Shoueir KR, Kenawy ER. 2022. Three waves changes, new variant strains, and vaccination effect against COVID-19 pandemic. Int J Biol Macromol 204:161–168. doi:10.1016/j.ijbiomac.2022.01.118 - DOI - PMC - PubMed
    1. Harvey WT, Carabelli AM, Jackson B, Gupta RK, Thomson EC, Harrison EM, Ludden C, Reeve R, Rambaut A, COVID-19 Genomics UK (COG-UK) Consortium, Peacock SJ, Robertson DL. 2021. SARS-CoV-2 variants, spike mutations and immune escape. Nat Rev Microbiol 19:409–424. doi:10.1038/s41579-021-00573-0 - DOI - PMC - PubMed
    1. Planas D, Bruel T, Staropoli I, Guivel-Benhassine F, Porrot F, Maes P, Grzelak L, Prot M, Mougari S, Planchais C, Puech J, Saliba M, Sahraoui R, Fémy F, Morel N, Dufloo J, Sanjuán R, Mouquet H, André E, Hocqueloux L, Simon-Loriere E, Veyer D, Prazuck T, Péré H, Schwartz O. 2023. Resistance of Omicron subvariants BA.2.75.2, BA.4.6, and BQ.1.1 to neutralizing antibodies. Nat Commun 14:824. doi:10.1038/s41467-023-36561-6 - DOI - PMC - PubMed
    1. Bruel T, Stéfic K, Nguyen Y, Toniutti D, Staropoli I, Porrot F, Guivel-Benhassine F, Bolland WH, Planas D, Hadjadj J, Handala L, Planchais C, Prot M, Simon-Lorière E, André E, Baele G, Cuypers L, Mouthon L, Mouquet H, Buchrieser J, Sève A, Prazuck T, Maes P, Terrier B, Hocqueloux L, Schwartz O. 2022. Longitudinal analysis of serum neutralization of SARS-CoV-2 Omicron BA.2, BA.4, and BA.5 in patients receiving monoclonal antibodies. Cell Rep Med 3:100850. doi:10.1016/j.xcrm.2022.100850 - DOI - PMC - PubMed
    1. Willett BJ, Grove J, MacLean OA, Wilkie C, De Lorenzo G, Furnon W, Cantoni D, Scott S, Logan N, Ashraf S, et al. , PITCH Consortium, COVID-19 Genomics UK (COG-UK) Consortium . 2022. SARS-CoV-2 Omicron is an immune escape variant with an altered cell entry pathway. Nat Microbiol 7:1161–1179. doi:10.1038/s41564-022-01241-6 - DOI - PMC - PubMed

Publication types

Substances

Supplementary concepts

Associated data