. 2024 Feb 1;35(2):ar23.
doi: 10.1091/mbc.E23-09-0370. Epub 2023 Dec 13.

MARCKS and PI(4,5)P2 reciprocally regulate actin-based dendritic spine morphology

Affiliations

MARCKS and PI(4,5)P2 reciprocally regulate actin-based dendritic spine morphology

Barbara Calabrese et al. Mol Biol Cell. .

Abstract

Myristoylated, alanine-rich C-kinase substrate (MARCKS) is an F-actin and phospholipid binding protein implicated in numerous cellular activities, including the regulation of morphology in neuronal dendrites and dendritic spines. MARCKS contains a lysine-rich effector domain that mediates its binding to plasma membrane phosphatidylinositol-4,5-biphosphate (PI(4,5)P2) in a manner controlled by PKC and calcium/calmodulin. In neurons, manipulations of MARCKS concentration and membrane targeting strongly affect the numbers, shapes, and F-actin properties of dendritic spines, but the mechanisms remain unclear. Here, we tested the hypothesis that the effects of MARCKS on dendritic spine morphology are due to its capacity to regulate the availability of plasma membrane PI(4,5)P2. We observed that the concentration of free PI(4,5)P2 on the dendritic plasma membrane was inversely proportional to the concentration of MARCKS. Endogenous PI(4,5)P2 levels were increased or decreased, respectively, by acutely overexpressing either phosphatidylinositol-4-phosphate 5-kinase (PIP5K) or inositol polyphosphate 5-phosphatase (5ptase). PIP5K, like MARCKS depletion, induced severe spine shrinkage; 5ptase, like constitutively membrane-bound MARCKS, induced aberrant spine elongation. These phenotypes involved changes in actin properties driven by the F-actin severing protein cofilin. Collectively, these findings support a model in which neuronal activity regulates actin-dependent spine morphology through antagonistic interactions of MARCKS and PI(4,5)P2.


Figures
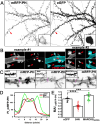
FIGURE 1:
FIGURE 1:
PI(4,5)P2 localization in dissociated hippocampal neurons is redistributed in response to MARCKS. (A) Representative neuron coexpressing soluble eGFP with the PI(4,5)P2 reporter mRFP- mRFP-PHPLCδ1 (here shortened to “mRFP-PH,”) which is largely enriched at the plasma membrane (see inset: cell body) and present in the majority of dendritic spines (red arrow). Scale bar, 10 µm. (B) Two representative examples of dendritic spines coexpressing mRFP-PH and PSD95-GFP. Most of the mRFP-PH enriched areas partially overlap with PSD-95 clusters (red arrows). Scale bars (for both examples): 2 µm. (C) Hippocampal dendritic regions of neurons coexpressing mRFP-PH with either eGFP, eGFP-S4N-MARCKS, or MARCKS shRNA (see insets). All image widths = 14 µm. (D) Fluorescence intensity (FI) of the mRFP-PH probe relative to the representative purple line scan across the dendrites shown in (C). (E) “Membrane association index” (MAI) for mRFP-PH in neurons expressing either eGFP, S4N-MARCKS or MARCKS shRNA (see Materials and Methods on how MAI was calculated). Data are expressed as mean ± SEM; *** p < 0.001, **** p < 0.0001 for representative comparisons. The full set of comparisons, test selection, and statistical data are provided in Supplemental Table S1.
FIGURE 2:
FIGURE 2:
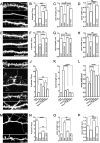
Increased PI(4,5)P2 levels (PIP5K or MARCKS KD) lead to spine shrinkage, while decreased PI(4,5)P2 levels lead to spine elongation. (A) Representative dendritic regions coexpressing mcherry with either eGFP, MARCKS shRNA or PIP5K. (B) Representative dendritic regions of neurons expressing S4N-MARCKS with or without PIP5K. (C) Representative dendritic regions coexpressing mcherry with either eGFP, S4N-MARCKS or 5ptase. (D) Representative dendritic regions expressing MARCKS shRNA with or without 5ptase. All image widths = 32 µm. (E–G) Dendritic spine density, length and width for all conditions (A–D) are expressed as mean ± SEM. See Supplemental Table S1 for complete statistical information. For selected comparisons referenced in the main text: **** p < 0.0001, ***p = 0.006, ns = not significant.
FIGURE 3:
FIGURE 3:
Neither myrAKT nor IP3K reproduce the PIP5K-induced spine loss and shrinkage. (A) Representative dendritic regions of neurons expressing either eGFP or myrAKT or PIP5K together with mcherry. Image width, 32 µm. (B–D) Spine density, length and width are expressed as mean ± SEM. See Supplemental Table S1 for complete statistical information. **** p < 0.0001. (E) Representative dendritic regions of neurons expressing either eGFP, IP3K, PIP5K, or PIP5K plus IP3K. Image width = 32 µm. (F–H) Spine density, length and width are expressed as mean ± SEM; **** p < 0.0001, ns = not significant, for selected comparisons. The full set of comparisons, test selection, and statistical data are provided in Supplemental Table S1.
FIGURE 4:
FIGURE 4:
Increased PI(4,5)P2 levels reduce F-actin in dendritic spines. (A) Original image of a representative dendritic region of a neuron expressing eGFP and stained for MAP2 and F-actin. Cyan arrows: selected examples of dendritic spines. (B) Projected three-dimensional surface renderings of eGFP (green) and MAP2 (blue) fluorescence distribution. (C) Projected three-dimensional surface renderings of isolated dendritic spines obtained by subtracting MAP2 from the eGFP signal (see B). (D) Projected three-dimensional eGFP surface renderings (green) overlayed on the original F-actin image. (E) Isolated dendritic spines (white) shown in (C), overlayed on the original total F-actin signal (red). (F) F-actin only in spines, resulting from subtracting image shown in (E). See Materials and Methods for details on image processing used to measure F-actin and volume of dendritic spines. Image width = 30 µm. (G) Volumetric measurements of F-actin content per dendritic spine were calculated as the ratio of F-actin integrated intensity over spine volume. Data are expressed as mean ± SEM; *** p < 0.001. Test selection, and statistical data are provided in Supplemental Table S1.
FIGURE 5:
FIGURE 5:
Chronophin overexpression rescues spine FBE reduction induced by PIP5K. (A) Left: Control dendritic region stained with Alexa 488-phalloidin (green) to detect F-actin in dendritic spines (white arrows). Right: two examples of dendritic regions expressing eGFP-PIP5K (green). All conditions are labeled for FBEs (red) using rhodamine-G-actin. Image width, 12 µm. (B) Quantification of the fraction of protrusions with detectable FBEs. Data are expressed as mean ± SEM. See Supplemental Table S1 for complete statistical information. *** p < 0.001. (C) Representative dendritic regions of neurons expressing membrane targeted pDisplay (control), CIN + pDisplay (shown here only CIN), PIP5K, PIP5K, + CIN (for clarity only PIP5K [green] is displayed, while CIN [cyan] is included in the merged image). FBEs were labeled using Alexa 568-G-actin. Image width = 18 µm. (D) Quantification of FBE content was performed only in spines displaying FBE labeling (see Materials and Methods). Data are expressed as mean ± SEM; **** p < 0.0001, ns = not significant. The full set of comparisons, test selection, and statistical data are provided in Supplemental Table S1.
FIGURE 6:
FIGURE 6:
Aberrantly long protrusions induced by 5ptase contain multiple distinct clusters of F-actin along their length. (A) Dendritic regions coexpressing mRFP-actin with either eGFP (top row) or 5ptase (bottom row). Image width = 32 µm. Cyan arrows point to the actin clusters part way or at the tip of a 5ptase elongated spine. (B) Quantification of the fraction of protrusions with actin clusters only at the tip or part way. Data are expressed as mean ± SEM. Unpaired t test between eGFP and 5ptase; *** p = 0.0007. Protrusion percentage was calculated per experiment (n = 3).
FIGURE 7:
FIGURE 7:
Increased cofilin activity rescues spine shrinkage induced by excess PI(4,5)P2, while decreased cofilin activity prevents spine elongation induced by decreased PI(4,5)P2. The availability of PI(4,5)P2 was increased via expression of either PIP5K or MARCKS shRNA; PI(4,5)P2 availability was decreased via expression of 5ptase or S4N-MARCKS; cofilin activity was increased via expression of CIN; cofilin activity was decreased via LIMK or CIN shRNA. (A) Representative dendritic regions of neurons expressing either eGFP, PIP5K, or PIP5K + CIN, together with a cell filler. Note: In these images (A, E, I, and M) only the cell filler (eGFP or mcherry) is shown. It was used for quantitative analysis of dendritic spine size. All image width = 27 µm. (B–D) Data are expressed as mean ± SEM. See Supplemental Table S1 for complete statistical information. For selected comparisons referenced in the main text: **** p < 0.0001, ***p = 0.0009, **p = 0.0028, *p = 0.0249, ns = not significant. (E) Representative dendritic regions of neurons expressing either eGFP, MARCKS shRNA, or MARCKS shRNA + CIN, together with a cell filler (See Note in A). (F–H) Data are expressed as mean ± SEM. See Supplemental Table S1 for complete statistical information. For selected comparisons referenced in the main text: **** p < 0.0001, **p = 0.001, ns = not significant. (I) Representative dendritic regions of neurons expressing either eGFP, 5ptase or 5ptase plus constructs that increase cofilin phosphorylation: LIMK, and chronophin (CIN) shRNA. (See Note in A). (J–L) Data are expressed as mean ± SEM. See Supplemental Table S1 for complete statistical information. For selected comparisons referenced in the main text: **** p < 0.0001, ***p = 0.0076, ns = not significant. (M) Representative dendritic regions of neurons expressing either S4N or S4N + LIMK. (N–P) Data are expressed as mean ± SEM. See Supplemental Table S1 for complete statistical information. For selected comparisons referenced in the main text: **** p < 0.0001, ns = not significant. Note: For display convenience, the data for the eGFP and LIMK groups are duplicated in figures J–L and N–P; however, these data were collected together within the same sets of experiments, and compared for statistical purposes using a single one-way ANOVA.
FIGURE 8:
FIGURE 8:
Summary diagram for the role of MARCKS and PI(4,5)P2 interactions in controlling dendritic spine morphology through cofilin activity. Our experiments support a model in which changes in MARCKS levels at the membrane affect the amount of free PI(4,5)P2 that is available to suppress cofilin severing activity. In turn this affects spine shape and size via F-actin. Regulation of membrane trafficking was not explored here, but is also likely to contribute to spine modifications.

References

    1. Al-Fahad D, Al-Harbi B, Abbas Y, Al-Yaseen F (2022). A Comparative Study to Visualize PtdIns(4,5) P2 and PtdIns(3,4,5) P3 in MDA-MB-231 Breast Cancer Cell Line. Rep Biochem Mol Biol 10, 518–526. - PMC - PubMed
    1. Albert KA, Walaas SI, Wang JK, Greengard P (1986). Widespread occurrence of “87 kDa,” a major specific substrate for protein kinase C. Proc Natl Acad Sci USA 83, 2822–2826. - PMC - PubMed
    1. Alsegiani AS, Shah ZA (2020). The role of cofilin in age-related neuroinflammation. Neural Regen Res 15, 1451–1459. - PMC - PubMed
    1. Arbuzova A, Schmitz AA, Vergeres G (2002). Cross-talk unfolded: MARCKS proteins. Biochem J 362, 1–12. - PMC - PubMed
    1. Arbuzova A, Wang J, Murray D, Jacob J, Cafiso DS, McLaughlin S (1997). Kinetics of interaction of the myristoylated alanine-rich C kinase substrate, membranes, and calmodulin. J Biol Chem 272, 27167–27177. - PubMed

MeSH terms