. 2023 Dec 12;21(12):e8442.
doi: 10.2903/j.efsa.2023.8442. eCollection 2023 Dec.

The European Union One Health 2022 Zoonoses Report

The European Union One Health 2022 Zoonoses Report

European Food Safety Authority (EFSA) et al. EFSA J. .

Abstract

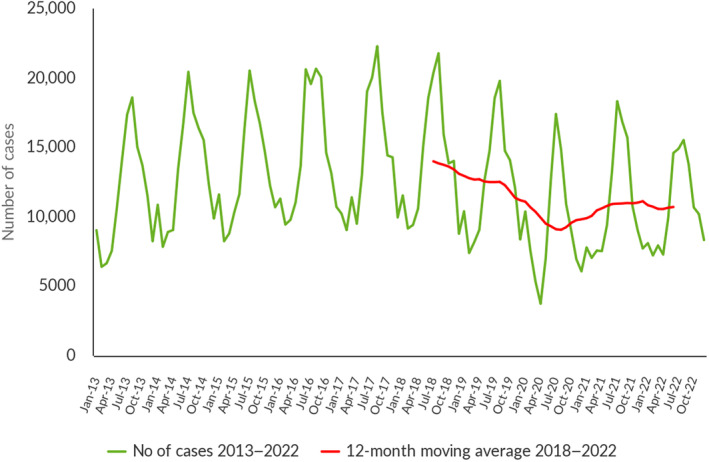
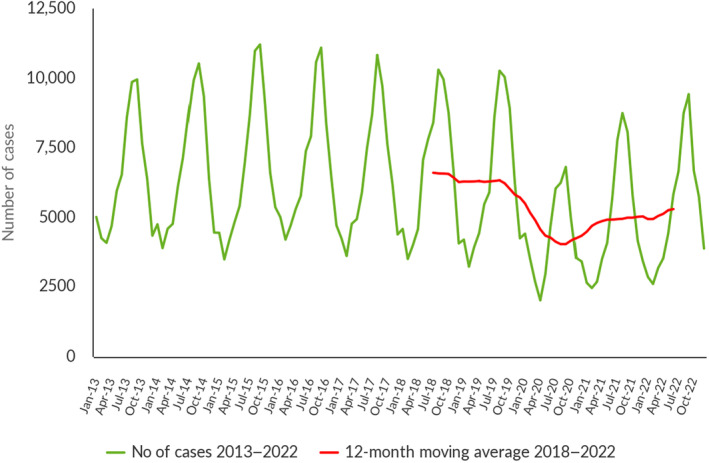
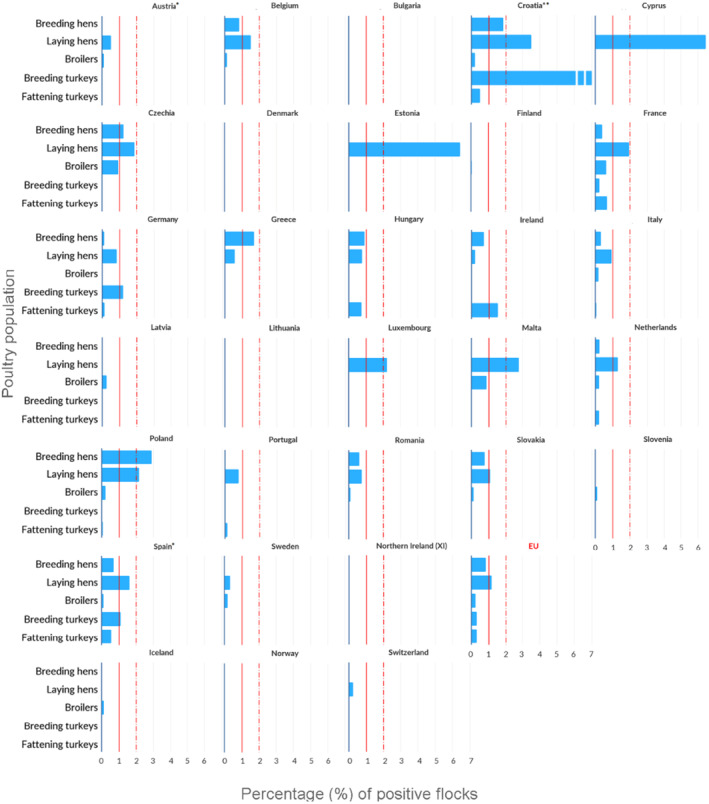
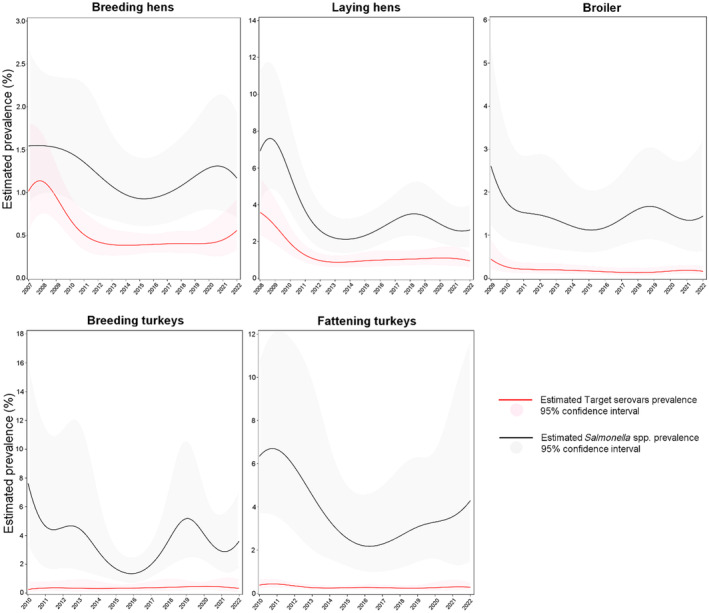
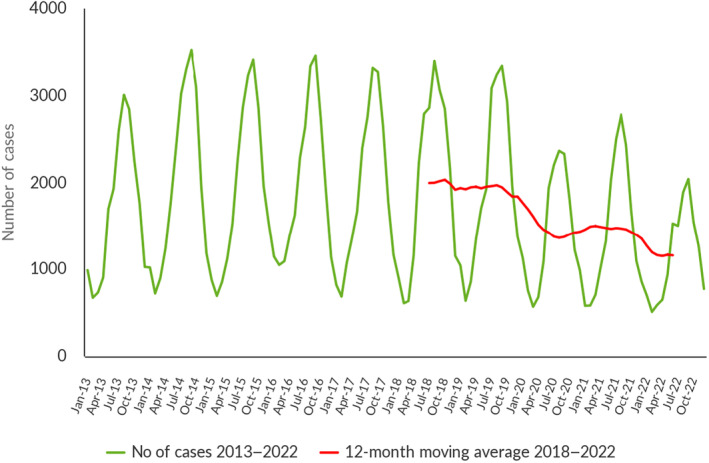
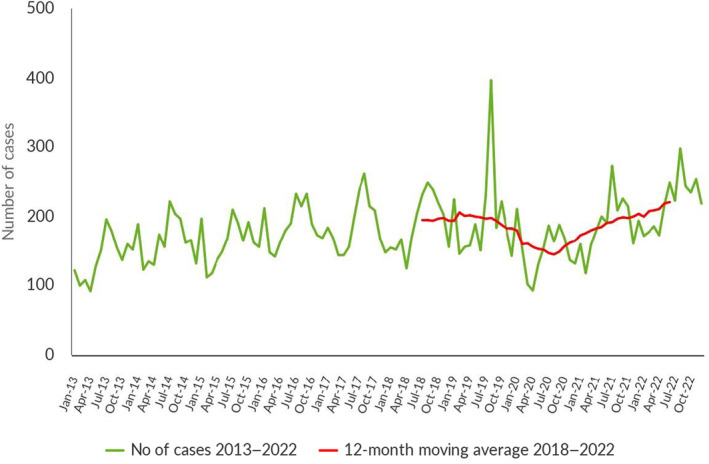
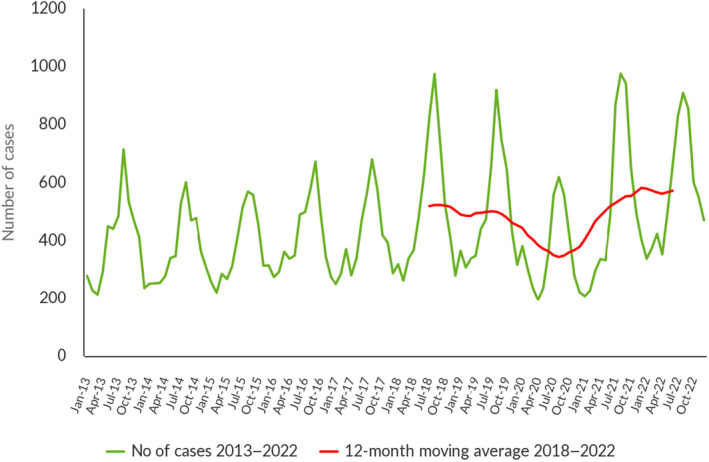
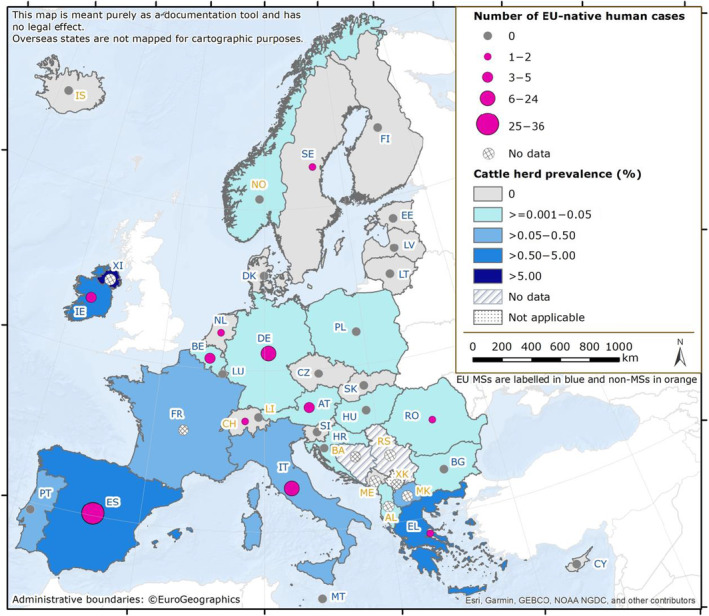
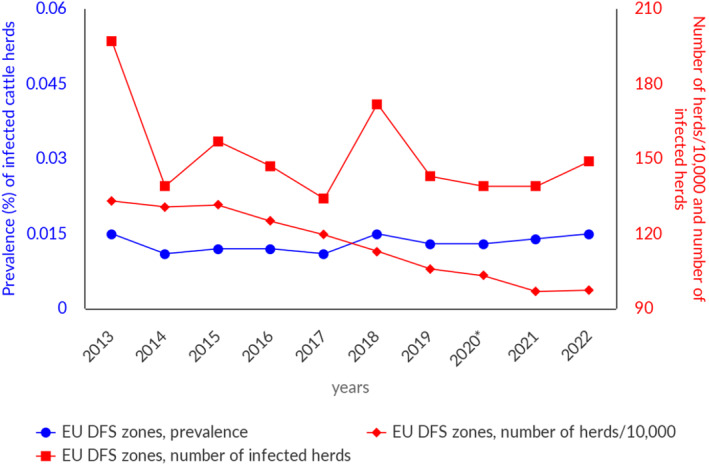
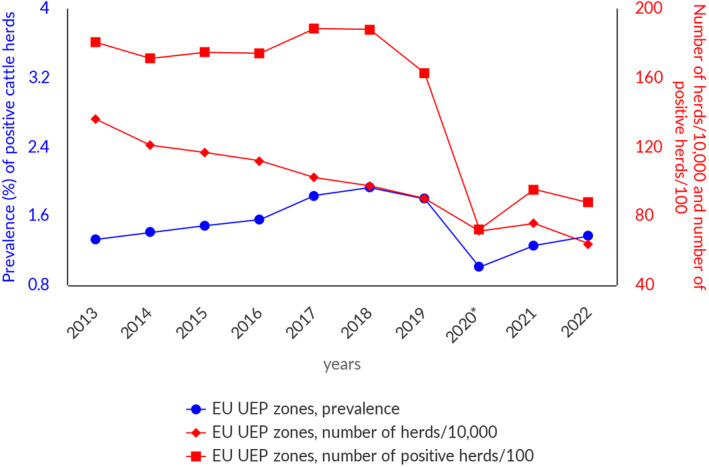
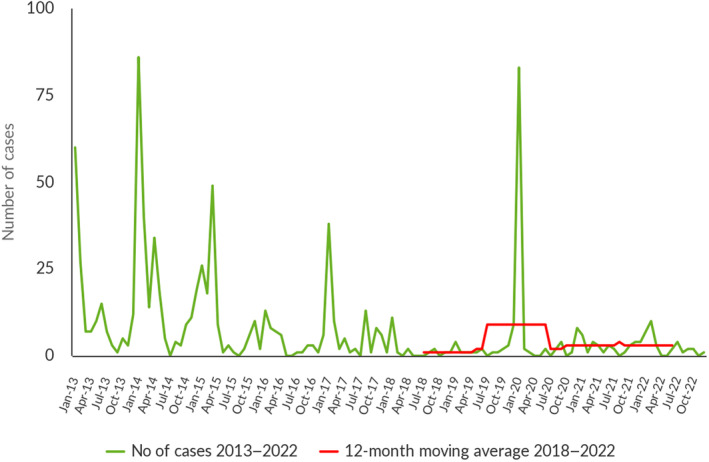
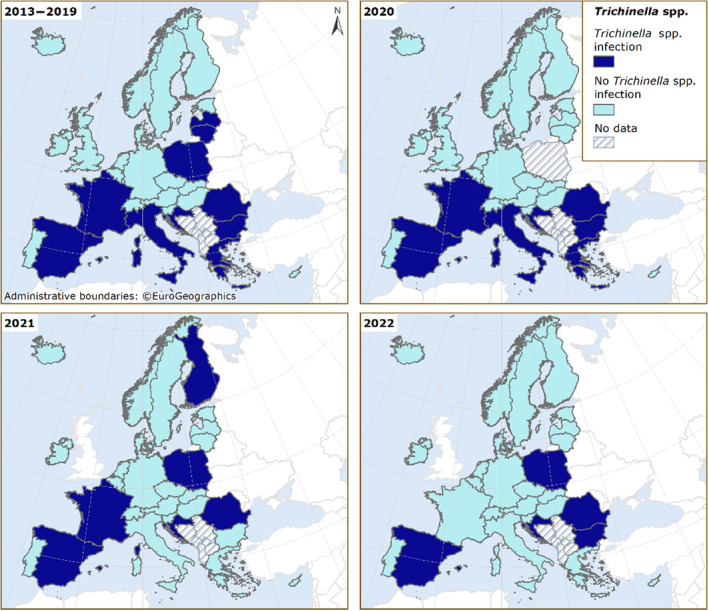
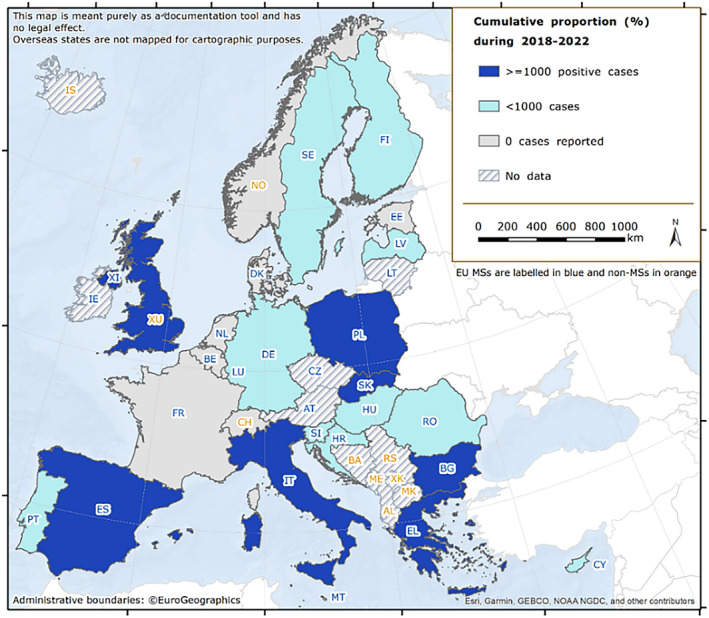
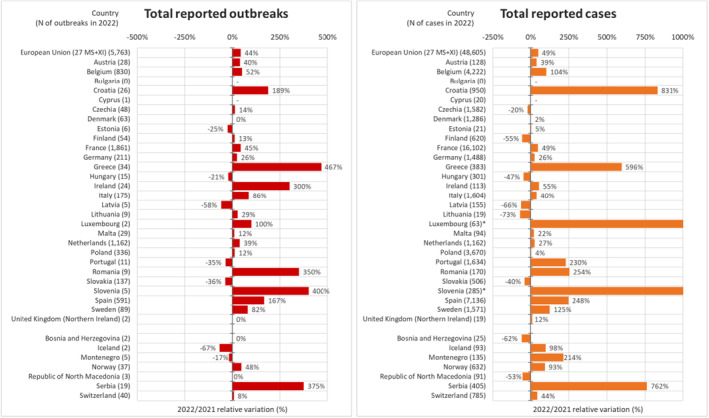
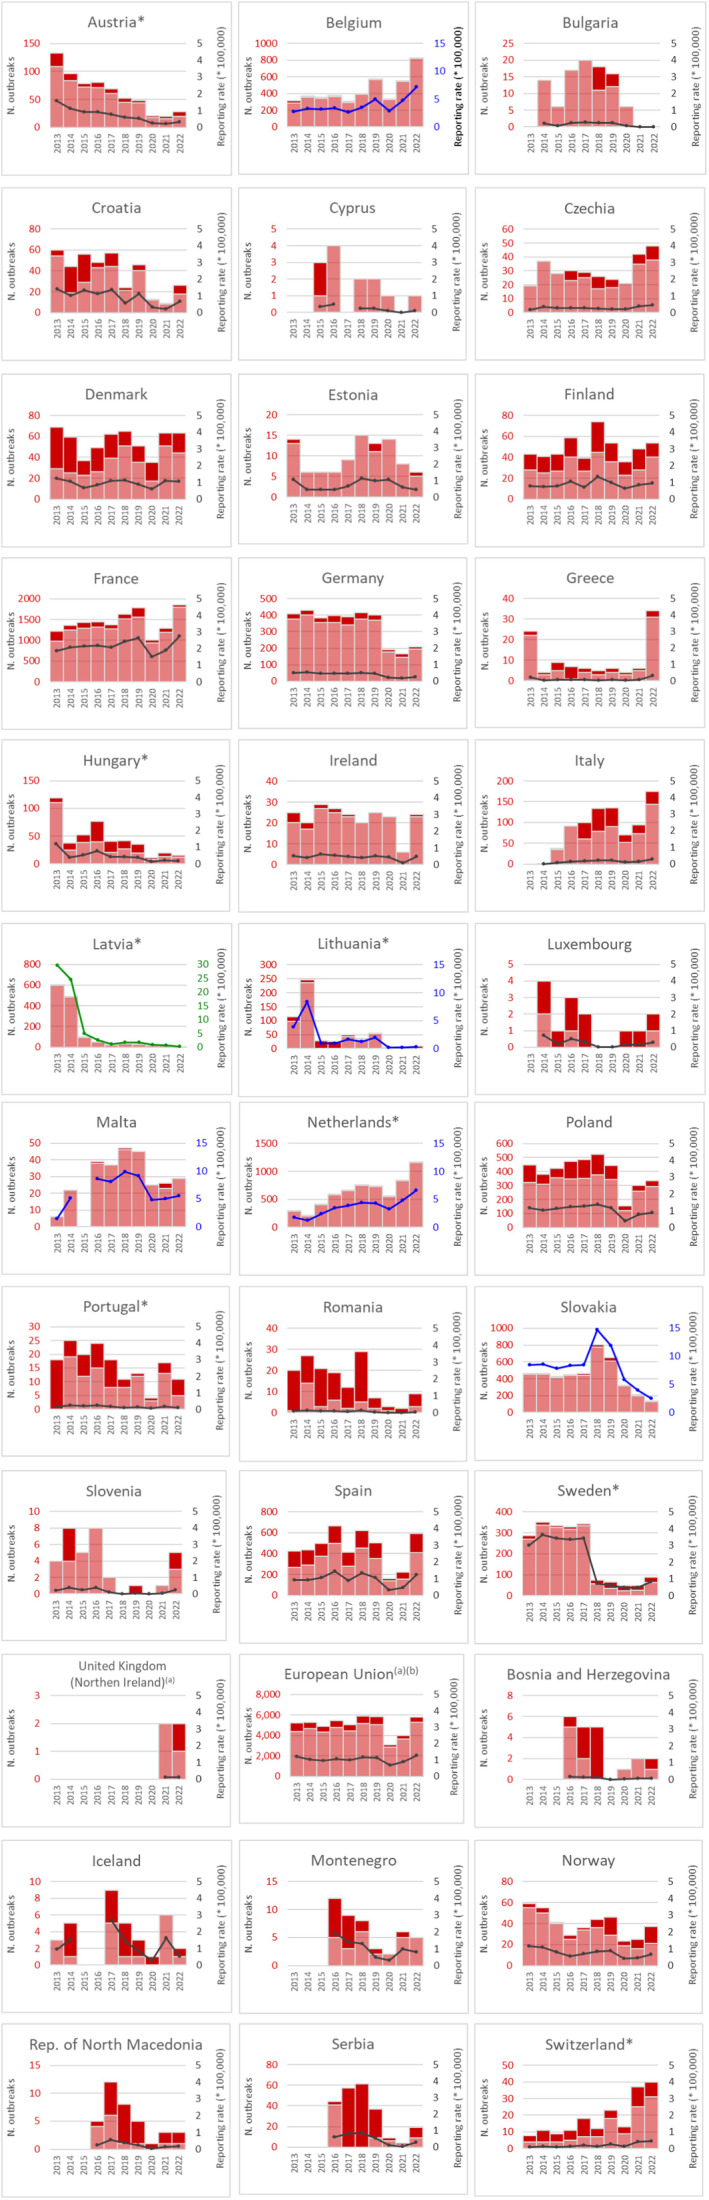
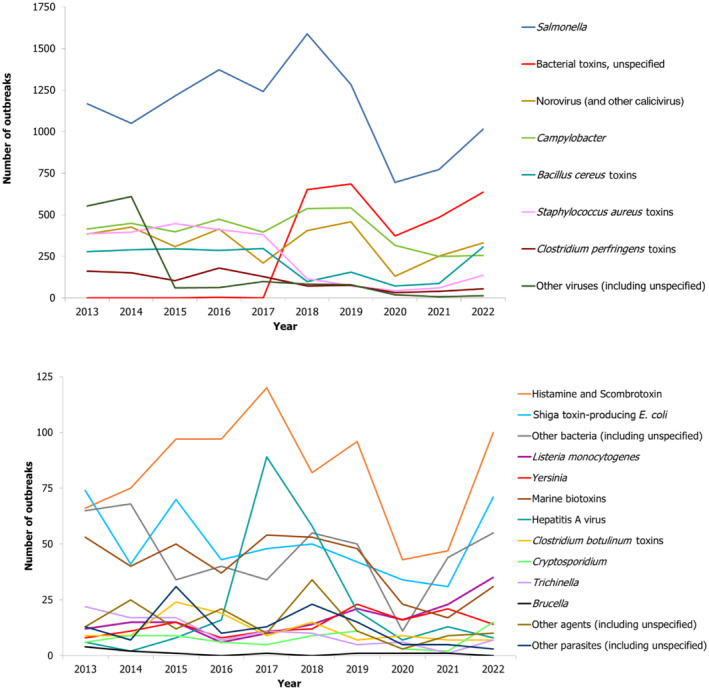
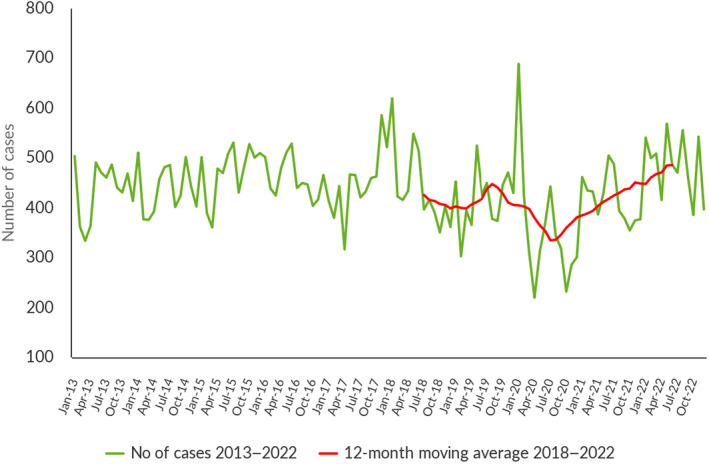
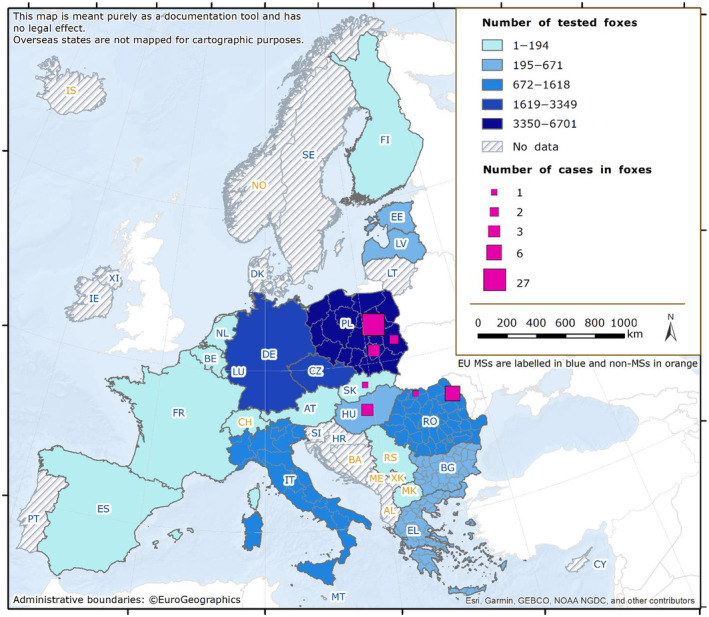
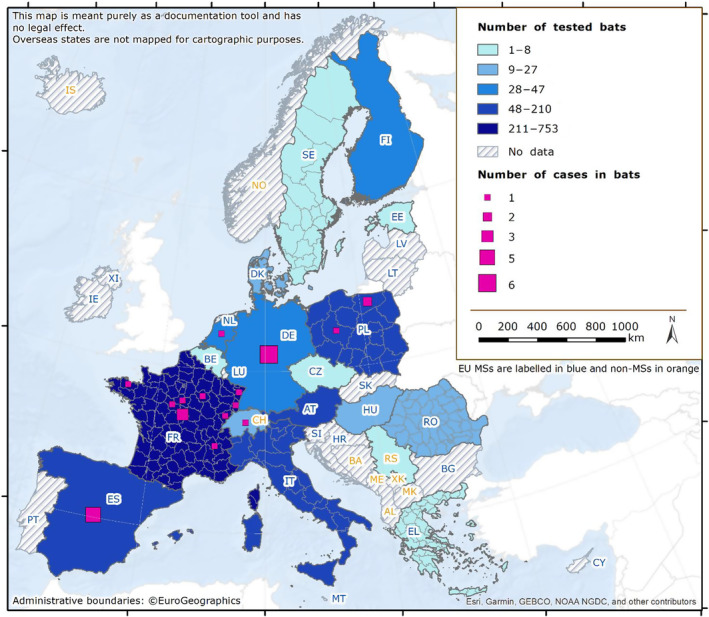
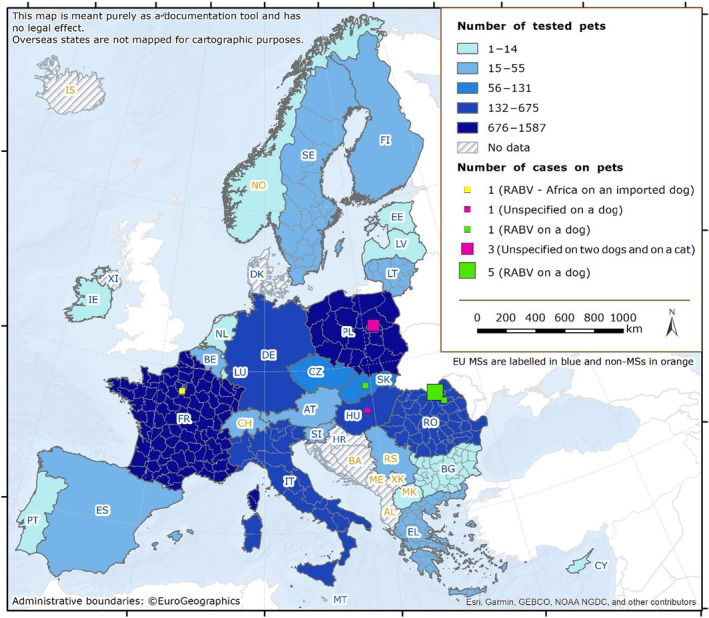
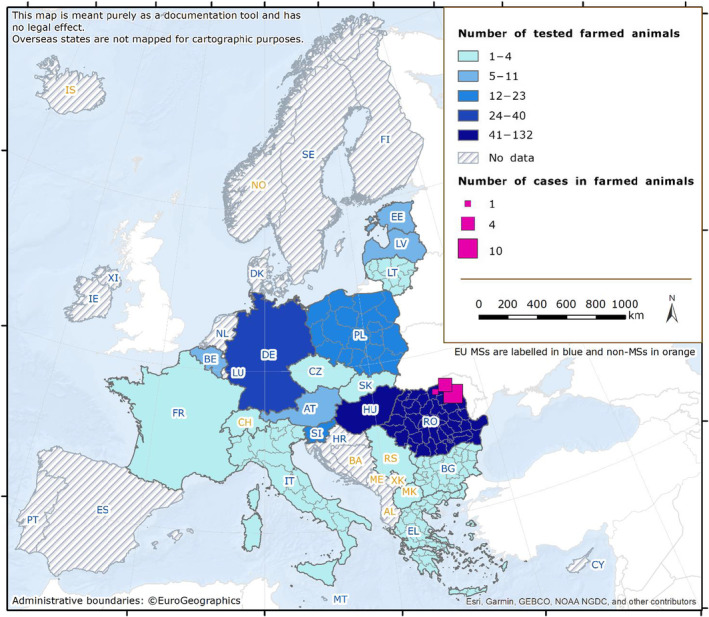
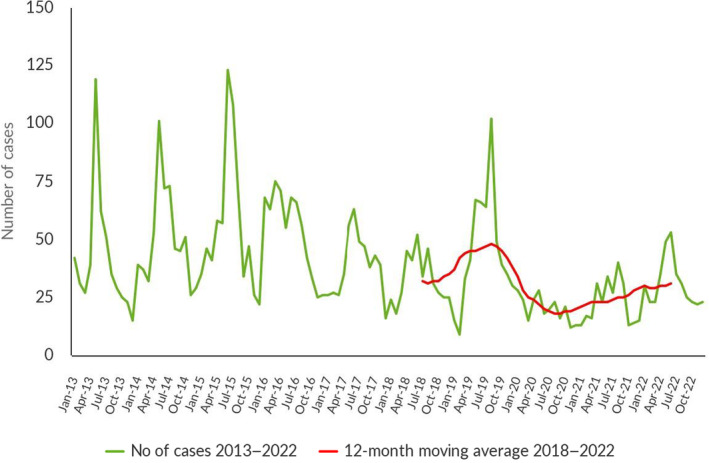
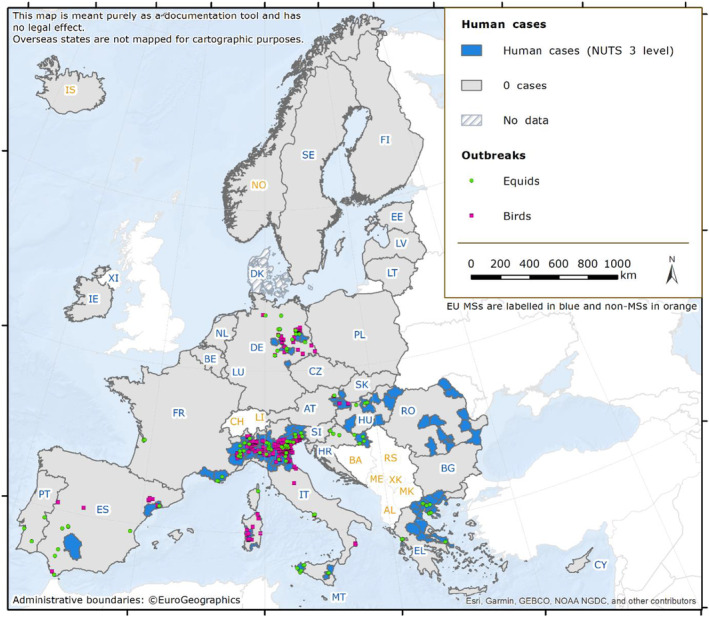
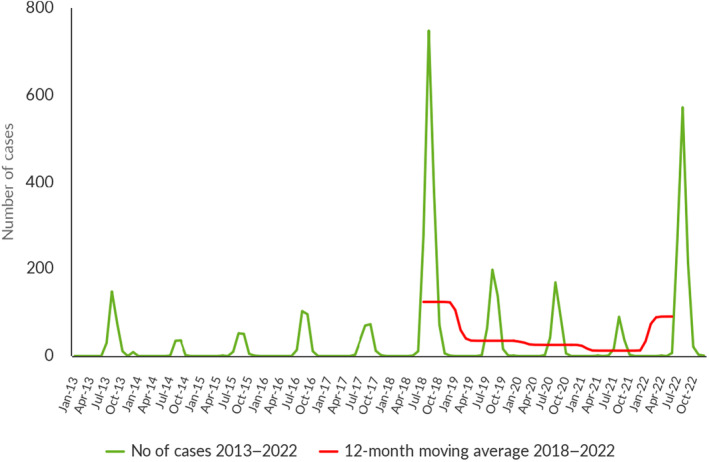
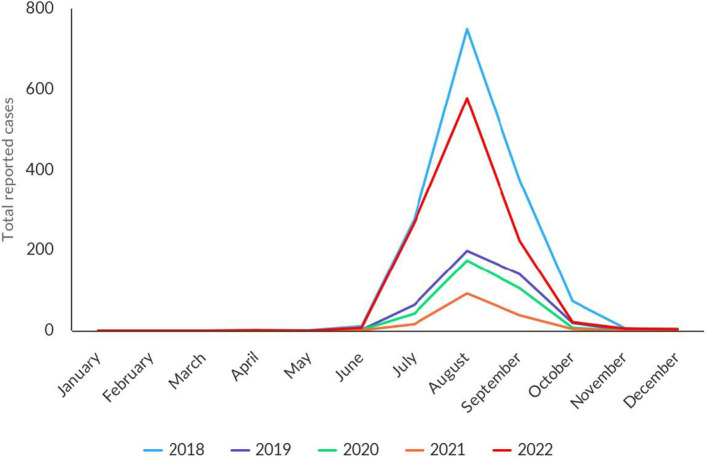
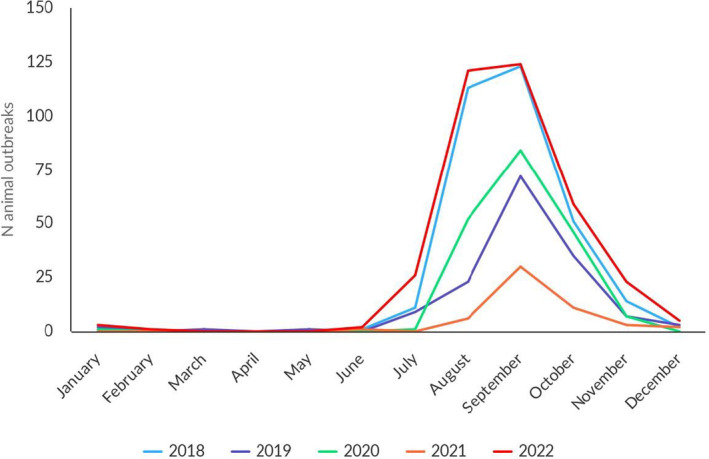
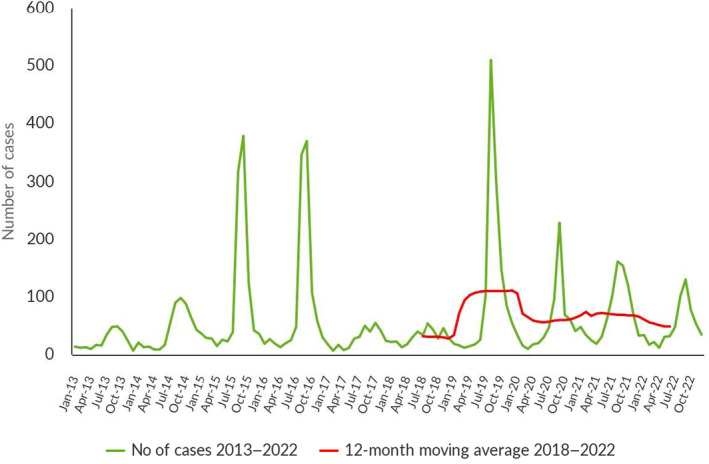
This report by the European Food Safety Authority and the European Centre for Disease Prevention and Control presents the results of the zoonoses monitoring and surveillance activities carried out in 2022 in 27 Member States (MSs), the United Kingdom (Northern Ireland) and 11 non-MSs. Key statistics on zoonoses and zoonotic agents in humans, food, animals and feed are provided and interpreted historically. In 2022, the first and second most reported zoonoses in humans were campylobacteriosis and salmonellosis, respectively. The number of cases of campylobacteriosis and salmonellosis remained stable in comparison with 2021. Nineteen MSs and the United Kingdom (Northern Ireland) achieved all the established targets in poultry populations for the reduction of Salmonella prevalence for the relevant serovars. Salmonella samples from carcases of various animal species, and samples for Campylobacter quantification from broiler carcases, were more frequently positive when performed by the competent authorities than when own checks were conducted. Yersiniosis was the third most reported zoonosis in humans, followed by Shiga toxin-producing Escherichia coli (STEC) and Listeria monocytogenes infections. L. monocytogenes and West Nile virus infections were the most severe zoonotic diseases, with the most hospitalisations and highest case fatality rates. In 2022, reporting showed an increase of more than 600% compared with 2021 in locally acquired cases of human West Nile virus infection, which is a mosquito-borne disease. In the EU, the number of reported foodborne outbreaks and cases, hospitalisations and deaths was higher in 2022 than in 2021. The number of deaths from outbreaks was the highest ever reported in the EU in the last 10 years, mainly caused by L. monocytogenes and to a lesser degree by Salmonella. Salmonella and in particular S. Enteritidis remained the most frequently reported causative agent for foodborne outbreaks. Norovirus (and other calicivirus) was the agent associated with the highest number of outbreak human cases. This report also provides updates on brucellosis, Coxiella burnetii (Q fever), echinococcosis, rabies, toxoplasmosis, trichinellosis, infection with Mycobacterium tuberculosis complex (focusing on Mycobacterium bovis and Mycobacterium caprae) and tularaemia.

Keywords: Campylobacter; Listeria; Salmonella; West Nile; foodborne outbreaks; monitoring; parasites; zoonoses.


Conflict of interest statement

If you wish to access the declaration of interests of any expert contributing to an EFSA scientific assessment, please contactinterestmanagement@efsa.europa.eu.

Figures

FIGURE 1
FIGURE 1
Trends in reported confirmed human cases of campylobacteriosis in the EU, by month, 2018–2022. Source: Austria, Belgium, Cyprus, Czechia, Denmark, Estonia, Finland, France, Germany, Hungary, Ireland, Italy, Latvia, Luxembourg, Malta, the Netherlands, Poland, Portugal, Romania, Slovakia, Slovenia, Spain and Sweden.
FIGURE 2
FIGURE 2
Trend in reported confirmed human cases of non‐typhoidal salmonellosis in the EU by month, 2018–2022. Source: Austria, Belgium, Cyprus, Czechia, Denmark, Estonia, Finland, France, Germany, Greece, Hungary, Ireland, Italy, Luxembourg, Latvia, Malta, the Netherlands, Poland, Portugal, Romania, Spain, Slovakia, Slovenia and Sweden.
FIGURE 3
FIGURE 3
Prevalence of poultry flocks (breeding flocks of Gallus gallus, laying hens, broilers, breeding turkeys and fattening turkeys) positive for target Salmonella serovars, EU MSs and non‐MS countries, 2022. Note: Vertical bars indicate the target to be reached, which was set at 1% for all poultry populations with the exception of laying hens, for which it was 2%. For laying hens, according to Reg. (EU) No 517/2011, Poland and Luxembourg reached the reduction target (Article 1 (a): reduction of prevalence of 10% compared to previous year for Poland; Article 1 (b): one adult flock can remain positive for MSs with less than 50 flocks, for Luxembourg). For breeding turkeys, according to Reg. (EU) No 1190/2012, Croatia and Spain reached the reduction target (Article 1: one adult flock can remain positive for MSs with less than 100 flocks). *Austria amended the data for laying hens and for broilers in the last phase of the preparation of the present report. The prevalence of positive flocks for target Salmonella serovars was 0.50% instead of 0.53% (laying hens) and 0.11% instead of 0.13% (broilers). Spain amended the data for breeding Gallus gallus in the last phase of the preparation of the present report. The prevalence of positive flocks for target serovars was 0.36% instead of 0.71%. **Croatia reported having tested one breeding turkey flock, which was found positive for target Salmonella serovars (100%).
FIGURE 4
FIGURE 4
Trend in the estimated prevalence of poultry flocks positive for Salmonella spp. and target Salmonella serovars, at EU level for different poultry populations, 2007–2022.
FIGURE 5
FIGURE 5
Trend in reported confirmed human cases of S. Enteritidis infections acquired in the EU, by month, 2018–2022. Source: Austria, Belgium, Czechia, Denmark, Estonia, Finland, France, Germany, Greece, Hungary, Ireland, Italy, Latvia, Malta, Portugal, Slovakia, Slovenia and Sweden.
FIGURE 6
FIGURE 6
Sankey diagram of the distribution of the top five EU‐level Salmonella serovars involved in human salmonellosis cases acquired in the EU, reported from specified food–animal categories, by food–animal source, EU, 2022. Note: The left side of the diagram shows the five most commonly reported Salmonella serovars involved in human salmonellosis cases acquired in the EU: S. Enteritidis (light blue), S. Infantis (green), S. Typhimurium (orange), monophasic S. Typhimurium (1,4,[5],12:i:‐) (indigo) and S. Derby (violet). Animal and food data from the same source were merged: ‘broiler’ includes isolates from broiler flocks and broiler meat, ‘bovine' includes isolates from bovine animals for meat production and from bovine meat, ‘pig’ includes isolates from fattening pigs and pig meat, ‘turkey’ includes isolates from fattening turkey flocks and turkey meat, and ‘layers’ includes isolates from laying hen flocks and eggs. The right side shows the five sources considered (broilers (blue), bovine animals (light green), pigs (red), turkeys (light orange) and layers (light mint green)). The width of the coloured bands linking the sources and serovars is proportional to the percentage of isolates of each serovar from each source.
FIGURE 7
FIGURE 7
Overview of Listeria monocytogenes testing along the food chain according to the sampling stage, the sampler and the objective of the sampling, EU.
FIGURE 8
FIGURE 8
Trends in reported confirmed human cases of listeriosis in the EU by month, 2018–2022. Source: Austria, Belgium, Cyprus, Czechia, Denmark, Estonia, Finland, France, Germany, Greece, Hungary, Ireland, Italy, Latvia, Luxembourg, Malta, the Netherlands, Poland, Portugal, Romania, Slovakia, Slovenia, Spain and Sweden.
FIGURE 9
FIGURE 9
Trends in reported confirmed human cases of STEC infection in the EU by month, 2013–2022. Source: Austria, Belgium, Czechia, Denmark, Estonia, Finland, France, Germany, Greece, Hungary, Ireland, Italy, Luxembourg, Malta, Netherlands, Poland, Portugal, Romania, Slovakia, Slovenia, Spain and Sweden.
FIGURE 10
FIGURE 10
Map of the number of confirmed tuberculosis cases due to Mycobacterium bovis or Mycobacterium caprae in individuals of EU origin, and national herd prevalence of tuberculosis in the bovine population in EU MS and non‐MS countries, 2022. Note: The United Kingdom (Northern Ireland) informed during the last phase of the production of this draft report that the numbers of positive herds for bovine tuberculosis were 2785 in 2022 and 2303 in 2021.
FIGURE 11
FIGURE 11
Prevalence of cattle herds infected with the Mycobacterium tuberculosis complex in disease‐free status (DFS) zones, EU, 2013–2022. aIn contrast to years 2013–2019, the year 2020 does not include the United Kingdom data. Since 1 February 2020, the United Kingdom has withdrawn from the EU and has become a third country.
FIGURE 12
FIGURE 12
Prevalence of cattle herds positive for bovine tuberculosis in zones under an eradication programme (UEP), EU, 2013–2022. *In contrast to years 2012–2019, year 2020 does not include the United Kingdom data. Since 1 February 2020, the United Kingdom has withdrawn from the EU and has become a third country. No data were reported from Bulgaria.
FIGURE 13
FIGURE 13
Trend in reported confirmed human cases of brucellosis in the EU, by month, 2018–2022. Source: Austria, Belgium, Cyprus, Czechia, Estonia, Finland, France, Germany, Greece, Hungary, Ireland, Italy, Latvia, Lithuania, Luxembourg, Malta, Netherlands, Poland, Portugal, Romania, Slovakia, Slovenia and Sweden.
FIGURE 14
FIGURE 14
Number of confirmed, domestically acquired brucellosis cases in humans and national prevalence of Brucella‐positive cattle herds, and sheep and goat flocks, in EU MSs and non‐MS countries, 2022.
FIGURE 15
FIGURE 15
Prevalence of Brucella‐positive cattle herds, in zones under an eradication programme (UEP), EU, 2013–2022. UEP, under an eradication programme.
FIGURE 16
FIGURE 16
Prevalence of Brucella‐positive sheep and goat flocks, in zones under an eradication programme (UEP), EU, 2013–2022. UEP, under an eradication programme.
FIGURE 17
FIGURE 17
Trend in reported confirmed human cases of trichinellosis in the EU by month, 2018–2022. Sourcea: Austria, Cyprus, Czechia, Estonia, Finland, France, Germany, Greece, Hungary, Ireland, Italy, Latvia, Lithuania, Luxembourg, Malta, Poland, Portugal, Romania, Slovakia, Slovenia and Sweden. aThe case distribution includes two cases reported erroneously by Finland in 2021 and 2022.
FIGURE 18
FIGURE 18
Trichinella spp. in domestic pigs and farmed wild boar in EU MSs and non‐MS countries, 2013–2022. Note: These distribution maps have been built based on data from reports (EFSA and ECDC, 2015a, 2015b, 2016, 2017, 2018, 2019, 2021a, 2021b, 2022).
FIGURE 19
FIGURE 19
Cumulative proportion (%) of test‐positive animals for Echinococcus granulosus sensu lato, by intermediate host species, in EU MSs and non‐MSs, 2018–2022.
FIGURE 20
FIGURE 20
Map of the cumulative proportion (%) of test‐positive animals for Echinococcus granulosus sensu lato in MSs and non‐MSs, by country, 2018–2022. Note: Dark blue ≥ 1000 positive cases; light blue < 1000 cases; grey = 0 cases reported; diagonally shaded = unreported data. Because of the co‐endemicity with Echinococcus multilocularis, positive pigs were excluded from Poland, Romania, Slovakia and Slovenia when Echinococcus species information was not reported. Spain (N = 289,004), Italy (N = 236,474), the United Kingdom (N = 46,937), Greece (N = 45,798), Bulgaria (N = 17,765), Poland (N = 2479) and Slovakia (N = 1654), were the countries with the highest endemicity for E. granulosus s.l. in the EU in 2018–2022.
FIGURE 21
FIGURE 21
Relative variations (%) in foodborne outbreaks and outbreak‐related cases reported in 2022 compared with 2021, by reporting countries. Note: *2022/2021 relative variation for Luxembourg was 2000% and for Slovenia 9400%. During the last phase of the production of this report, Hungary informed EFSA that one strong‐evidence outbreak (involving one case) was reported in error.
FIGURE 22
FIGURE 22
Trends in the number of strong‐evidence and weak‐evidence outbreaks (left axis) and outbreak reporting rate (per 100,000) (right axis) in the EU and reporting EU MS and non‐MS countries, 2013–2022. Note: *Indicates countries with a statistically significant trend (p < 0.05) over the period. During the last phase of the production of this draft report, Hungary informed EFSA that the one strong‐evidence outbreak was reported in error. Dark red and light red show strong‐ and weak‐evidence outbreaks, respectively. Black dots and lines show FBO reporting rates. The dots, lines and secondary Y‐axis in blue or green showing the outbreak reporting rates have been used for Belgium, Latvia, Lithuania, Malta, the Netherlands and Slovakia, in order to draw attention to the reporting rate scale that is different to that of the other countries. aFor the 2021–2022 period, data from the United Kingdom (Northern Ireland) were taken into account. In accordance with the agreement on the withdrawal of the United Kingdom from the EU, and in particular with the Protocol on Ireland/Northern Ireland, the EU requirements on data sampling are also applicable to Northern Ireland. bFor the 2013–2019 period, data on FBOs from the United Kingdom were taken into account, because the United Kingdom was still an EU MS at that time. However, on 1 February 2020 it became a third country.
FIGURE 23
FIGURE 23
Number of foodborne outbreaks by causative agent, reported to the EU by MSs, 2013–2022. Note: Outbreaks reported by the United Kingdom are included for the 2013–2019 period. However, data from the United Kingdom (Northern Ireland) are taken into account for the 2021–2022 period. In accordance with the agreement on the withdrawal of the United Kingdom from the EU, and in particular with the Protocol on Ireland/Northern Ireland, EU requirements on data sampling are also applicable to Northern Ireland. During the last phase of the production of this draft report, Hungary informed us that the one strong‐evidence outbreak caused by Listeria monocytogenes was reported in error. ‘Marine biotoxins’ include ciguatoxin, muscle‐paralysing toxin, okadaic acid and unspecified marine biotoxins. ‘Norovirus (and other calicivirus)’ include norovirus (Norwalk‐like virus), sapovirus (Sapporo‐like virus) and unspecified calicivirus. ‘Other bacteria (incl. unspecified)’ include Aeromonas, Arcobacter, Cronobacter sakazakii, E. coli other than STEC, Enterococcus, Francisella, Leptospira, Shigella, Streptococcus, Vibrio cholerae (non‐toxigenic), Vibrio parahaemolyticus and other unspecified bacteria. ‘Other parasites (incl. unspecified)’ include Anisakis, Cysticerci, Enterocytozoon bieneusi, Giardia and other unspecified parasites. ‘Other viruses (incl. unspecified)’ include Adenovirus, Enterovirus, Flavivirus (incl. Tick‐borne Encephalitis virus), Hepatitis E virus, unspecified Hepatitis virus, Rotavirus and other unspecified virus. ‘Other agents (incl. unspecified)’ include atropine, chemical agents, lectins, monosodium glutamate, mushroom toxins, mycotoxins, unspecified toxins and wax esters (from fish).
FIGURE 24
FIGURE 24
Trends in reported confirmed human cases of yersiniosis in the EU, by month, 2018–2022. Source: Austria, Cyprus, Czechia, Denmark, Estonia, Finland, France, Germany, Hungary, Ireland, Italy, Latvia, Luxembourg, Poland, Portugal, Romania, Slovakia, Slovenia, Spain, Sweden.
FIGURE 25
FIGURE 25
Choropleth map of the number of tested and positive foxes in the framework of passive surveillance, and the geographical distribution of the rabies cases reported in foxes in EU MSs and non‐EU countries, 2022. Note: For Slovakia and Hungary, the geographical distribution of reported cases was not provided.
FIGURE 26
FIGURE 26
Choropleth map of the number of tested and positive bats, and the geographical distribution of the rabies cases reported in bats in EU MSs and non‐EU countries, 2022. Note: For Germany, Spain and Netherlands, the geographical distribution of reported cases was not provided.
FIGURE 27
FIGURE 27
Choropleth map of the number of tested and positive pets, and the geographical distribution of the rabies cases reported in pets in EU MSs and non‐EU countries, 2022. Note: For Slovakia and Hungary, the geographical distribution of reported cases was not provided.
FIGURE 28
FIGURE 28
Choropleth map of the number of tested and positive farmed animals, and the geographical distribution of the rabies cases reported in farmed animals in EU MSs and non‐EU countries, 2022.
FIGURE 29
FIGURE 29
Trend in reported confirmed human cases of Q fever in the EU by month, 2018–2022. Source: Cyprus, Czechia, Estonia, Finland, France, Greece, Hungary, Ireland, Italy, Latvia, Lithuania, Malta, Netherlands, Poland, Portugal, Romania, Slovakia, Slovenia and Sweden.
FIGURE 30
FIGURE 30
Geographical distribution of locally acquired West Nile virus infections among humans (NUTS 3 level*) and outbreaks notified to ADIS among equids and birds (X,Y coordinates) across the EU, 2022 transmission season. *The NUTS (Nomenclature of territorial units for statistics) are a hierarchical system divided into three levels. NUTS 1: major socio‐economic regions, NUTS 2: basic regions for the application of regional policies, NUTS 3: small regions for specific diagnoses (https://ec.europa.eu/eurostat/web/gisco/geodata/reference‐data/administrative‐units‐statistical‐units/nuts)
FIGURE 31
FIGURE 31
Trend in locally acquired human WNV infections reported in EU MSs, by month, 2018–2022. Source: Austria, Belgium, Bulgaria, Cyprus, Czechia, Estonia, Finland, France, Germany, Greece, Hungary, Ireland, Italy, Latvia, Lithuania, Luxembourg, Malta, Netherlands, Poland, Portugal, Romania, Slovakia, Slovenia, Spain, Sweden.
FIGURE 32
FIGURE 32
Reported human cases of West Nile virus infection in EU MSs, by month, 2018–2022. Note: The data set includes only locally acquired WNF cases and only countries that consistently reported cases (or reported zero cases) over the whole reporting period (last 5 years) and to the level of detail required for trend analysis (not aggregated).
FIGURE 33
FIGURE 33
Outbreaks of West Nile infection in birds and equids in EU MSs, by month, 2018–2022. Data source: ADIS for animal outbreaks.
FIGURE 34
FIGURE 34
Trends in reported confirmed human cases of tularaemia in the EU, by month and year, 2018–2022. Source: Austria, Cyprus, Czechia, Estonia, Finland, France, Germany, Greece, Hungary, Ireland, Italy, Latvia, Luxembourg, Malta, the Netherlands, Poland, Portugal, Romania, Slovakia, Slovenia, Spain and Sweden.

References

    1. Adinolfi, F. , Di Pasquale, J. , & Capitanio, F. (2016). Economic issues on food safety. Italian Journal of Food Safety, 5(1). 10.4081/ijfs.2016.5580 - DOI - PMC - PubMed
    1. Alba, P. , Carfora, V. , Feltrin, F. , Diaconu, E. L. , Sorbara, L. , Dell'Aira, E. , Cerci, T. , Ianzano, A. , Donati, V. , Franco, A. , & Battisti, A. (2023). Evidence of structural rearrangements in ESBL‐positive pESI(like) megaplasmids of S. Infantis . FEMS Microbiology Letters, 370, 1–8. 10.1093/femsle/fnad014 - DOI - PMC - PubMed
    1. Alban, L. , Pozio, E. , Boes, J. , Boireau, P. , Boué, F. , Claes, M. , Cook, A. J. , Dorny, P. , Enemark, H. L. , van der Giessen, J. , Hunt, K. R. , Howell, M. , Kirjusina, M. , Nöckler, K. , Rossi, P. , Smith, G. C. , Snow, L. , Taylor, M. A. , Theodoropoulos, G. , … Zimmer, I. A. (2011). Towards a standardised surveillance for Trichinella in the European Union. Preventive Veterinary Medicine, 99(2–4), 148–160. 10.1016/j.prevetmed.2011.02.008 - DOI - PubMed
    1. Aroussi, A. , Vignoles, P. , Dalmay, F. , Wimel, L. , Dardé, M. L. , Mercier, A. , & Ajzenberg, D. (2015). Detection of toxoplasma gondii DNA in horse meat from supermarkets in France and performance evaluation of two serological tests. Parasite, 22, 14. 10.1051/parasite/2015014 - DOI - PMC - PubMed
    1. Balen Topić, M. , Papić, N. , Višković, K. , Sviben, M. , Filipec Kanižaj, T. , Jadrijević, S. , Jurković, D. , & Beck, R. (2023). Emergence of Echinococcus multilocularis in central continental Croatia: A human case series and update on prevalence in foxes. Life (Basel), 13(6), 1402. 10.3390/life13061402 - DOI - PMC - PubMed

LinkOut - more resources