

Global research trends of diabetes remission: a bibliometric study
- PMID: 38089622
- PMCID: PMC10715259
- DOI: 10.3389/fendo.2023.1272651
Global research trends of diabetes remission: a bibliometric study
Abstract
Background: Research on diabetes remission has garnered prominence in recent years. However, to date, no pertinent bibliometric study has been published. This study sought to elucidate the current landscape and pinpoint potential new research directions through a bibliometric analysis of diabetes remission.
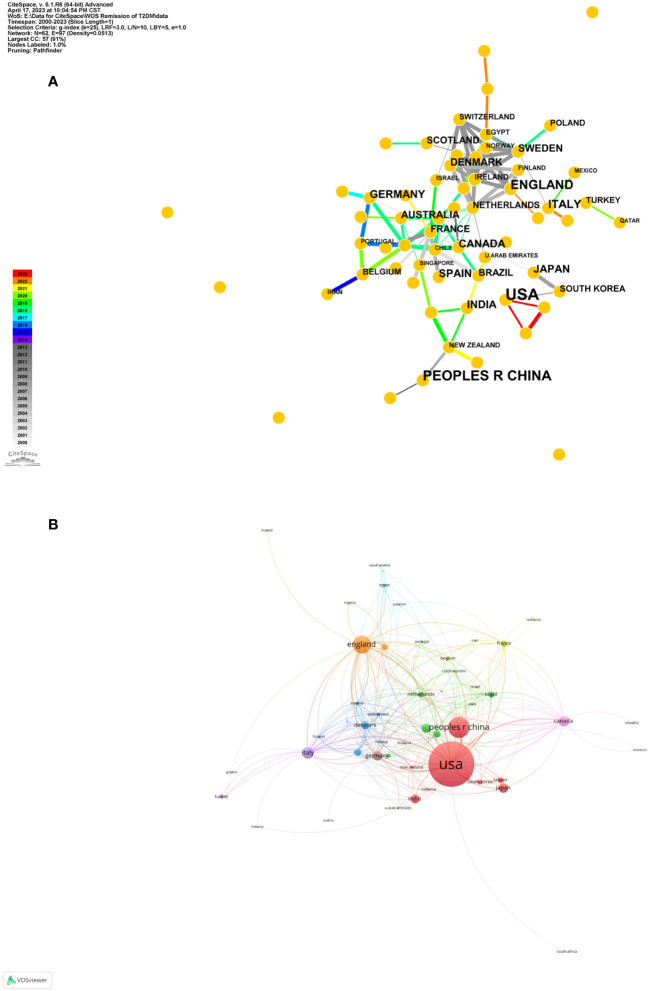
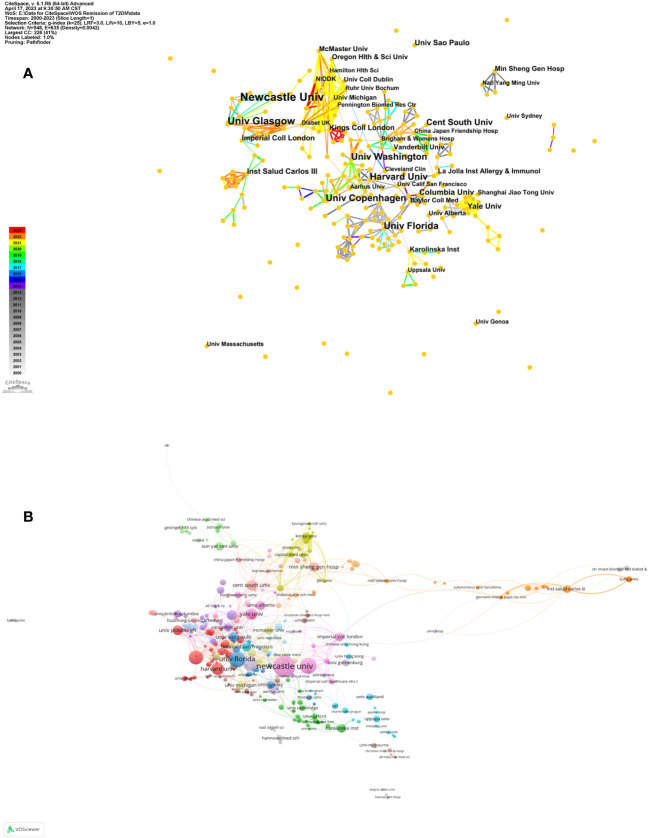
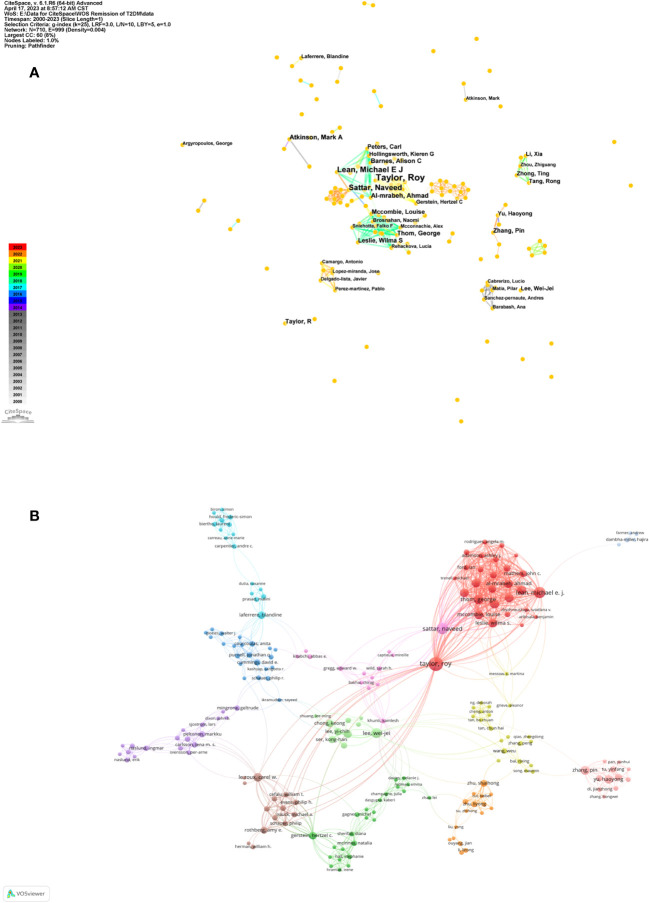
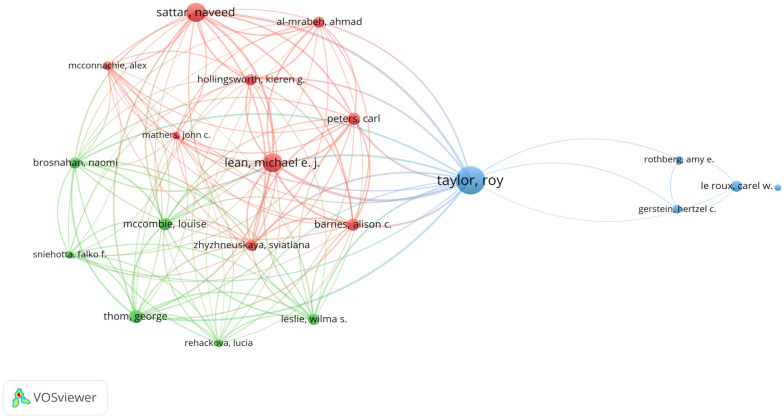
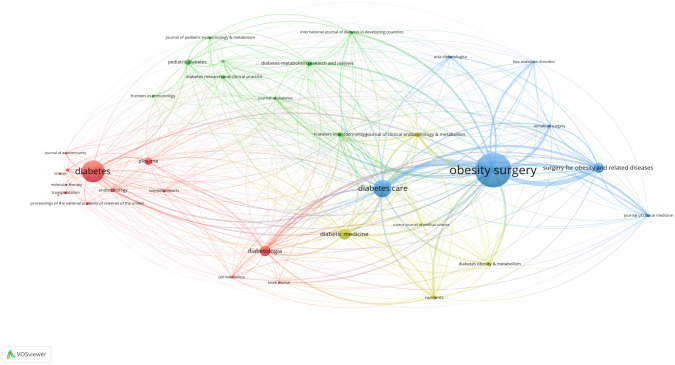
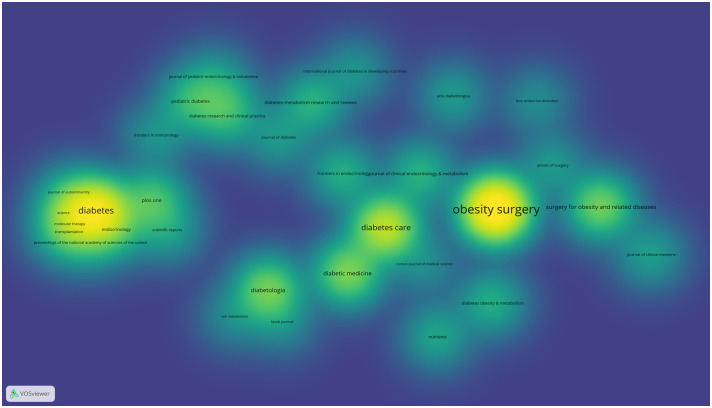
Methods: We perused relevant articles on diabetes remission from January 1, 2000, to April 16, 2023, in the Web of Science. We utilized CiteSpace software and VOSviewer software to construct knowledge maps and undertake analysis of countries, institutional affiliations, author contributions, journals, and keywords. This analysis facilitated the identification of current research foci and forecasting future trends.
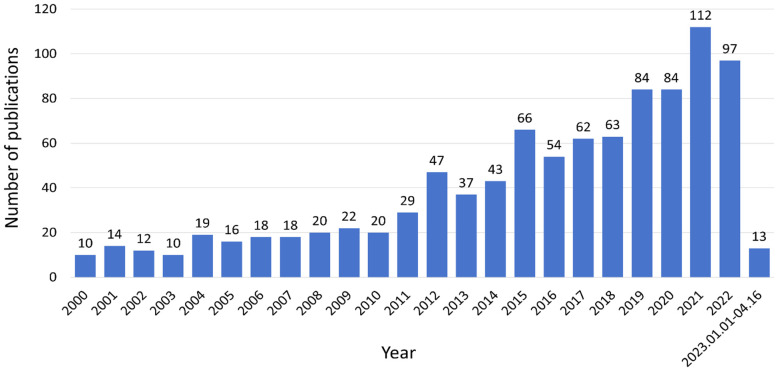
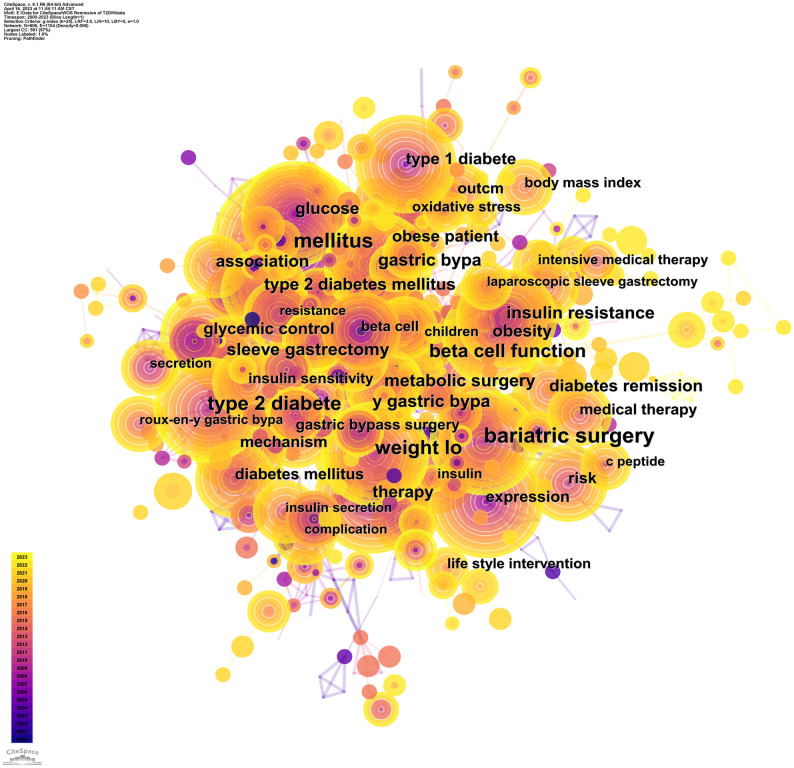
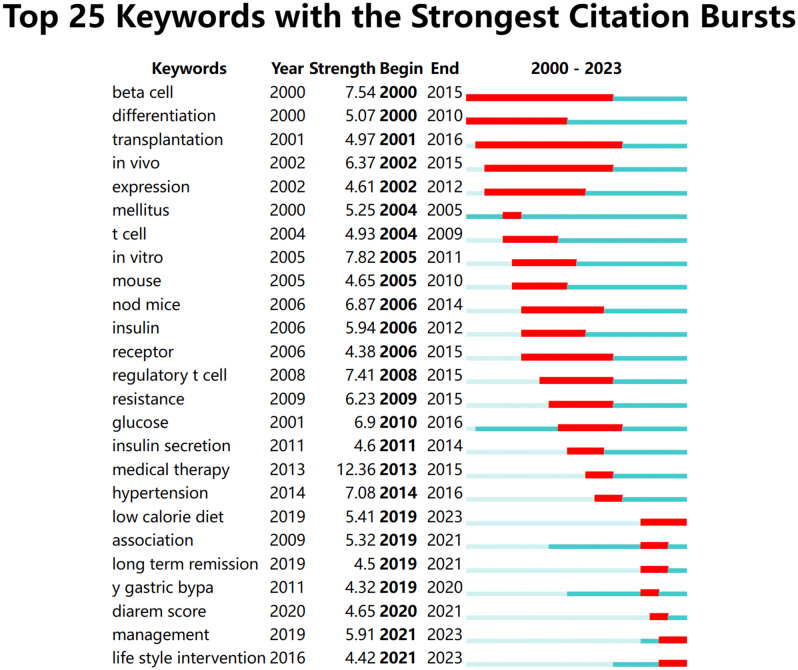
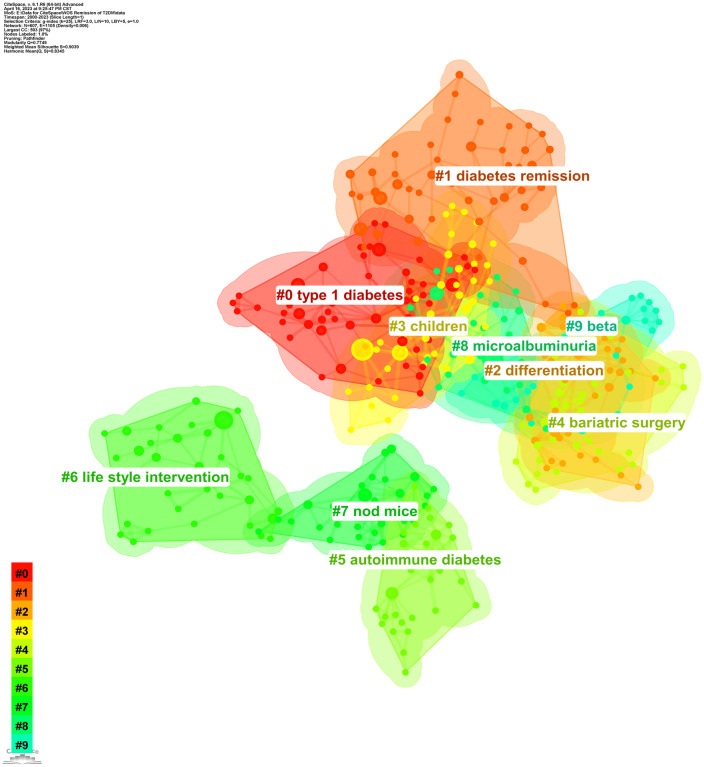
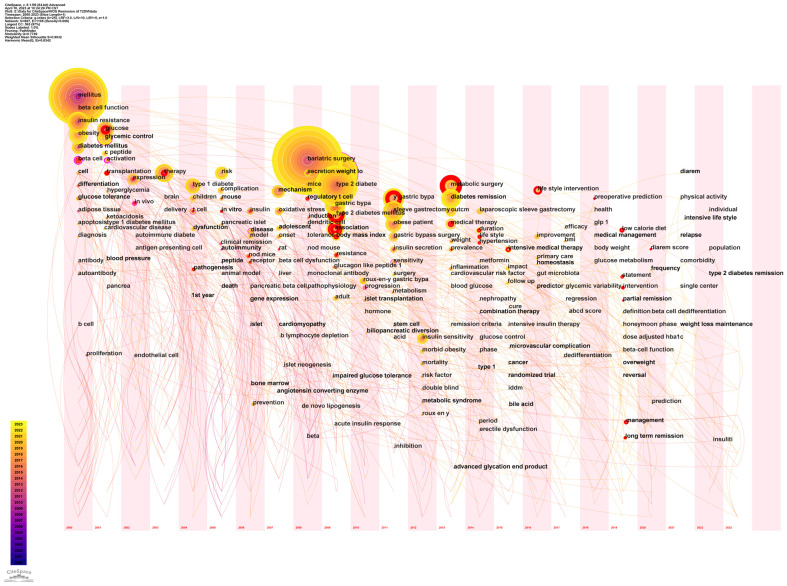
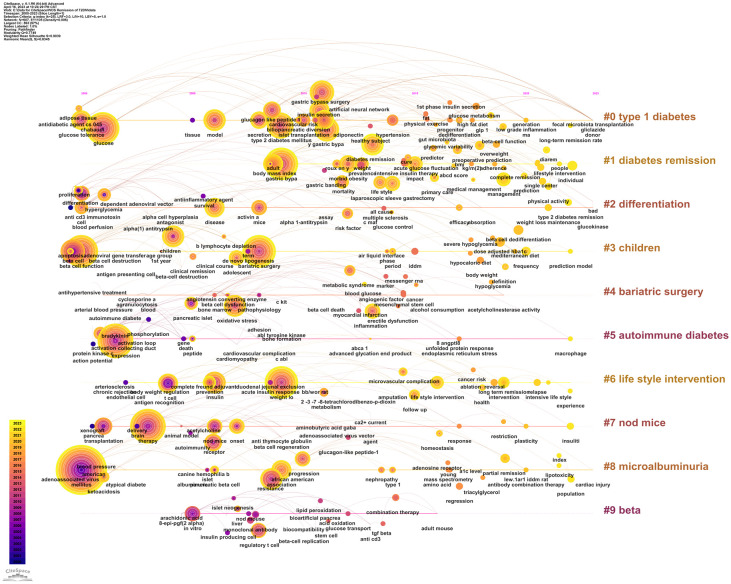
Results: A total of 970 English articles were procured, and the annual publication volume manifested a steady growth trend. Most of the articles originated from America (n=342, 35.26%), succeeded by China and England. Pertaining to institutions, the University of Newcastle in England proliferated the most articles (n=36, 3.71%). Taylor R authored the most articles (n=35, 3.61%), and his articles were also the most co-cited (n=1756 times). Obesity Surgery dominated in terms of published articles (n=81, 8.35%). "Bariatric surgery" was the most prevalently used keyword. The keyword-clustering map revealed that the research predominantly centered on diabetes remission, type 1 diabetes, bariatric surgery, and lifestyle interventions. The keyword emergence and keyword time-zone maps depicted hotspots and shifts in the domain of diabetes remission. Initially, the hotspots were primarily fundamental experiments probing the feasibilities and mechanisms of diabetes remission, such as transplantation. Over the course, the research trajectory transitioned from basic to clinical concerning diabetes remission through bariatric surgery, lifestyle interventions, and alternative strategies.
Conclusion: Over the preceding 20 years, the domain of diabetes remission has flourished globally. Bariatric surgery and lifestyle interventions bestow unique advantages for diabetes remission. Via the maps, the developmental milieu, research foci, and avant-garde trends in this domain are cogently portrayed, offering guidance for scholars.
Keywords: Citespace; VOSviewer; bibliometric study; diabetes mellitus; remission.
Copyright © 2023 Yang, He, Chen, Chen, Chen and Liu.
Conflict of interest statement
The authors declare that the research was conducted in the absence of any commercial or financial relationships that could be construed as a potential conflict of interest.
Figures
Similar articles
-
[Research hot spots and trends of keratoconus in China: a bibliometric analysis].Zhonghua Yan Ke Za Zhi. 2024 Feb 11;60(2):156-167. doi: 10.3760/cma.j.cn112142-20231009-00126. Zhonghua Yan Ke Za Zhi. 2024. PMID: 38296321 Review. Chinese.
-
Global status and trends in type 2 diabetes remission from 2002 to 2022: A bibliometric and visual analysis.Medicine (Baltimore). 2025 May 2;104(18):e42257. doi: 10.1097/MD.0000000000042257. Medicine (Baltimore). 2025. PMID: 40324218 Free PMC article.
-
Research Trends in the Application of Artificial Intelligence in Oncology: A Bibliometric and Network Visualization Study.Front Biosci (Landmark Ed). 2022 Aug 31;27(9):254. doi: 10.31083/j.fbl2709254. Front Biosci (Landmark Ed). 2022. PMID: 36224012
-
Global trends and hotspots of type 2 diabetes in children and adolescents: A bibliometric study and visualization analysis.World J Diabetes. 2025 Jan 15;16(1):96032. doi: 10.4239/wjd.v16.i1.96032. World J Diabetes. 2025. PMID: 39817223 Free PMC article.
-
Scientific knowledge graph and trend analysis of Tuina: A bibliometric analysis.Complement Ther Med. 2023 Dec;79:103005. doi: 10.1016/j.ctim.2023.103005. Epub 2023 Nov 14. Complement Ther Med. 2023. PMID: 37972695
Cited by
-
Global Trends in Diabetic Foot Research (2004-2023): A Bibliometric Study Based on the Scopus Database.Int J Environ Res Public Health. 2025 Mar 21;22(4):463. doi: 10.3390/ijerph22040463. Int J Environ Res Public Health. 2025. PMID: 40283692 Free PMC article. Review.
-
Worldwide productivity and research trend of publications concerning SIAD: a bibliometric study.Front Endocrinol (Lausanne). 2024 Mar 5;15:1297164. doi: 10.3389/fendo.2024.1297164. eCollection 2024. Front Endocrinol (Lausanne). 2024. PMID: 38505746 Free PMC article.
-
Global hotspots and trends of nutritional supplements for sick populations from 2000 to 2024.Front Nutr. 2025 Jan 28;12:1497207. doi: 10.3389/fnut.2025.1497207. eCollection 2025. Front Nutr. 2025. PMID: 39935585 Free PMC article.
References
-
- IDF diabetes atlas. 10th ed. International Diabetes Federation; (2022). Available at: http://www.diabetesatlas.org/.
Publication types
MeSH terms
Substances
LinkOut - more resources
Full Text Sources
Medical
Miscellaneous