

Diagnostic potential of energy metabolism-related genes in heart failure with preserved ejection fraction
- PMID: 38089628
- PMCID: PMC10711684
- DOI: 10.3389/fendo.2023.1296547
Diagnostic potential of energy metabolism-related genes in heart failure with preserved ejection fraction
Abstract
Background: Heart failure with preserved ejection fraction (HFpEF) is associated with changes in cardiac metabolism that affect energy supply in the heart. However, there is limited research on energy metabolism-related genes (EMRGs) in HFpEF.
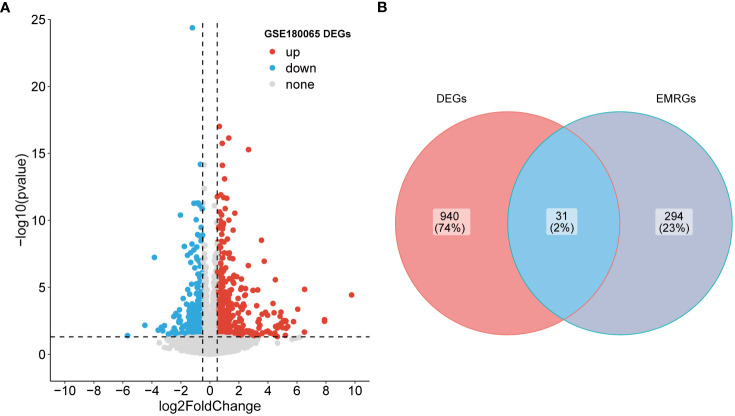
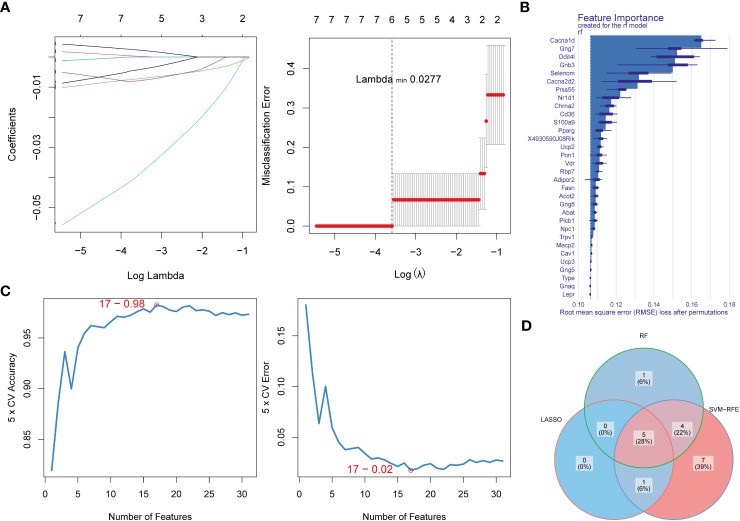
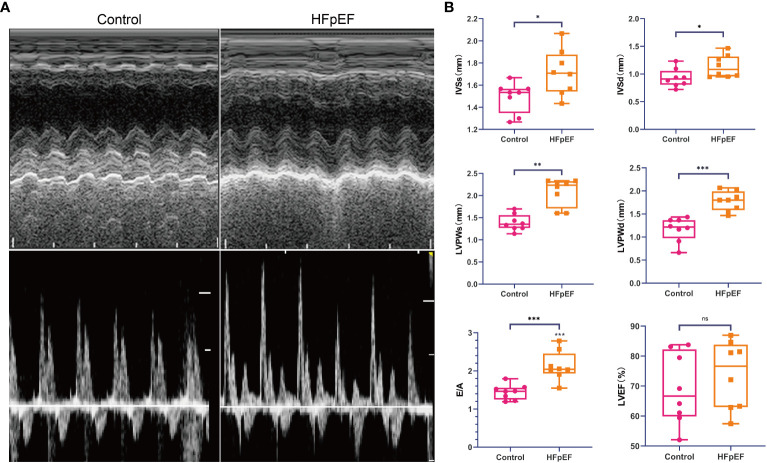
Methods: The HFpEF mouse dataset (GSE180065, containing heart tissues from 10 HFpEF and five control samples) was sourced from the Gene Expression Omnibus database. Gene expression profiles in HFpEF and control groups were compared to identify differentially expressed EMRGs (DE-EMRGs), and the diagnostic biomarkers with diagnostic value were screened using machine learning algorithms. Meanwhile, we constructed a biomarker-based nomogram model for its predictive power, and functionality of diagnostic biomarkers were conducted using single-gene gene set enrichment analysis, drug prediction, and regulatory network analysis. Additionally, consensus clustering analysis based on the expression of diagnostic biomarkers was utilized to identify differential HFpEF-related genes (HFpEF-RGs). Immune microenvironment analysis in HFpEF and subtypes were performed for analyzing correlations between immune cells and diagnostic biomarkers as well as HFpEF-RGs. Finally, qRT-PCR analysis on the HFpEF mouse model was used to validate the expression levels of diagnostic biomarkers.
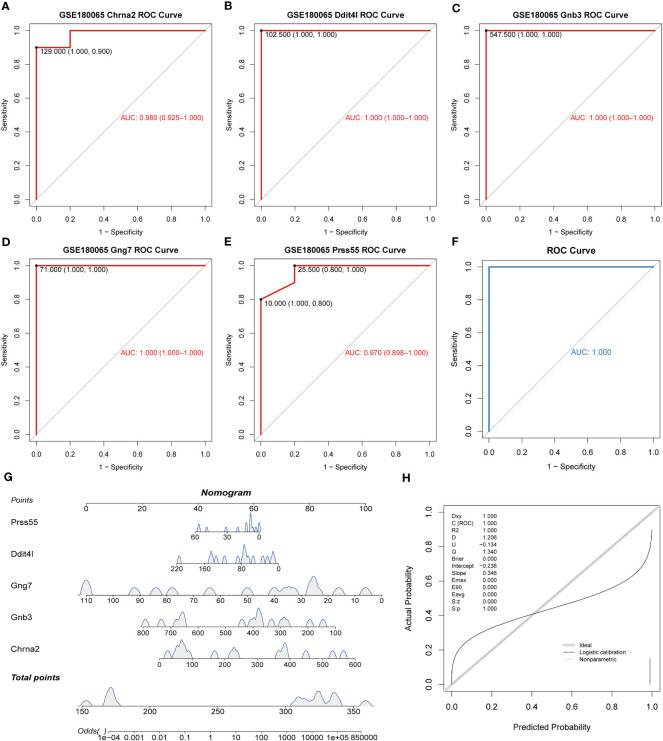
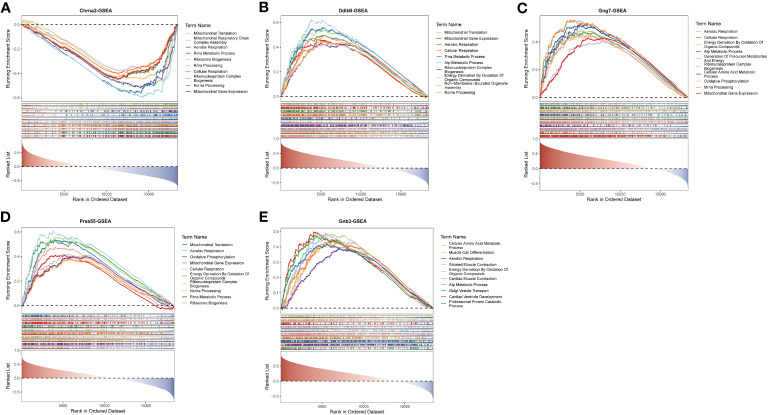
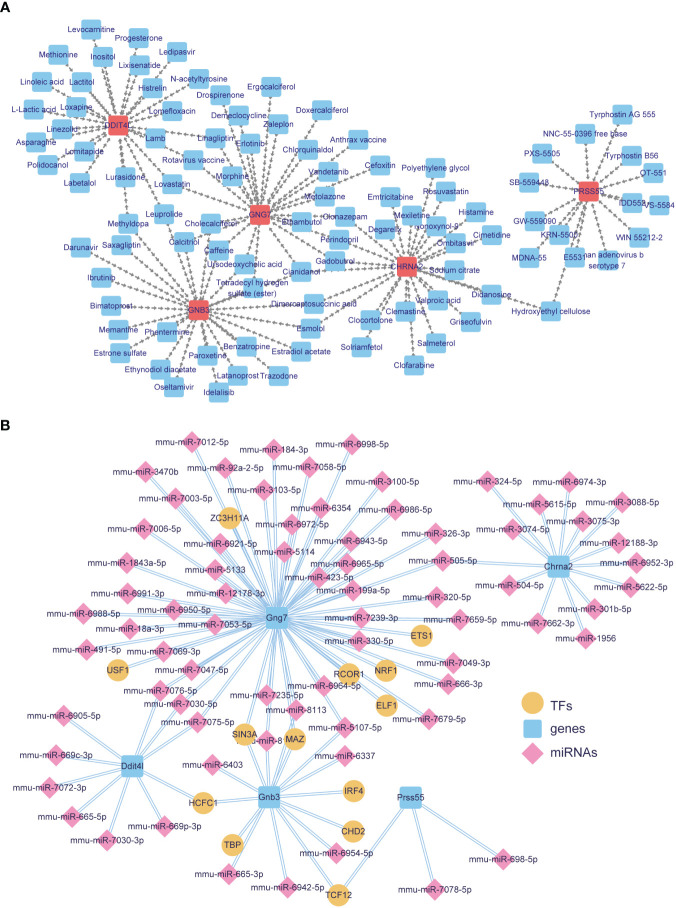
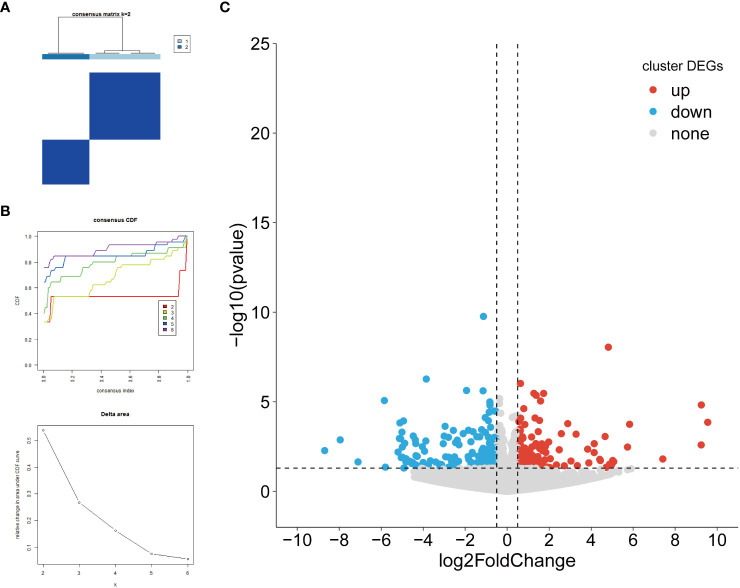
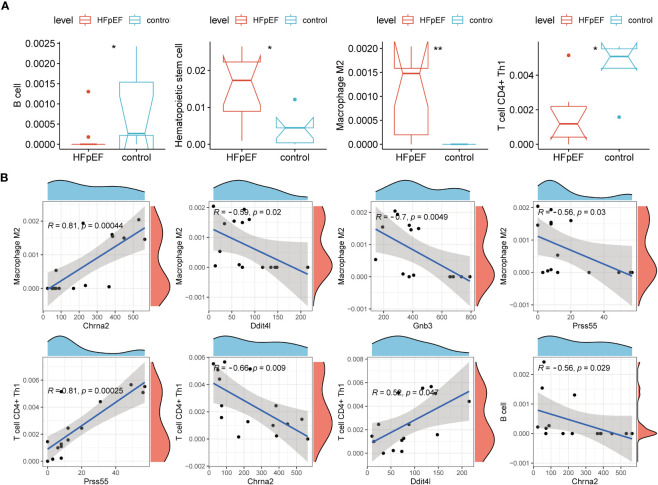
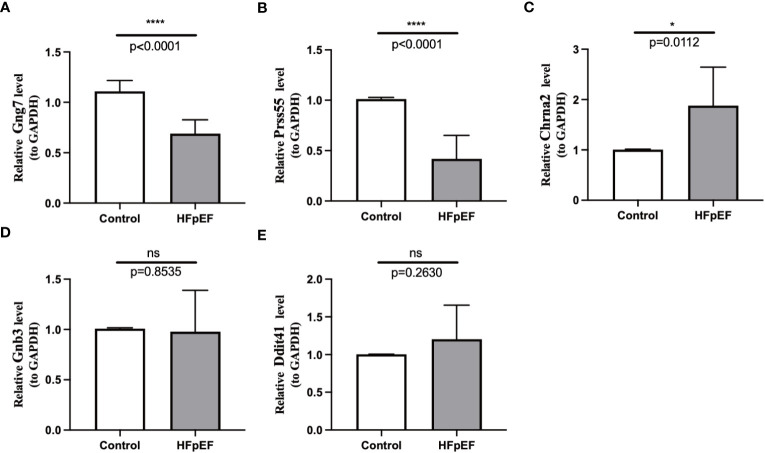
Results: We selected 5 biomarkers (Chrna2, Gnb3, Gng7, Ddit4l, and Prss55) that showed excellent diagnostic performance. The nomogram model we constructed demonstrated high predictive power. Single-gene gene set enrichment analysis revealed enrichment in aerobic respiration and energy derivation. Further, various miRNAs and TFs were predicted by Gng7, such as Gng7-mmu-miR-6921-5p, ETS1-Gng7. A lot of potential therapeutic targets were predicted as well. Consensus clustering identified two distinct subtypes of HFpEF. Functional enrichment analysis highlighted the involvement of DEGs-cluster in protein amino acid modification and so on. Additionally, we identified five HFpEF-RGs (Kcnt1, Acot1, Kcnc4, Scn3a, and Gpam). Immune analysis revealed correlations between Macrophage M2, T cell CD4+ Th1 and diagnostic biomarkers, as well as an association between Macrophage and HFpEF-RGs. We further validated the expression trends of the selected biomarkers through experimental validation.
Conclusion: Our study identified 5 diagnostic biomarkers and provided insights into the prediction and treatment of HFpEF through drug predictions and network analysis. These findings contribute to a better understanding of HFpEF and may guide future research and therapy development.
Keywords: diagnostic biomarkers; energy metabolism-related genes; heart failure with preserved ejection fraction; immunoscape; machine learning; targeted drug prediction.
Copyright © 2023 Gou, Zhao, Dong, Liang and You.
Conflict of interest statement
The authors declare that the research was conducted in the absence of any commercial or financial relationships that could be construed as a potential conflict of interest.
Figures
Similar articles
-
Exosomal microRNAs miR-30d-5p and miR-126a-5p Are Associated with Heart Failure with Preserved Ejection Fraction in STZ-Induced Type 1 Diabetic Rats.Int J Mol Sci. 2022 Jul 6;23(14):7514. doi: 10.3390/ijms23147514. Int J Mol Sci. 2022. PMID: 35886860 Free PMC article.
-
Identification of ageing-associated gene signatures in heart failure with preserved ejection fraction by integrated bioinformatics analysis and machine learning.Genes Dis. 2024 Dec 3;12(4):101478. doi: 10.1016/j.gendis.2024.101478. eCollection 2025 Jul. Genes Dis. 2024. PMID: 40330147 Free PMC article.
-
Inhibition of ferroptosis reverses heart failure with preserved ejection fraction in mice.J Transl Med. 2024 Feb 24;22(1):199. doi: 10.1186/s12967-023-04734-y. J Transl Med. 2024. PMID: 38402404 Free PMC article.
-
Heart Failure with Reduced Ejection Fraction (HFrEF) and Preserved Ejection Fraction (HFpEF): The Diagnostic Value of Circulating MicroRNAs.Cells. 2019 Dec 16;8(12):1651. doi: 10.3390/cells8121651. Cells. 2019. PMID: 31888288 Free PMC article. Review.
-
Diagnostic performance of microRNAs in the detection of heart failure with reduced or preserved ejection fraction: a systematic review and meta-analysis.Eur J Heart Fail. 2022 Dec;24(12):2212-2225. doi: 10.1002/ejhf.2700. Epub 2022 Oct 27. Eur J Heart Fail. 2022. PMID: 36161443 Free PMC article.
Cited by
-
Targeting Macrophage Phenotype for Treating Heart Failure: A New Approach.Drug Des Devel Ther. 2024 Nov 5;18:4927-4942. doi: 10.2147/DDDT.S486816. eCollection 2024. Drug Des Devel Ther. 2024. PMID: 39525046 Free PMC article. Review.
-
A Novel KIF4A-related Model for Predicting Immunotherapy Response and Prognosis in Kidney Renal Clear Cell Carcinoma.Comb Chem High Throughput Screen. 2025;28(4):691-710. doi: 10.2174/0113862073296897240212114403. Comb Chem High Throughput Screen. 2025. PMID: 38357945
-
Advances in pathophysiological mechanisms and therapeutic efficacy of exercise rehabilitation in patients with heart failure with preserved ejection fraction.Front Cardiovasc Med. 2025 May 27;12:1598878. doi: 10.3389/fcvm.2025.1598878. eCollection 2025. Front Cardiovasc Med. 2025. PMID: 40495991 Free PMC article. Review.
References
MeSH terms
Substances
LinkOut - more resources
Full Text Sources
Medical
Research Materials
Miscellaneous