. 2023 Nov 27:14:1263988.
doi: 10.3389/fimmu.2023.1263988. eCollection 2023.

Identification of autophagy-related genes in osteoarthritis articular cartilage and their roles in immune infiltration

Affiliations

Identification of autophagy-related genes in osteoarthritis articular cartilage and their roles in immune infiltration

Jun Qin et al. Front Immunol. .

Abstract

Background: Autophagy plays a critical role in the progression of osteoarthritis (OA), mainly by regulating inflammatory and immune responses. However, the underlying mechanisms remain unclear. This study aimed to investigate the potential relevance of autophagy-related genes (ARGs) associated with infiltrating immune cells in OA.

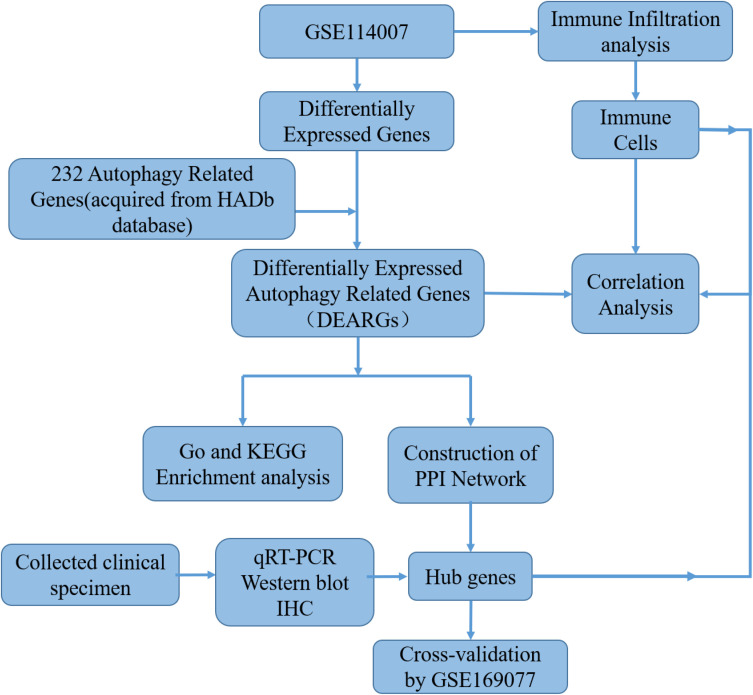
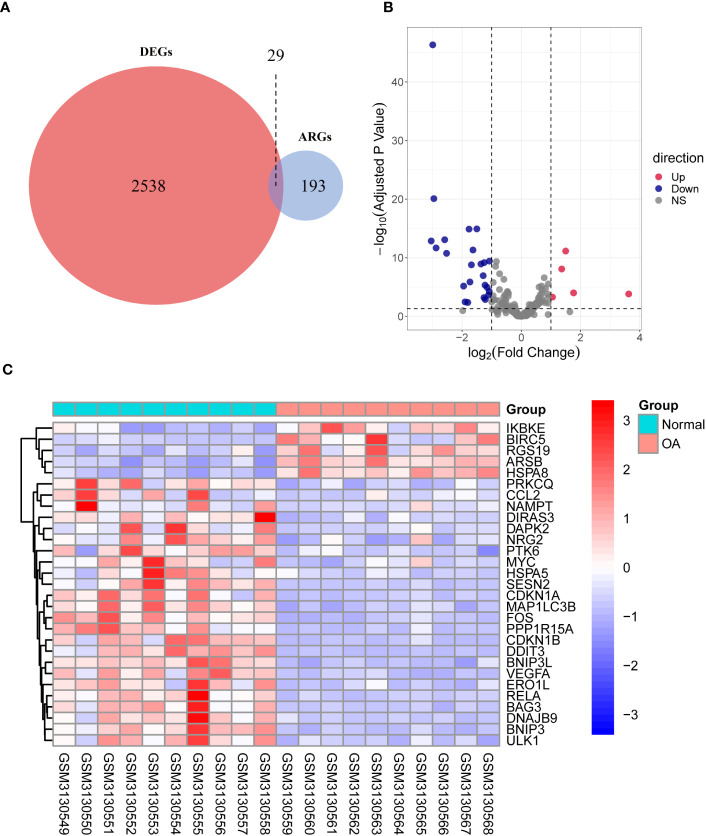
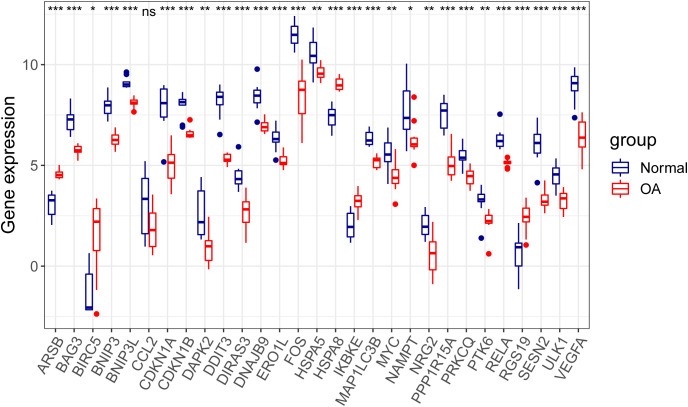
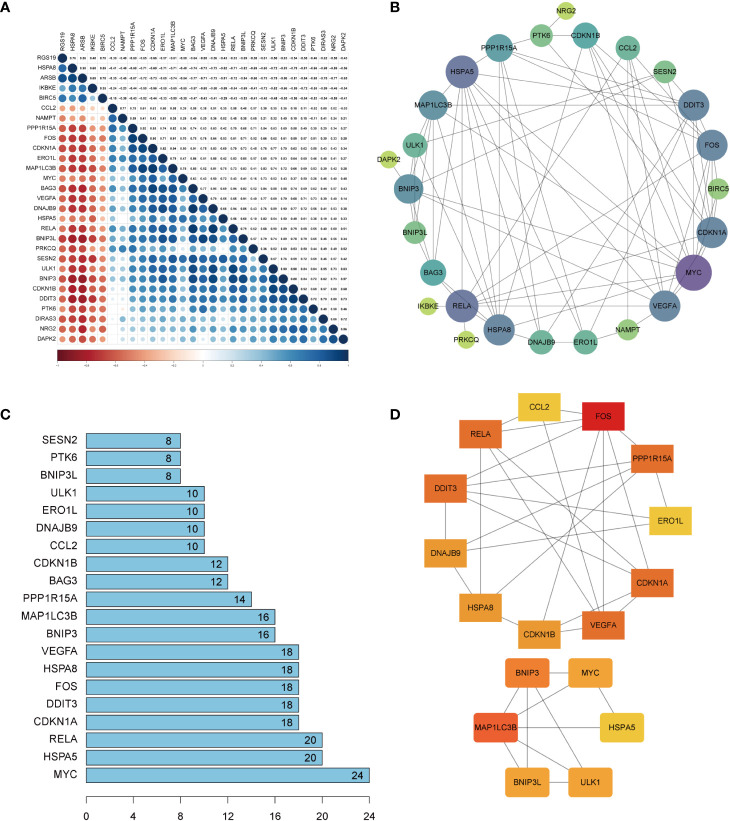
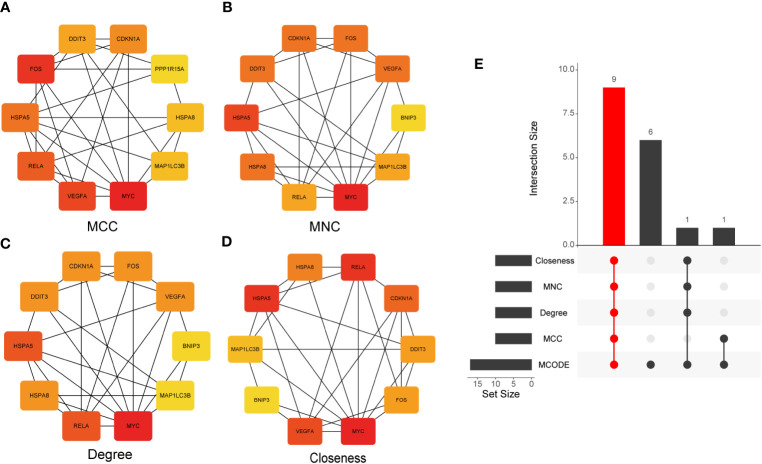
Methods: GSE114007, GSE169077, and ARGs were obtained from the Gene Expression Omnibus (GEO) database and the Human Autophagy database. R software was used to identify the differentially expressed autophagy-related genes (DEARGs) in OA. Functional enrichment and protein-protein interaction (PPI) analyses were performed to explore the role of DEARGs in OA cartilage, and then Cytoscape was utilized to screen hub ARGs. Single-sample gene set enrichment analysis (ssGSEA) was used to conduct immune infiltration analysis and evaluate the potential correlation of key ARGs and immune cell infiltration. Then, the expression levels of hub ARGs in OA were further verified by the GSE169077 and qRT-PCR. Finally, Western blotting and immunohistochemistry were used to validate the final hub ARGs.

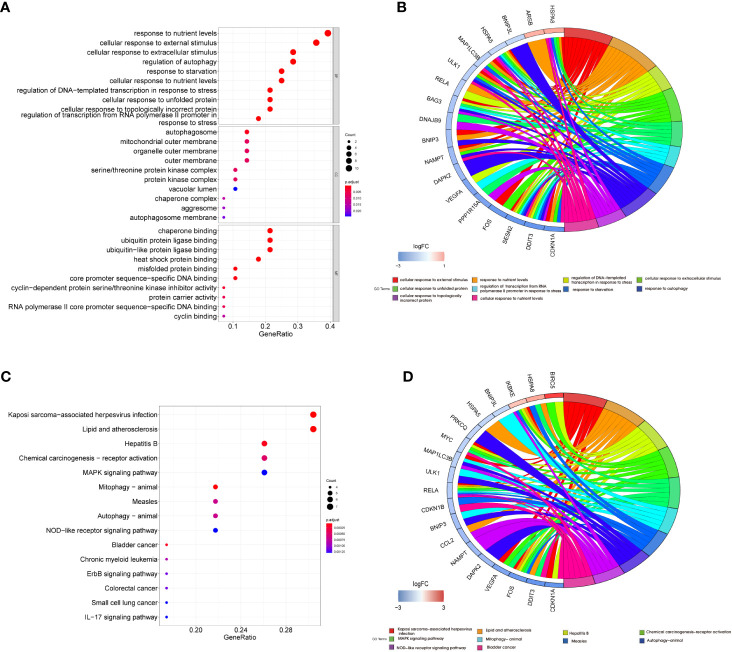
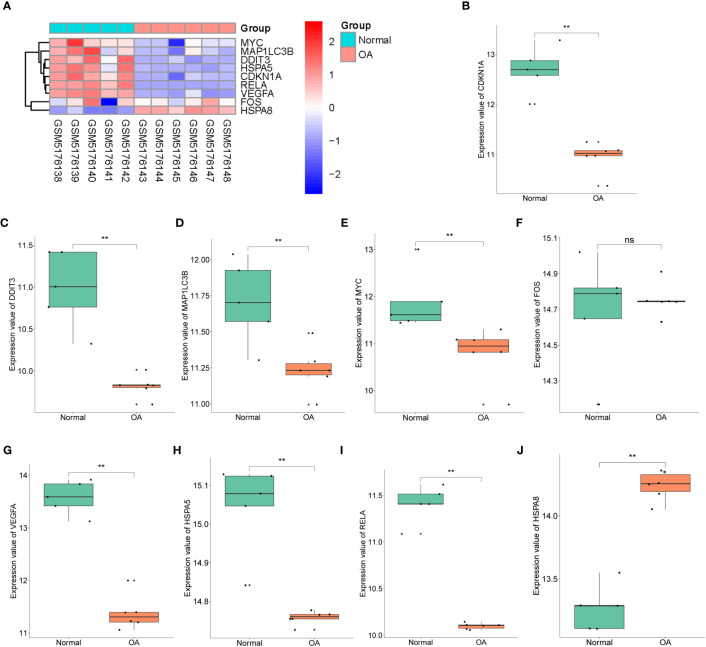
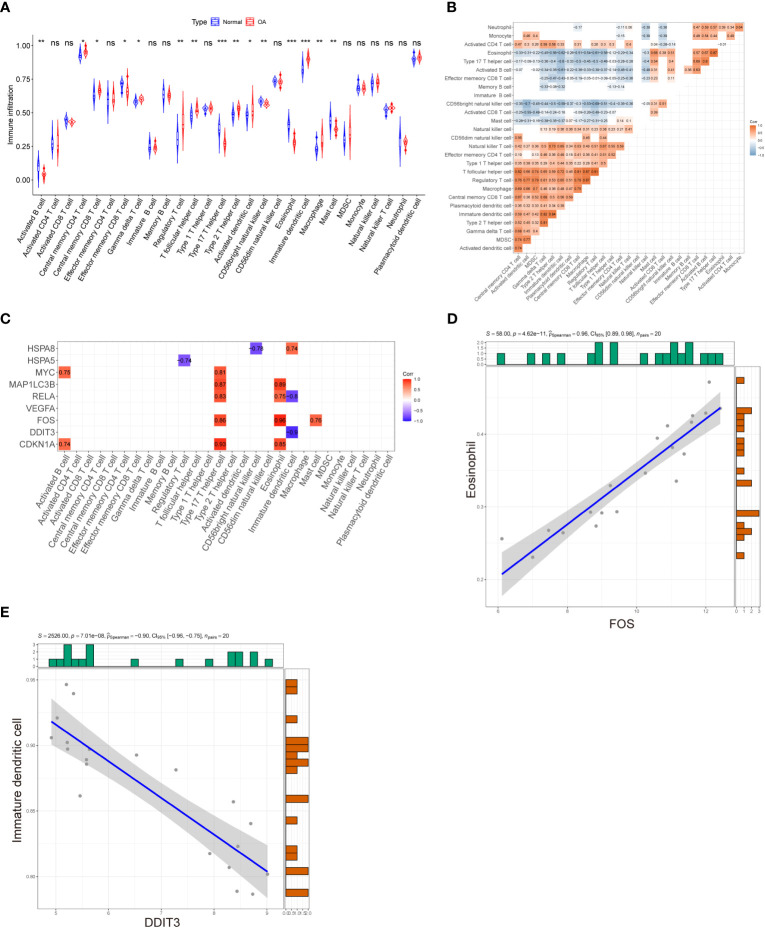
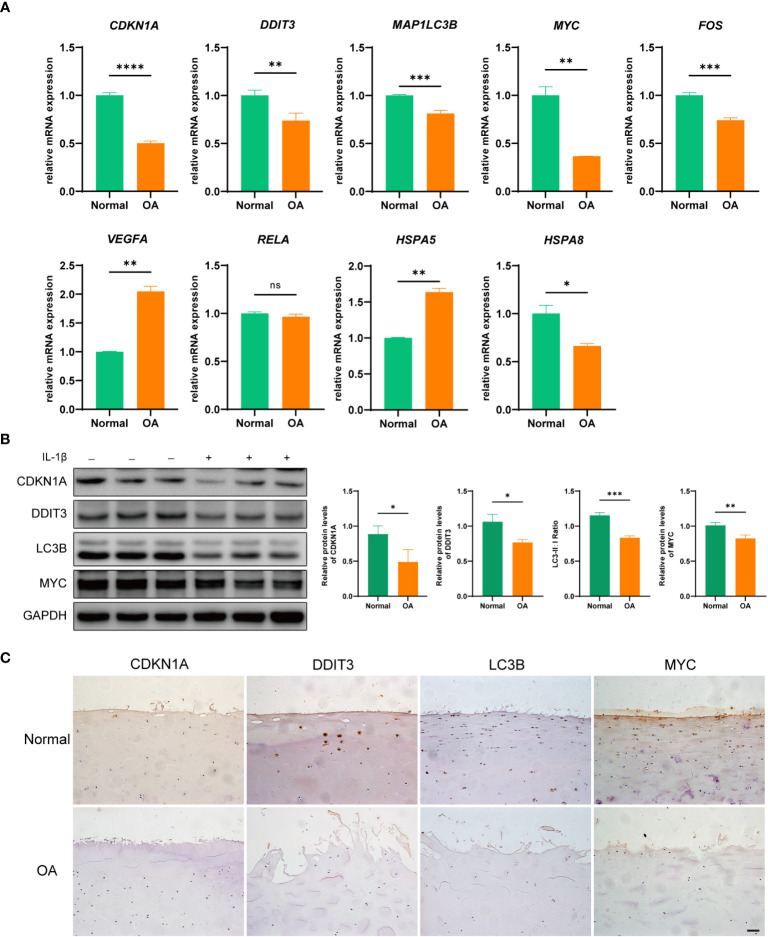
Results: A total of 24 downregulated genes and five upregulated genes were identified, and these genes were enriched in autophagy, mitophagy, and inflammation-related pathways. The intersection results identified nine hub genes, namely, CDKN1A, DDIT3, FOS, VEGFA, RELA, MAP1LC3B, MYC, HSPA5, and HSPA8. GSE169077 and qRT-PCR validation results showed that only four genes, CDKN1A, DDT3, MAP1LC3B, and MYC, were consistent with the bioinformatics analysis results. Western blotting and immunohistochemical (IHC) showed that the expression of these four genes was significantly downregulated in the OA group, which is consistent with the qPCR results. Immune infiltration correlation analysis indicated that DDIT3 was negatively correlated with immature dendritic cells in OA, and FOS was positively correlated with eosinophils.

Conclusion: CDKN1A, DDIT3, MAP1LC3B, and MYC were identified as ARGs that were closely associated with immune infiltration in OA cartilage. Among them, DDIT3 showed a strong negative correlation with immature dendritic cells. This study found that the interaction between ARGs and immune cell infiltration may play a crucial role in the pathogenesis of OA; however, the specific interaction mechanism needs further research to be clarified. This study provides new insights to further understand the molecular mechanisms of immunity involved in the process of OA by autophagy.

Keywords: autophagy; bioinformatics analysis; cartilage; immune cell infiltration; osteoarthritis.


Conflict of interest statement

The authors declare that the research was conducted in the absence of any commercial or financial relationships that could be construed as a potential conflict of interest.

Figures

Figure 1
Figure 1
The workflow chart of this study.
Figure 2
Figure 2
Identification of DEARGs. (A) Veen diagram showing the DEARGs. (B) Volcano plot displaying significantly differentially expressed ARGs. Red dots represent the upregulated genes, and dark purple dots denote the downregulated genes, with thresholds of |log2FoldChange| ≥ 1 and adjusted p-value <0.05. (C) The expressions of 29 DEARGs in OA are displayed in the heatmap. Red signifies significantly upregulated ARGs, and purple indicates significantly downregulated ARGs in the samples. DEARGs, differentially expressed autophagy-related genes; ARGs, autophagy-related genes; OA, osteoarthritis.
Figure 3
Figure 3
Boxplot displaying differential expressed of 29 autophagy-related genes in OA and normal cartilage samples. p-Values were calculated using Wilcoxon test. *p < 0.05; **p < 0.01; ***p < 0.01. ns, not significant; OA, osteoarthritis.
Figure 4
Figure 4
Functional enrichment analysis of differentially expressed autophagy-related genes. Bubble plot (A) and Circor chart (B) of Gene Ontology (GO) enrichment analysis results of 29 DEARGs in biological process (BP), cellular component (CC), and molecular function (MF). Bubble plot (C) and Circor chart (D) of KEGG pathway enrichment analysis by DEARGs. DEARGs, differentially expressed autophagy-related genes; KEGG, Kyoto Encyclopedia of Genes and Genomes.
Figure 5
Figure 5
Correction analysis and protein–protein interaction (PPI) analysis of the 29 differentially expressed autophagy-related genes. (A) Spearman’s correction analysis of the 29 differentially expressed autophagy-related genes. (B) PPI network of DEARGs; three disconnected nodes were removed. Circle size represents the node degree. (C) The interaction number of the top 20 DEARGs. (D) Two DEARG clusters were obtained using the MCODE plug-ins. DEARGs, differentially expressed autophagy-related genes.
Figure 6
Figure 6
Identification of hub genes. (A–D) The PPI network constructed by 26 DEARGs was calculated using four algorithms, namely, MCC, MNC, Degree, and Closeness, and the top 10 genes were selected as hub genes. (E) UpSet diagram displays the intersection of five different algorithms, resulting in nine shared hub genes. PPI, protein–protein interaction; DEARGs, differentially expressed autophagy-related genes.
Figure 7
Figure 7
Cross-validation of hub genes. (A) The expression levels of CDKN1A, DDIT3, FOS, VEGFA, RELA, MAP1LC3B, MYC, HSPA5, and HSPA8 were verified by GSE169077 dataset, the results of which are presented as heatmap. (B–J) Detailed expression of nine hub genes. **p < 0.001. ns, not significant.
Figure 8
Figure 8
Evaluation of immune cell infiltration and correlation analysis between hub genes and immune cell infiltration. (A) Violin plot of differential infiltrating fractions of all 28 immune cells between OA and normal samples. (B) Spearman’s correlation heatmap demonstrates the correlation of all 28 immune cells. The blank squares in the upper left corner represent p-values >0.05, red presents a positive correlation, and blue denotes a negative correlation. (C) Correlation heatmap displaying the correlations between nine hub genes and 28 infiltrating immune cells. The red and purple squares indicate that the hub genes have a significant correlation with infiltrating immune cells, and the blank squares represent p-values >0.05 for the association of hub genes with infiltrating immune cells. (D) The most positively correlated autophagy–immunocyte gene pair is FOS–Eosinophil. (E) The most negatively correlated autophagy–immunocyte gene pair is DDIT3–Immature dendritic cell. p-Values were calculated using the Wilcoxon test. ***p < 0.001; **p < 0.01; *p < 0.05. ns, not significant.
Figure 9
Figure 9
Validation of hub DEARGs using an in vitro OA cell model. (A) Boxplots show mRNA expression levels of nine hub genes that were measured by qRT-PCR in OA and normal chondrocytes. (B) The expression levels of CDKN1A, DDIT3, MAPLC3B, and MYC were detected by Western blotting. (C) The expression levels of CDKN1A, DDIT3, MAPLC3B, and MYC were detected by IHC. *p < 0.05, **p < 0.01, ***p < 0.001, and ****p < 0.0001. ns, not significant; DEARGs, differentially expressed autophagy-related genes; OA, osteoarthritis; IHC, immunohistochemistry. Scale bar, 50 μm.

References

    1. Loeser RF, Collins JA, Diekman BO. Ageing and the pathogenesis of osteoarthritis. Nat Rev Rheumatol (2016) 12(7):412–20. doi: 10.1038/nrrheum.2016.65 - DOI - PMC - PubMed
    1. Choi WS, Lee G, Song WH, Koh JT, Yang J, Kwak JS, et al. The ch25h-cyp7b1-roralpha axis of cholesterol metabolism regulates osteoarthritis. Nature (2019) 566(7743):254–8. doi: 10.1038/s41586-019-0920-1 - DOI - PubMed
    1. Gregori D, Giacovelli G, Minto C, Barbetta B, Gualtieri F, Azzolina D, et al. Association of pharmacological treatments with long-term pain control in patients with knee osteoarthritis: A systematic review and meta-analysis. JAMA (2018) 320(24):2564–79. doi: 10.1001/jama.2018.19319 - DOI - PMC - PubMed
    1. Hunter DJ, Bierma-Zeinstra S. Osteoarthritis. Lancet (2019) 393(10182):1745–59. doi: 10.1016/s0140-6736(19)30417-9 - DOI - PubMed
    1. Robinson WH, Lepus CM, Wang Q, Raghu H, Mao R, Lindstrom TM, et al. Low-grade inflammation as a key mediator of the pathogenesis of osteoarthritis. Nat Rev Rheumatol (2016) 12(10):580–92. doi: 10.1038/nrrheum.2016.136 - DOI - PMC - PubMed

Publication types