Comment
. 2023 Nov 27:14:1292568.
doi: 10.3389/fimmu.2023.1292568. eCollection 2023.

Rapid transient and longer-lasting innate cytokine changes associated with adaptive immunity after repeated SARS-CoV-2 BNT162b2 mRNA vaccinations

Affiliations
Comment

Rapid transient and longer-lasting innate cytokine changes associated with adaptive immunity after repeated SARS-CoV-2 BNT162b2 mRNA vaccinations

Margherita Rosati et al. Front Immunol. .

Abstract

Introduction: Cytokines and chemokines play an important role in shaping innate and adaptive immunity in response to infection and vaccination. Systems serology identified immunological parameters predictive of beneficial response to the BNT162b2 mRNA vaccine in COVID-19 infection-naïve volunteers, COVID-19 convalescent patients and transplant patients with hematological malignancies. Here, we examined the dynamics of the serum cytokine/chemokine responses after the 3rd BNT162b2 mRNA vaccination in a cohort of COVID-19 infection-naïve volunteers.

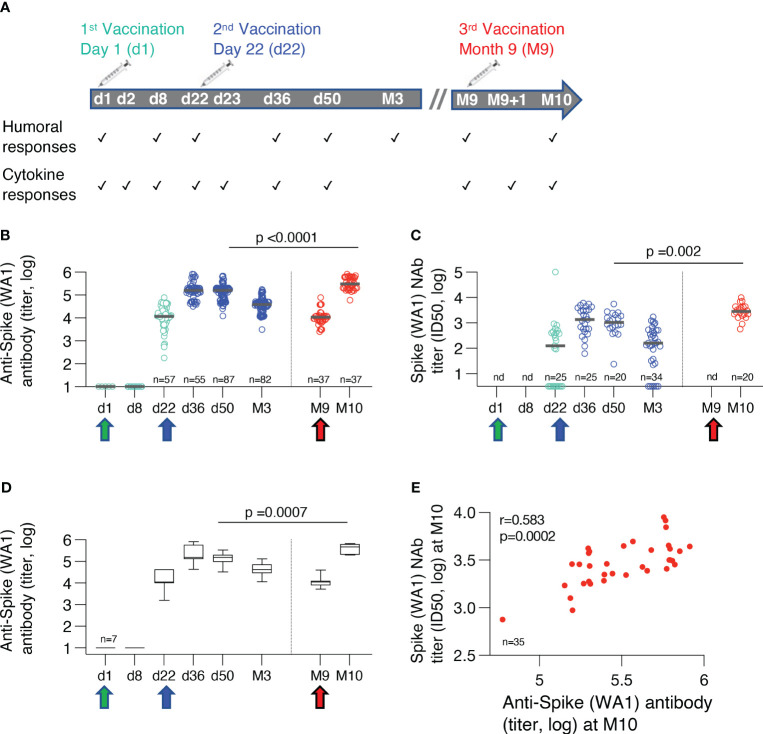
Methods: We measured serum cytokine and chemokine responses after the 3rd dose of the BNT162b2 mRNA (Pfizer/BioNtech) vaccine in COVID-19 infection-naïve individuals by a chemiluminescent assay and ELISA. Anti-Spike binding antibodies were measured by ELISA. Anti-Spike neutralizing antibodies were measured by a pseudotype assay.

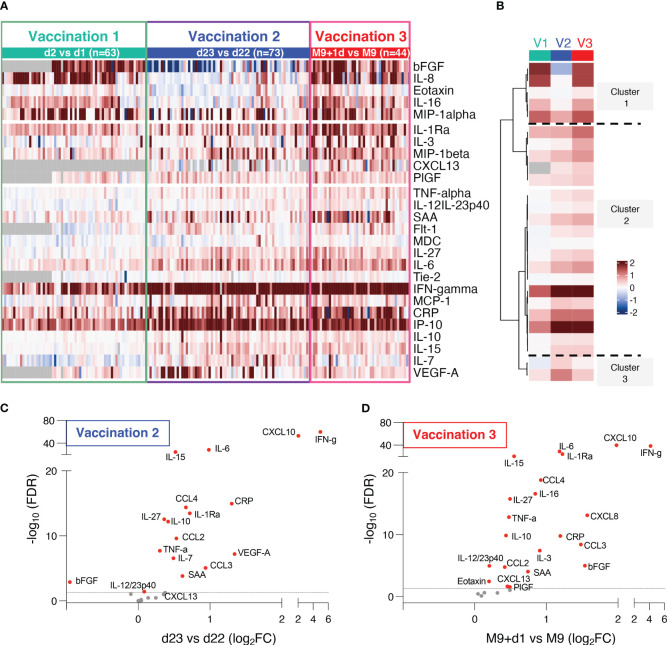
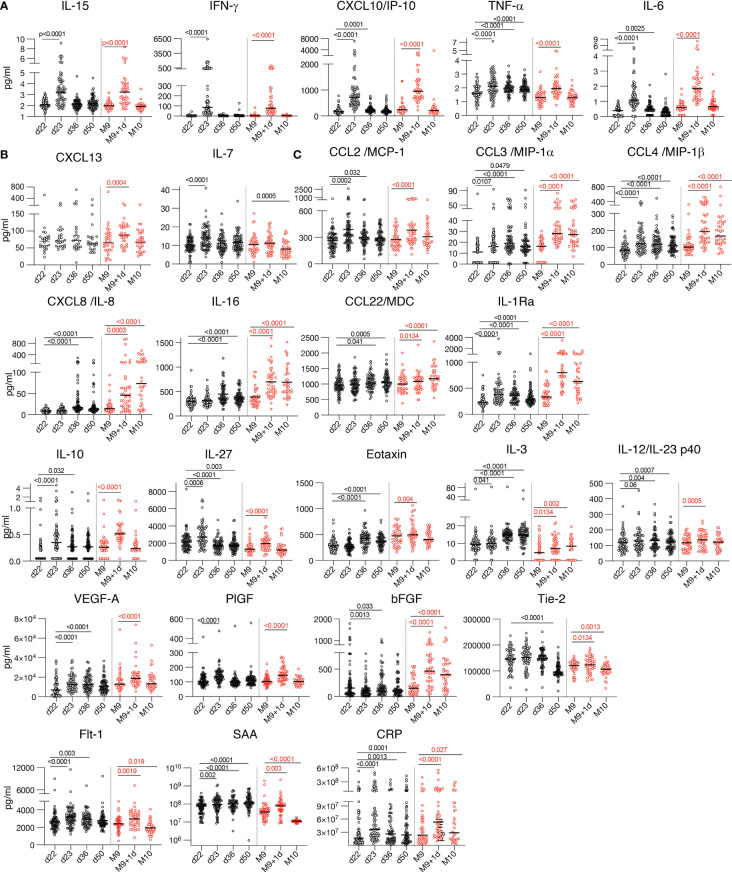
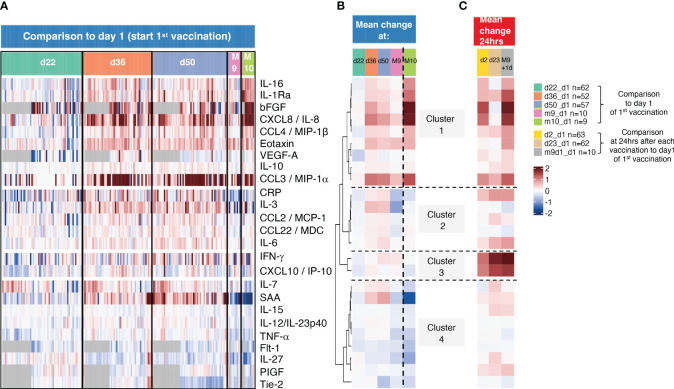
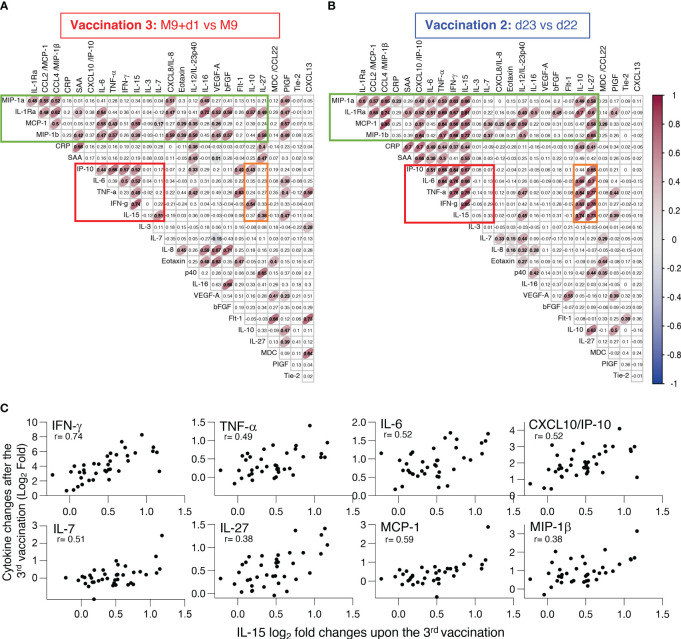
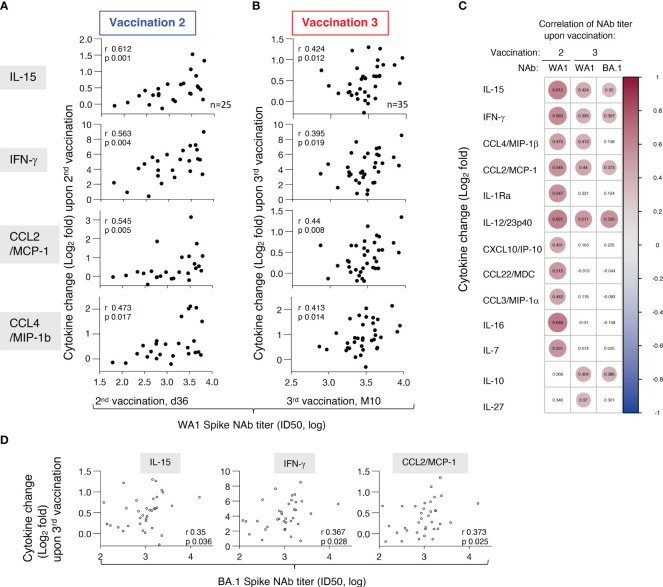
Results: Comparison to responses found after the 1st and 2nd vaccinations showed persistence of the coordinated responses of several cytokine/chemokines including the previously identified rapid and transient IL-15, IFN-γ, CXCL10/IP-10, TNF-α, IL-6 signature. In contrast to the transient (24hrs) effect of the IL-15 signature, an inflammatory/anti-inflammatory cytokine signature (CCL2/MCP-1, CCL3/MIP-1α, CCL4/MIP-1β, CXCL8/IL-8, IL-1Ra) remained at higher levels up to one month after the 2nd and 3rd booster vaccinations, indicative of a state of longer-lasting innate immune change. We also identified a systemic transient increase of CXCL13 only after the 3rd vaccination, supporting stronger germinal center activity and the higher anti-Spike antibody responses. Changes of the IL-15 signature, and the inflammatory/anti-inflammatory cytokine profile correlated with neutralizing antibody levels also after the 3rd vaccination supporting their role as immune biomarkers for effective development of vaccine-induced humoral responses.

Conclusion: These data revealed that repeated SARS-Cov-2 BNT162b2 mRNA vaccination induces both rapid transient as well as longer-lasting systemic serum cytokine changes associated with innate and adaptive immune responses.

Clinical trial registration: Clinicaltrials.gov, identifier NCT04743388.

Keywords: CXCL10/IP10; CXCL13; IFN-g; IL-15; Innate immunity; TNF-a; anti-spike neutralizing antibody; myeloid cell biomarkers.


Conflict of interest statement

Author ET has received honoraria from Astra/Zeneca and Pfizer. Authors PH and SK were employed by the company Leidos Biomedical Research, Inc. The remaining authors declare that the research was conducted in the absence of any commercial or financial relationships that could be construed as a potential conflict of interest. The author(s) declared that they were an editorial board member of Frontiers, at the time of submission. This had no impact on the peer review process and the final decision.

Figures

Figure 1
Figure 1
BNT162b2 mRNA cohorts and humoral immune responses. (A) Time points of measurements of adaptive and innate immune responses over the course of three BNT162b2 mRNA vaccinations. (B) Binding antibodies against ancestral trimeric Spike WA1 were measured by ELISA. Antibody titers from some individual time points have been reported previously (10, 17, 18). The Ab titers were compared at one month after the 2nd (n=87) and the 3rd vaccination (n=36). The p-value is from unpaired, non-parametric t test, Mann-Whitney. Median values are shown with black bars. (C) Neutralizing antibodies (NAb) were assessed using HIV-1NLΔEnv-NanoLuc derived pseudotype virus assay carrying Wuhan-Hu-1 Spike mutant D614G. The NAb titers were compared at one month after the 2nd (n=25) and the 3rd vaccination (n=20). The p-value is from unpaired, non-parametric t test, Mann-Whitney. nd, not done. Median values are shown with black bars. (D) Binding antibodies against ancestral trimeric Spike WA1 were measured by ELISA in a subset of vaccine recipients for whom sequential samples were available for all the time points. Median values are shown with black bars. (E) Correlation of neutralizing (WA1 D614G) and binding Ab titers to WA1 measured at one month after the booster vaccination (Spearman r=0.583; p=0.002).
Figure 2
Figure 2
Serum cytokine and chemokine levels after BNT162b2 mRNA vaccination. (A, B) The heatmap (A) shows comparison of log2 fold changes of 26 cytokines and chemokines measured after the 1st and 2nd and 3rd vaccination. Changes compared samples collected 24hrs after vaccination to the respective day of vaccination (d2 vs d1, d23 vs d22, M9+d1 vs M9). Grey cells denote missing values for five analytes not measured for 22 participants at d1 and d2. The analysis after the 1st and 2nd vaccinations includes additional data from 7 analytes (CXCL13, bFGF, Flt-1, IL-10, IL-27, PIGF, Tie-2) which were not previously reported (10). (B) Mean log2 fold changes for each analyte and each group from data shown in (A, C, D) Volcano plots depict differentially expressed analytes after the 2nd vaccination (d23 vs d22) and (D) the 3rd vaccination (M9d+1 vs M9) using adjusted p values. Red dots indicate significant changes (FDR<0.05) capturing 17 analytes after the 2nd (C) and 21 analytes after the 3rd vaccination (D). Horizontal broken line represents FDR-adjusted p-values=0.05.
Figure 3
Figure 3
Cytokine and chemokine levels over time. Cytokine and chemokine measurements are shown over time using the Meso Scale Discovery assay and the ELISA for CXCL13 at the day of vaccination (d22, M9) and at one day after the 2nd vaccination (d23) and the 3rd vaccination (M9 + 1d). Additional measurements at 2 and 4 weeks (d36 and d50) after the 2nd vaccination and 4 weeks (M10) after the 3rd vaccination were plotted. Values (pg/ml) from individual vaccine recipients are shown after the 2nd vaccination (black symbols and after the 3rd vaccination (red symbols) and median values are shown (black lines). The p values (GraphPad Prism) are from Anova (Friedman test) for the 58 participants having 4 over time paired samples available after the 2nd vaccination and the 36 participants having 3 over time samples after the 3rd vaccination, respectively. The plots show the absolute values of all measurements: d22, d23 (n=72); d36 (n=62); d50 (n=64); M9 and M9 + 1d (n=44) and M10 (n=36). (A-C) Serum levels of 17 selected analytes among 26 analytes showing changes after the 2nd and 3rd vaccination are plotted over time: (A) cytokines belonging to the previously identified IL-15 signature; (B) Germinal center activation biomarkers CXCL13 and IL-7; (C) cytokine with pro-inflammatory, anti-inflammatory or dual function.
Figure 4
Figure 4
Sequential analysis of biomarkers with longer-lasting changes. (A) The heatmap shows log2 fold changes comparing all sequential measurements to the day 1 measurements before the 1st vaccination. d22 samples were collected before 2nd vaccination, d36, d50, and M9 before the 3rd vaccination and M10, one month after the 3rd vaccination. Grey cells denote missing values for five analytes not measured for 22 participants. (B, C) Mean log2 fold changes for each analyte and for (B) data obtained d22, d36, d50, M9 and M10 from (B, C) and data obtained 24hrs after the 1st, 2nd, and the 3rd vaccination (d2, d23, m9+d1).
Figure 5
Figure 5
Inter-relationship of the vaccine-induced effects on different serum cytokines and chemokines. (A, B) Pairwise correlations were calculated between the log2 fold changes after (A) 3rd vaccination (M9 + 1d vs M9) and (B) 2nd vaccination (d23 vs d22) for the 26 biomarkers that were affected by the vaccinations using the Spearman correlation coefficient. Significant correlations (p-value < 0.005) are represented by ellipses whose color and shape correspond to the value of the Spearman correlation coefficient with red color ( Figure 2 ) indicating a positive correlation. The red boxes identify the cluster of positive associations featuring IFN-γ, IL-15, TNF-α, IL-6 and IP-10/CXCL10. The green boxes denote the cluster of concerted interactions of inflammatory and anti-inflammatory cytokines. The orange boxes denote the cluster of IL-10 and IL-27 associated with the IL-15 cluster. (C) Scatter plots comparing the log2 fold change after the booster vaccination (M9+d1 vs M9) shown in panel A for analytes (IFN-γ, TNF-α, IL-6, CXCL10/IP-10, IL-7, IL-27, MCP-1, MIP-1β) significantly correlated to IL-15. Each dot represents the compared analytes log2 fold change for a single vaccine recipient. r and p values are shown in plots.
Figure 6
Figure 6
Association of biomarkers and vaccine-induced humoral immune responses. Univariate correlations of log2 fold changes of selected cytokines (IL-15, IFN-γ, CCL2/MCP-1, CCL4/MIP-1β, IL-1Ra) after the (A) 2nd vaccination (d23 vs d22) and (B) 3rd vaccination (M9 + 1d vs M9) and levels of anti-Spike (WA1) NAb, measured at d36 and M10, respectively. Spearman r and p values are given (calculated in R). Note the different scales of the X-axis after the 2nd and 3rd vaccination, with a tighter spread of NAb responses after the 3rd vaccination. (C) Pairwise Spearman correlations for analytes with positive correlations between cytokine fold changes and NAb titers against WA1 after the 2nd and 3rd vaccination and NAb titers against BA.1 after the 3rd vaccination. Significant correlations (p-value < 0.05) are represented by circles whose size and coloring correspond to the value of the Spearman correlation r values (calculated in R). (D) Univariate correlations of log2 fold changes of selected cytokines (IL-15, IFN-γ, CCL2/MCP-1) after the 3rd vaccination (M9 + 1d vs M9) and levels of anti-Spike BA.1 NAb, measured at M10. Spearman r and p values are given (calculated in R).

Comment on

References

    1. Gaucher D, Therrien R, Kettaf N, Angermann BR, Boucher G, Filali-Mouhim A, et al. Yellow fever vaccine induces integrated multilineage and polyfunctional immune responses. J Exp Med (2008) 205(13):3119–31. doi: 10.1084/jem.20082292 - DOI - PMC - PubMed
    1. Querec TD, Akondy RS, Lee EK, Cao W, Nakaya HI, Teuwen D, et al. Systems biology approach predicts immunogenicity of the yellow fever vaccine in humans. Nat Immunol (2009) 10(1):116–25. doi: 10.1038/ni.1688 - DOI - PMC - PubMed
    1. Zak DE, Andersen-Nissen E, Peterson ER, Sato A, Hamilton MK, Borgerding J, et al. Merck Ad5/HIV induces broad innate immune activation that predicts CD8(+) T-cell responses but is attenuated by preexisting Ad5 immunity. Proc Natl Acad Sci U.S.A. (2012) 109(50):E3503–12. doi: 10.1073/pnas.1208972109 - DOI - PMC - PubMed
    1. Andersen-Nissen E, Fiore-Gartland A, Ballweber Fleming L, Carpp LN, Naidoo AF, Harper MS, et al. Innate immune signatures to a partially-efficacious HIV vaccine predict correlates of HIV-1 infection risk. PloS Pathog (2021) 17(3):e1009363. doi: 10.1371/journal.ppat.1009363 - DOI - PMC - PubMed
    1. Wimmers F, Donato M, Kuo A, Ashuach T, Gupta S, Li C, et al. The single-cell epigenomic and transcriptional landscape of immunity to influenza vaccination. Cell (2021) 184(15):3915–35 e21. doi: 10.1016/j.cell.2021.05.039 - DOI - PMC - PubMed

Associated data