. 2023 Dec 11:6:0287.
doi: 10.34133/research.0287. eCollection 2023.

Age-Related Alterations in Peripheral Immune Landscape with Magnified Impact on Post-Stroke Brain

Affiliations

Age-Related Alterations in Peripheral Immune Landscape with Magnified Impact on Post-Stroke Brain

Jianan Lu et al. Research (Wash D C). .

Abstract

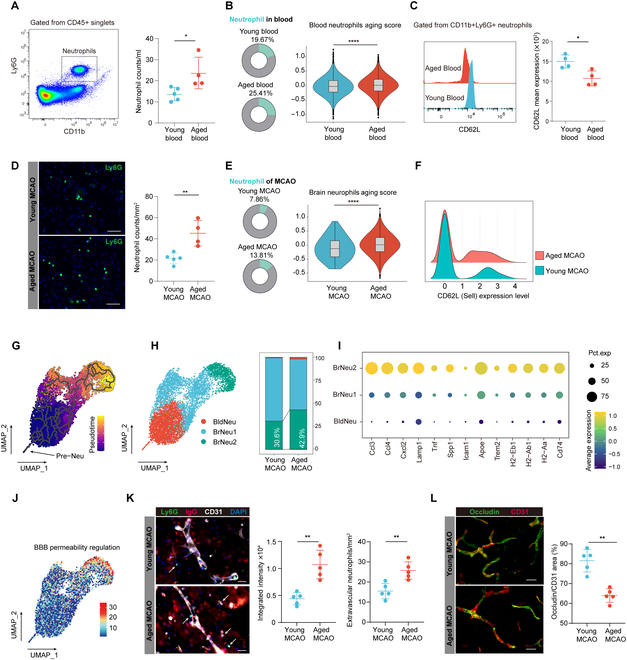
Immunosenescence refers to the multifaceted and profound alterations in the immune system brought about by aging, exerting complex influences on the pathophysiological processes of diseases that manifest upon it. Using a combination of single-cell RNA sequencing, cytometry by time of flight, and various immunological assays, we investigated the characteristics of immunosenescence in the peripheral blood of aged mice and its impact on the cerebral immune environment after ischemic stroke. Our results revealed some features of immunosenescence. We observed an increase in neutrophil counts, concurrent with accelerated neutrophil aging, characterized by altered expression of aging-associated markers like CD62L and consequential changes in neutrophil-mediated immune functions. Monocytes/macrophages in aged mice exhibited enhanced antigen-presentation capabilities. T cell profiles shifted from naive to effector or memory states, with a specific rise in T helper 1 cells and T helper 17 cells subpopulations and increased regulatory T cell activation in CD4 T cells. Furthermore, regulatory CD8 T cells marked by Klra decreased with aging, while a subpopulation of exhausted-like CD8 T cells expanded, retaining potent immunostimulatory and proinflammatory functions. Critically, these inherent disparities not only persisted but were further amplified within the ischemic hemispheres following stroke. In summary, our comprehensive insights into the key attributes of peripheral immunosenescence provide a vital theoretical foundation for understanding not only ischemic strokes but also other age-associated diseases.


Conflict of interest statement

Competing interests: The authors declare that they have no competing interests.

Figures

Fig. 1.
Fig. 1.
Characteristics of peripheral blood immune aging in mice and its impact on the immune microenvironment of the ischemic brain. (A) Peripheral blood immune cells from aged (n = 4) and young (n = 3) mice were isolated and subjected to CyTOF analysis (top). Proportion of various immune cell subsets within peripheral immune cells for each group (bottom). (B) Representative SPADE results of mass cytometry data with cluster size indicating cell proportion and color denoting CD11b expression levels (left); in the SPADE results, representation of neutrophil cell proportions in aged and young mice is displayed, identified by Ly6G as a marker (right). (C) Peripheral blood immune cells from aged and young mice, as well as CD45hi immune cells from both groups at 14 d post-MCAO, were sorted for scRNA-seq (left); UMAP projection plot showing cell clusters of immune cells in the periphery and ischemic brain of aged and young mice (right). (D) Flow cytometry analysis of the infiltrated immune cell populations in the ischemic brain of aged (n = 4 to 5) and young mice (n = 5 to 6) at 14 d post-MCAO. *P < 0.05, **P < 0.01, NS means not significant, Student t test. (E) Up-regulated functional pathways in neutrophils, MM, and T cells in the aged group compared to the young group. (F) Antigen-presenting functions and interferon pathways were significantly up-regulated in various immune cell populations in the periphery of aged mice compared to young mice. P ≤ 0.0001 in all immune cell clusters, Bonferroni-corrected Wilcoxon rank sum test. (G) Schematic of the experimental procedure in which recipient mice received peripheral immune cells from either aged or young donor mice; right panel: mice that received immune cells from aged donors showed larger infarct volumes 14 d post-MCAO compared to mice that received immune cells from young donors. n = 4 per group. **P < 0.01, Student t test. (H and I) Rotarod (H) and adhesive removal tests (I) suggest that mice received aged immune cells (n = 7 for Rotarod; n = 8 for adhesive removal) exhibited worse long-term sensory and motor function recovery than those received young immune cells (n = 6 for Rotarod; n = 7 for adhesive removal). *P < 0.05, 2-way ANOVA repeated measurement.
Fig. 2.
Fig. 2.
Aged mice exhibit accelerated neutrophil aging. (A) Schematic diagram illustrating the gating strategy for neutrophil quantification using flow cytometry, where neutrophils were identified as CD11b+Ly6G+ cells. Results indicate an increased number of peripheral blood neutrophils in aged mice (n = 4) compared to young mice (n = 5). *P < 0.05, Student t test. (B) Left panel: scRNA-seq indicating that the proportion of neutrophils among immune cells increased in the aged blood. Right panel: Violin plot showing elevated neutrophil aging scores in aged mice. ****P ≤ 0.0001, Bonferroni-corrected Wilcoxon rank sum test. (C) Flow cytometry indicating that aged mice express lower levels of CD62L in peripheral blood neutrophils than young mice, n = 4 per group, *P < 0.05, Student t test. (D) Immunofluorescence staining showing that at 14 d post-MCAO, aged mice (n = 4) had more neutrophil infiltration in the ischemic brain compared to young mice (n = 5). Scale bar = 50 μm, **P < 0.01, Student t test. (E) scRNA-seq at 14 d post-MCAO suggesting an increased proportion of neutrophils among immune cells in the ischemic brain of aged mice; violin plot showing elevated peripheral neutrophil aging scores in aged mice. ****P ≤ 0.0001, Bonferroni-corrected Wilcoxon rank sum test. (F) Ridge plot indicating down-regulated expression of Sell in neutrophils of aged ischemic brain. (G) Pseudotime trajectory of peripheral and ischemic brain neutrophils analyzed with Monocle3. (H) UMAP plot of peripheral and ischemic brain neutrophils from aged and young mice (left), and stacked bar plot showing the proportion of the 3 clusters (right). (I) BrNeu2 exhibited higher levels of chemotaxis, secretion, and antigen presentation-related genes. (J) Feature plot displaying the BBB permeability regulation score. (K and L) Immunofluorescence staining indicating that at 14 d post-MCAO, aged mice have more extravasation of endogenous IgG and neutrophils (white arrow) (K) as well as lower Occludin/CD31 area ratio (L) in the ischemic brain compared to young mice. n = 5 per group. Scale bar = 25 μm. **P < 0.01, Student t test. Pre-Neu, neutrophil precursor; BldNeu, peripheral blood neutrophils; BrNeu, neutrophil in the ischemic brain; DAPI, 4′,6-diamidino-2-phenylindole.
Fig. 3.
Fig. 3.
Changes in MM functional states in aging. (A) UMAP plot of peripheral MM from aged and young mice showing increased proportion of BldMM1 in peripheral blood of aged mice. (B) Dot plot of marker genes for the 3 MM subclusters. (C) CyTOF results indicating a higher proportion of Fcgr4+ MM (gated from CD45+CD11b+Ly6g-Ly6c+F4/80+ cells) subgroups in the peripheral blood of aged mice (n = 4) compared to young mice (n = 3). *P < 0.05. Student t test. (D) Enrichment of several antigen-presentation functional pathways in BldMM cell population. (E) Violin plot showing up-regulated genes in peripheral MM of aged mice (left) and antigen presentation function (right) were both elevated in the infiltrated MM of the aged mice compared to those of young mice at 14 d post-MCAO. ****P ≤ 0.0001, Bonferroni-corrected Wilcoxon rank sum test. (F) UMAP visualization showing the distribution and proportions of the 3 distinct MM subsets in the ischemic brain. (G) Scatter plot showing the up-regulated DEGs with a log2(fold change) > 0.25 in BrMM1 (top) or BrMM2 (bottom) compared to BrMM0, with the percentage difference along the x-axis and log2(fold change) along the y-axis. The combined z-score of percentage difference and log2(fold change) is shown in the color scale. (H) Dot plot illustrating representative functional terms of BrMM1 and BrMM2 by GO enrichment based on z-score and significance (−log10[adjusted P value]). (I and J) Quantitative comparison of the numbers of MHC-II+ (I) or Gpnmb+ (J) MM in the ischemic brain between aged and young mice. Scale bar =100 μm. Three-dimensional constructed image showing the morphology of MHC-II+ and Gpnmb+MM. Scale bar = 5 μm. n = 4 per group. (I and J), **P < 0.01, Student t test. BldMM, peripheral blood monocytes/macrophages; BrMM, monocytes/macrophages in the ischemic brain.
Fig. 4.
Fig. 4.
Altered subgroup composition in T cells due to aging. (A) UMAP plot of peripheral T cells from aged and young mice (left). Bar plots showing the proportions of the different T cell subsets (right). (B) CyTOF results indicating a significant increase in the proportion of memory cells expressing CD44hi of CD3+CD4+T and CD3+CD8+T cell populations in aged mice (n = 4) compared to young mice (n = 3). *P < 0.05, **P < 0.01, Student t test. (C) Bar graph showing the number of DEGs in each subgroup in the peripheral blood of aged and young mice, with a log2(fold change) > 0.25 and adjusted P value < 0.05. (D) Display of genes up-regulated in CD4 E/M and CD8 E/M cells in aged mice compared to young mice. (E) UMAP plot of peripheral and brain T cells from aged and young mice (left), along with the proportion of these T cell clusters in aged and young ischemic brains (right). (F) Mice that received aged T cell showing larger infarct volumes at 14 d post-MCAO. n = 4 per group. **P < 0.01, Student t test. NS means not significant. (G and H) Rotarod (G, n = 7 per group) and adhesive removal tests (H, n = 8 per group) suggest that mice receiving aged T cells exhibit worse neurological outcomes than those receiving young T cells. *P < 0.05, 2-way ANOVA repeated measurement. IFN-T, T cells that respond to interferons; Non-T, MCAO mice did not receive T cells; Young-T, MCAO mice received young T cells; Aged-T, MCAO mice received aged T cells.
Fig. 5.
Fig. 5.
Functional changes in CD4 T cells in aged mice. (A) Cell clustering of peripheral blood cells from aged and young mice (left), and differences in the proportions of cell subsets between the 2 groups (right). (B) Scatter plot showing differential genes in 3 major categories of peripheral blood CD4 T cells in aged versus young mice: The y-axis displays the log2(fold change). (C) Upper panel displaying the gene expression distribution of Icos and Itgae; lower panel showing the UMAP of naive Tregs and EF Tregs. (D) The proportion of EF Tregs in total Tregs was higher in aged mice compared to young mice. (E) Dot plot showing the expression of marker genes in naive Tregs and EF Tregs. (F and G) CyTOF data showing that the proportion of peripheral blood CD103+ Tregs was higher in aged mice (n = 4) compared to young mice (n = 3) (F), and that the expression level of CD44 of Tregs was elevated in aged mice (n = 4) compared to young mice (n = 3) (G). Tregs were gated as CD3+CD4+CD25+FOXP3+cells. *P < 0.05, Student t test. (H) UMAP projection plot showing cell clusters of peripheral and infiltrated CD4 T cell clusters from aged and young mice. A stacked bar plot in the right-bottom panel showing the proportions of these clusters within the ischemic brains of aged and young mice. (I) Violin plot showing differences in the expression of Pdcd1, Tox, Tgfb1, and Lgals1 in EF Tregs in the ischemic brains of aged and young mice. (J) GO enrichment analysis showing functional differences between aged and young mice. (K) Immunostaining results indicating that at 14 d post-MCAO, aged mice have fewer Tregs counts in the ischemic brain compared to young mice. n = 5 per group. Scale bars = 50 μm. **P < 0.01, Student t test. Treg, regulatory T cells; CD4MM, CD4 memory; Th1, T helper 1; Th17, T helper 17.
Fig. 6.
Fig. 6.
CD8 immune imbalance in aged mice. (A) UMAP plot of all peripheral CD8 clusters from aged and young mice (left), and a stacked bar plot showing the proportion of these clusters in the 2 groups (right). (B) Feature plot illustrating the expression of Klra1, Klra6, Klra7, and Il2rb genes. (C) Dot plot showing different genes expression in CD8 Tregs between aged and young mice. (D) Tox and Pdcd1 were highly expressed in CD8 EXL. (E) Left panel displaying a feature plot of Eomes and Gzmk expression distribution; right panels showing violin plots indicating higher Eomes and Gzmk expression in CD8 EXL. (F) Peripheral blood CD8 EXL in aged mice express higher levels of Eomes and Gzmk compared to young mice. (G) Dot plot illustrating distinct functional terms in CD8 EXL and CD8 Tregs, as revealed by GO enrichment analysis. (H) Gating scheme for CD8+PD-1+T cells and CD8 Tregs of CyTOF analysis (left); results show an increased proportion of peripheral CD8+PD-1+T cells and a significant decrease in CD8 Tregs proportion in aged mice (n = 4) compared to young mice (n = 3). *P < 0.05, Student t test. (I) Left panel showing the distribution of major chemotactic receptors in peripheral CD8 T cells. Right panel: Dot plot indicating that higher expression levels of chemotactic receptors in CD8 EF, CD8 EM, and CD8 EXL in aged mice compared to young mice. (J) UMAP plots of CD8 cell clusters in the peripheral blood and ischemic brain (left). Differences in the proportions of these clusters in the ischemic brain (right). (K) Violin plots indicating that brain CD8 EXL express higher levels of Pdcd1 and Ifng compared to other cell clusters. (L) Immunostaining showing that at 14 d post-MCAO, the proportion of CD8+PD1+T cells in the ischemic brain of aged mice (n = 4) was higher than young mice (n = 5). Scale bar = 50 μm. ***P < 0.001, Student t test. CD8 CM, CD8 central memory; CD8 EM, CD8 effector memory; CD8 EF, CD8 effector; CD8 Treg, regulatory CD8 T cells; IFN-CD8, CD8 T cells that respond to interferons; Cycl-CD8, cycling CD8 T cells.

References

    1. Rustenhoven J, Kipnis J. Brain borders at the central stage of neuroimmunology. Nature. 2022;612(7940):417–429. - PMC - PubMed
    1. Shichita T, Ooboshi H, Yoshimura A. Neuroimmune mechanisms and therapies mediating post-ischaemic brain injury and repair. Nat Rev Neurosci. 2023;24(5):299–312. - PubMed
    1. Prinz M, Priller J. The role of peripheral immune cells in the CNS in steady state and disease. Nat Neurosci. 2017;20(2):136–144. - PubMed
    1. Nikolich-Žugich J. The twilight of immunity: Emerging concepts in aging of the immune system. Nat Immunol. 2018;19(1):10–19. - PubMed
    1. Sykes GP, Kamtchum-Tatuene J, Falcione S, Zehnder S, Munsterman D, Stamova B, Ander BP, Sharp FR, Jickling G. Aging immune system in acute ischemic stroke: A transcriptomic analysis. Stroke. 2021;52(4):1355–1361. - PMC - PubMed