. 2024:32:12-22.
doi: 10.1109/TNSRE.2023.3341436. Epub 2024 Jan 12.

Center of Mass Estimation for Impaired Gait Assessment Using Inertial Measurement Units

Center of Mass Estimation for Impaired Gait Assessment Using Inertial Measurement Units

Gabrielle C Labrozzi et al. IEEE Trans Neural Syst Rehabil Eng. 2024.

Abstract

Injury or disease often compromise walking dynamics and negatively impact quality of life and independence. Assessing methods to restore or improve pathological gait can be expedited by examining a global parameter that reflects overall musculoskeletal control. Center of mass (CoM) kinematics follow well-defined trajectories during unimpaired gait, and change predictably with various gait pathologies. We propose a method to estimate CoM trajectories from inertial measurement units (IMUs) using a bidirectional Long Short-Term Memory neural network to evaluate rehabilitation interventions and outcomes. Five non-disabled volunteers participated in a single session of various dynamic walking trials with IMUs mounted on various body segments. A neural network trained with data from four of the five volunteers through a leave-one-subject out cross validation estimated the CoM with average root mean square errors (RMSEs) of 1.44cm, 1.15cm, and 0.40cm in the mediolateral (ML), anteroposterior (AP), and inferior/superior (IS) directions respectively. The impact of number and location of IMUs on network prediction accuracy was determined via principal component analysis. Comparing across all configurations, three to five IMUs located on the legs and medial trunk were the most promising reduced sensor sets for achieving CoM estimates suitable for outcome assessment. Lastly, the networks were tested on data from an individual with hemiparesis with the greatest error increase in the ML direction, which could stem from asymmetric gait. These results provide a framework for assessing gait deviations after disease or injury and evaluating rehabilitation interventions intended to normalize gait pathologies.


Figures
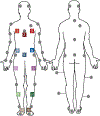
Fig. 1.
Fig. 1.
Position of the body-mounted sensors. The gray circles are the reflective markers and the 12 color squares are the Xsens IMUs. The IMUs were positioned on each lower extremity segment and the trunk. While not shown, each IMU had a reflective marker attached above the sensor’s origin point.
Fig. 2.
Fig. 2.
Each participant completed walking trials under various gait dynamics. Each condition had subjectively normal and slow pace trials. A) Neurotypical gait dynamics. B) Continuous pattern with walker. C, D) Discontinuous pattern with a pause during the DSP to push the walker forward. Step initiation with plantarflexion (C) and without (D).
Fig. 3.
Fig. 3.
Footstep Position Example. A vector between the stance foot and the preceding one was generated to account for heading and drift from a straight line progression. The position of the right (R) and left (L) foot are with respect to the global frame of the lab. is the angle between the stance foot and the global AP direction.
Fig. 4.
Fig. 4.
Neural Network Workflow. The VICON data from the gait condition trials is used in conjunction with the anthropometric tables to compute the measured CoM. Each of the three neural networks take the IMU data as the inputs and produces the estimated CoM for one direction, ML, AP, and IS. The estimates are compared to the measured CoM by computing the RMSE where CoMP is the predicted CoM and CoMM is the measured.
Fig. 5.
Fig. 5.
Neural Network estimates. The average analytical CoM trajectory (solid blue), SD (dashed blue), and average network estimates (orange) for the ML, AP, and IS directions respectively. The plots are normalized over a percent gait cycle. The testing trials come from different subjects within testing Group 1. The letters in parentheses correspond to the various conditions outlined in Fig. 2. (Discon. = Discontinuous, PF = plantarflexion).

References

    1. Morris JN and Hardman AE, “Walking to health,” Sports Med, vol. 23, no. 5, pp. 306–332, May 1997, doi: 10.2165/00007256-199723050-00004. - DOI - PubMed
    1. Perry J, Gait Analysis: Normal and Pathological Function, 2nd ed. Thorofare, NJ, USA: Slack, 2010.
    1. Moore O, Peretz C, and Giladi N, “Freezing of gait affects quality of life of peoples with Parkinson’s disease beyond its relationships with mobility and gait,” Movement Disorders, vol. 22, no. 15, pp. 2192–2195, Nov. 2007, doi: 10.1002/mds.21659. - DOI - PubMed
    1. Mirelman A et al., “Gait impairments in Parkinson’s disease,” Lancet Neurol, vol. 18, no. 7, pp. 697–708, 2019, doi: 10.1016/S1474-4422(19)30044-4. - DOI - PubMed
    1. Guzik A et al., “Validity of the gait variability index for individuals after a stroke in a chronic stage of recovery,” Gait Posture, vol. 68, pp. 63–67, Feb. 2019, doi: 10.1016/j.gaitpost.2018.11.014. - DOI - PubMed

Publication types