. 2024 Feb 2;12(2):232-246.
doi: 10.1158/2326-6066.CIR-23-0211.

Single-Cell Transcriptomics Reveals the Heterogeneity of the Immune Landscape of IDH-Wild-Type High-Grade Gliomas

Affiliations

Single-Cell Transcriptomics Reveals the Heterogeneity of the Immune Landscape of IDH-Wild-Type High-Grade Gliomas

Xiaojuan Ran et al. Cancer Immunol Res. .

Abstract

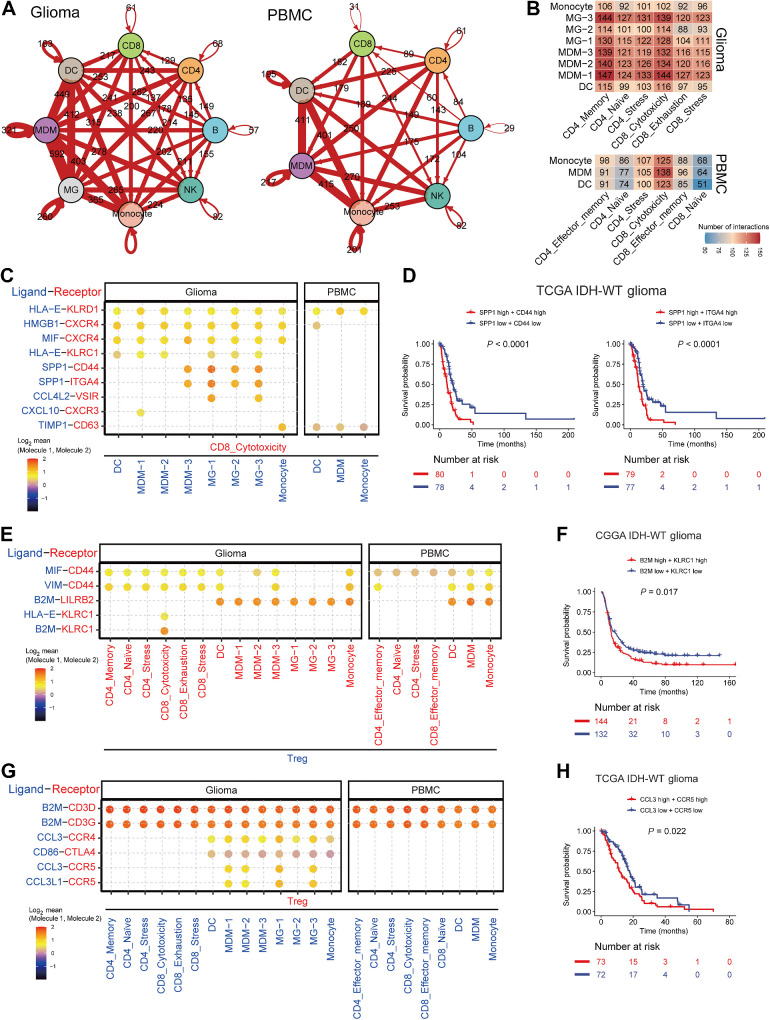
Isocitrate dehydrogenase (IDH)-wild-type (WT) high-grade gliomas, especially glioblastomas, are highly aggressive and have an immunosuppressive tumor microenvironment. Although tumor-infiltrating immune cells are known to play a critical role in glioma genesis, their heterogeneity and intercellular interactions remain poorly understood. In this study, we constructed a single-cell transcriptome landscape of immune cells from tumor tissue and matching peripheral blood mononuclear cells (PBMC) from IDH-WT high-grade glioma patients. Our analysis identified two subsets of tumor-associated macrophages (TAM) in tumors with the highest protumorigenesis signatures, highlighting their potential role in glioma progression. We also investigated the T-cell trajectory and identified the aryl hydrocarbon receptor (AHR) as a regulator of T-cell dysfunction, providing a potential target for glioma immunotherapy. We further demonstrated that knockout of AHR decreased chimeric antigen receptor (CAR) T-cell exhaustion and improved CAR T-cell antitumor efficacy both in vitro and in vivo. Finally, we explored intercellular communication mediated by ligand-receptor interactions within the tumor microenvironment and PBMCs and revealed the unique cellular interactions present in the tumor microenvironment. Taken together, our study provides a comprehensive immune landscape of IDH-WT high-grade gliomas and offers potential drug targets for glioma immunotherapy.


Figures

Figure 1. Single-cell transcriptome of tumors and matching PBMCs with glioma. A, The overall study design scheme diagram of immune cells profiling in glioma tumors and PBMCs using scRNA-seq. B, A TSNE plot of 107,142 single cells grouped into seven major cell types from nine glioma patient samples (left, all cells from tumor and PBMC samples; middle, cells from glioma samples; right, cells from PBMC samples). C, Dot plot showing the gene-expression patterns of classical immune cell-type marker genes. D, Bar plot showing the cell-type fraction in all immune cells of each sample. E, The fraction of each cell type among all immune cells compared between gliomas and PBMCs. Each dot represents one sample and the Wilcoxon rank sum test was used to calculate the P value of each compared group.
Figure 1.
Single-cell transcriptome of tumors and matching PBMCs with glioma. A, The overall study design scheme diagram of immune cells profiling in glioma tumors and PBMCs using scRNA-seq. B, A TSNE plot of 107,142 single cells grouped into seven major cell types from nine glioma patient samples (left, all cells from tumor and PBMC samples; middle, cells from glioma samples; right, cells from PBMC samples). C, Dot plot showing the gene-expression patterns of classical immune cell-type marker genes. D, Bar plot showing the cell-type fraction in all immune cells of each sample. E, The fraction of each cell type among all immune cells compared between gliomas and PBMCs. Each dot represents one sample and the Wilcoxon rank sum test was used to calculate the P value of each compared group.
Figure 2. Myeloid cell heterogeneity in tumors and PBMCs. A, Uniform manifold approximation and projection (UMAP) plots displayed 46,628 myeloid cells in glioma samples grouped into four subsets and 14,201 myeloid cells in PBMC samples grouped into three subsets, respectively. B, Bubble plots showing the functional pathways of DEGs generated from gliomas compared with PBMCs for three cell types, including monocyte, DC, and MDM. Each dot represents a pathway, the color of the dos denotes the significance level, the dot sizes represent the number of genes enriched in the indicated pathway, and functionally related dots are connected by lines (glioma, upregulated pathways in gliomas; PBMC, upregulated pathways in PBMCs). C, UMAP plot showing the MDM and microglia subsets. D, Dot plot displaying marker genes for MDM and microglia subsets. E, Bubble plot showing enriched pathways of marker genes for MDM and microglia subsets, whereas the Benjamini–Hochberg adjusted P values are used to show the significance level.
Figure 2.
Myeloid cell heterogeneity in tumors and PBMCs. A, Uniform manifold approximation and projection (UMAP) plots displayed 46,628 myeloid cells in glioma samples grouped into four subsets and 14,201 myeloid cells in PBMC samples grouped into three subsets, respectively. B, Bubble plots showing the functional pathways of DEGs generated from gliomas compared with PBMCs for three cell types, including monocyte, DC, and MDM. Each dot represents a pathway, the color of the dos denotes the significance level, the dot sizes represent the number of genes enriched in the indicated pathway, and functionally related dots are connected by lines (glioma, upregulated pathways in gliomas; PBMC, upregulated pathways in PBMCs). C, UMAP plot showing the MDM and microglia subsets. D, Dot plot displaying marker genes for MDM and microglia subsets. E, Bubble plot showing enriched pathways of marker genes for MDM and microglia subsets, whereas the Benjamini–Hochberg adjusted P values are used to show the significance level.
Figure 3. Tumor-associated macrophage/microglia signature and developmental trajectory. A, Violin plot showing expression patterns of angiogenesis and phagocytosis signatures among MDM and microglia subsets. The nonparametric Kruskal–Wallis test was used for statistical significance; *, P < 0.05; **, P < 0.01; ***, P < 0.001; ****, P < 0.0001. B, Dot plot showing the expression pattern of coinhibitory immune check points in MDM and microglia subsets. C, Kaplan–Meier plots showing clinical outcomes in IDH-WT glioma patients from the TCGA and CGGA databases with high or low expression of TAM subset signature and compared statistics using the log-rank test. D, Uniform manifold approximation and projection (UMAP) plot showing clinical phenotypes of MDM and microglia subsets using Scissor. E, Pseudotime trajectories of MDM subsets inferred by Slingshot overlaid UMAP (left, one cell lineage across color-coded MDM subsets; right, pseudotime of MDM subsets). F, Potential trajectory of microglia subsets based on Slingshot (left, two cell lineages across color-coded microglia subsets; middle, pseudotime of the first cell lineage; right, pseudotime of the second cell lineage).
Figure 3.
Tumor-associated macrophage/microglia signature and developmental trajectory. A, Violin plot showing expression patterns of angiogenesis and phagocytosis signatures among MDM and microglia subsets. The nonparametric Kruskal–Wallis test was used for statistical significance; *, P < 0.05; **, P < 0.01; ***, P < 0.001; ****, P < 0.0001. B, Dot plot showing the expression pattern of coinhibitory immune check points in MDM and microglia subsets. C, Kaplan–Meier plots showing clinical outcomes in IDH-WT glioma patients from the TCGA and CGGA databases with high or low expression of TAM subset signature and compared statistics using the log-rank test. D, Uniform manifold approximation and projection (UMAP) plot showing clinical phenotypes of MDM and microglia subsets using Scissor. E, Pseudotime trajectories of MDM subsets inferred by Slingshot overlaid UMAP (left, one cell lineage across color-coded MDM subsets; right, pseudotime of MDM subsets). F, Potential trajectory of microglia subsets based on Slingshot (left, two cell lineages across color-coded microglia subsets; middle, pseudotime of the first cell lineage; right, pseudotime of the second cell lineage).
Figure 4. T-cell heterogeneity in glioma and PBMCs. A, Uniform manifold approximation and projection (UMAP) plots displayed 3,942 T cells in glioma samples and 21,318 T cells grouped into seven major subsets in PBMC samples, respectively. B, Dot plots showing expression patterns of classical markers for each T-cell subset in glioma and PBMC samples. C, Violin plots showing cytotoxic and exhausted signature scores for each T-cell subset in glioma and PBMC samples; the nonparametric Wilcoxon rank sum test was used for statistical significance; *, P < 0.05; **, P < 0.01; ***, P < 0.001; ****, P < 0.0001. D, Bubble plots comparing the functional pathways of DEGs in CD4_Naïve, CD4_Stress, Treg, and CD8_Cytotoxicity in glioma versus PBMC samples (Glioma, upregulated pathways in gliomas; PBMC, upregulated pathways in PBMCs).
Figure 4.
T-cell heterogeneity in glioma and PBMCs. A, Uniform manifold approximation and projection (UMAP) plots displayed 3,942 T cells in glioma samples and 21,318 T cells grouped into seven major subsets in PBMC samples, respectively. B, Dot plots showing expression patterns of classical markers for each T-cell subset in glioma and PBMC samples. C, Violin plots showing cytotoxic and exhausted signature scores for each T-cell subset in glioma and PBMC samples; the nonparametric Wilcoxon rank sum test was used for statistical significance; *, P < 0.05; **, P < 0.01; ***, P < 0.001; ****, P < 0.0001. D, Bubble plots comparing the functional pathways of DEGs in CD4_Naïve, CD4_Stress, Treg, and CD8_Cytotoxicity in glioma versus PBMC samples (Glioma, upregulated pathways in gliomas; PBMC, upregulated pathways in PBMCs).
Figure 5. CD8+ T-cell trajectories in glioma. A, Potential trajectory of CD8 T cells inferred by Slingshot displayed on uniform manifold approximation and projection (UMAP) in glioma samples (left, two cell lineages across color-coded CD8 subsets; middle, pseudotime of the first cell lineage; right, pseudotime of the second cell lineage). B, Gene-expression dynamics along the CD8_Cytotoxicity to CD8_Stress T-cell trajectory. C, Gene-expression dynamics along the CD8_Cytotoxicity to CD8_Exhaustion T-cell trajectory. D, The difference of AHR gene expression in CD8_Cytotoxicity compared between glioma and PBMC; the Wilcoxon rank sum test was used to calculate the P value, *, P < 0.05; **, P < 0.01; ***, P < 0.001; ****, P < 0.0001. E, Exhaustion evaluations of the AHR KO EGFR CAR T cells compared with nontargeting control in cocultures with GSC3565 cells at gradient E:T ratios. F and G, Cytokines (F) and cytotoxicity (G) evaluations of the AHR KO EGFR CAR T cells compared with nontargeting control in cocultures with GSC3565 cells at gradient E:T ratios. Data are displayed as the mean ± SD (ANOVA). *, P < 0.05; **, P < 0.01; ***, P < 0.001; ****, P < 0.0001; n = 3; ns: not significant. H, Scheme for the rechallenge experiment. CAR T cells were subjected to two rounds of GSCs challenging (E:T = 1:1) before further analysis. Created with BioRender.com. I–K, Exhaustion (I), cytokines secretion (J), cytotoxicity (K), evaluations of the AHR KO EGFR CAR T cells compared with nontargeting control in rechallenging with GSC3565 cells at E:T = 1:1. Data are displayed as the mean ± SD (ANOVA). **, P < 0.01; ***, P < 0.001; ****, P < 0.0001 (n = 3). L, GSEA of genes differentially expressed in AHR KO and nontargeting control CAR T cells following cocultured with GSC cells. M, Kaplan‒Meier survival curves of mice bearing intracranial MGG6 cells treated with nontransduced control cells, sgNT EGFR CAR T or sgAHR EGFR CAR T cells. GBM-bearing mouse models were established by orthotopically implanting 10,000 MGG6 and then treated with 1 million CAR T cells in situ 10 days after tumor cell injection. P values were calculated using the log-rank test (control group, n = 5; CAR T-treated group, n = 8). **, P < 0.01; ***, P < 0.001. N and O, Bioluminescence imaging to measure MGG6 tumor cell growth in vivo. The analysis of tumor burden flux is derived from the bioluminescence of tumor-bearing mice at day 30. Data are displayed as the mean ± SD (ANOVA). *, P < 0.05; **, P < 0.01. P, Exhaustion evaluations of the AHR KO CAR T cells (sgAHR1#, N = 6; sgAHR2#, N = 5) and nontargeting control CAR T cells (sgNT, N = 5), derived from glioma tissue isolated from mice 2 days after treated with CAR T cells. Data are displayed as the mean ± SD (ANOVA). ***, P < 0.001.
Figure 5.
CD8+ T-cell trajectories in glioma. A, Potential trajectory of CD8 T cells inferred by Slingshot displayed on uniform manifold approximation and projection (UMAP) in glioma samples (left, two cell lineages across color-coded CD8 subsets; middle, pseudotime of the first cell lineage; right, pseudotime of the second cell lineage). B, Gene-expression dynamics along the CD8_Cytotoxicity to CD8_Stress T-cell trajectory. C, Gene-expression dynamics along the CD8_Cytotoxicity to CD8_Exhaustion T-cell trajectory. D, The difference of AHR gene expression in CD8_Cytotoxicity compared between glioma and PBMC; the Wilcoxon rank sum test was used to calculate the P value, *, P < 0.05; **, P < 0.01; ***, P < 0.001; ****, P < 0.0001. E, Exhaustion evaluations of the AHR KO EGFR CAR T cells compared with nontargeting control in cocultures with GSC3565 cells at gradient E:T ratios. F and G, Cytokines (F) and cytotoxicity (G) evaluations of the AHR KO EGFR CAR T cells compared with nontargeting control in cocultures with GSC3565 cells at gradient E:T ratios. Data are displayed as the mean ± SD (ANOVA). *, P < 0.05; **, P < 0.01; ***, P < 0.001; ****, P < 0.0001; n = 3; ns: not significant. H, Scheme for the rechallenge experiment. CAR T cells were subjected to two rounds of GSCs challenging (E:T = 1:1) before further analysis. Created with BioRender.com. IK, Exhaustion (I), cytokines secretion (J), cytotoxicity (K), evaluations of the AHR KO EGFR CAR T cells compared with nontargeting control in rechallenging with GSC3565 cells at E:T = 1:1. Data are displayed as the mean ± SD (ANOVA). **, P < 0.01; ***, P < 0.001; ****, P < 0.0001 (n = 3). L, GSEA of genes differentially expressed in AHR KO and nontargeting control CAR T cells following cocultured with GSC cells. M, Kaplan‒Meier survival curves of mice bearing intracranial MGG6 cells treated with nontransduced control cells, sgNT EGFR CAR T or sgAHR EGFR CAR T cells. GBM-bearing mouse models were established by orthotopically implanting 10,000 MGG6 and then treated with 1 million CAR T cells in situ 10 days after tumor cell injection. P values were calculated using the log-rank test (control group, n = 5; CAR T-treated group, n = 8). **, P < 0.01; ***, P < 0.001. N and O, Bioluminescence imaging to measure MGG6 tumor cell growth in vivo. The analysis of tumor burden flux is derived from the bioluminescence of tumor-bearing mice at day 30. Data are displayed as the mean ± SD (ANOVA). *, P < 0.05; **, P < 0.01. P, Exhaustion evaluations of the AHR KO CAR T cells (sgAHR1#, N = 6; sgAHR2#, N = 5) and nontargeting control CAR T cells (sgNT, N = 5), derived from glioma tissue isolated from mice 2 days after treated with CAR T cells. Data are displayed as the mean ± SD (ANOVA). ***, P < 0.001.
Figure 6. Intercellular interactions among different cell types in tumors and PBMCs. A, Network showing the interactions among different immune cell types. The width of lines denotes the number of interactions. B, Heat map showing the number of significant L-R interactions between T-cell and myeloid cells in glioma (top) and PBMC (bottom). C, Dot plot showing the specific L-R interactions between CD8_Cytotoxicity and myeloid cells compared between glioma and PBMC. D, Kaplan–Meier plots showing the clinical outcomes in glioma patients from TCGA IDH-WT glioma database with high or low expression of SPP1–CD44 and SPP1–ITGA4 (the median as the threshold). Statistics were compared using the log-rank test. E, Dot plot showing the specific L-R interactions between Tregs and myeloid cells compared between glioma and PBMC. F, Kaplan–Meier plots showing clinical outcomes in glioma patients from CGGA IDH-WT glioma database with high or low expression of B2M-KLRC1 (the median as the threshold). Statistics were compared using the log-rank test. G, Dot plot showing the specific L-R interactions between myeloid cells and Treg compared between glioma and PBMC. H, Kaplan–Meier plots showing the clinical outcomes in glioma patients from TCGA IDH-WT glioma database with high or low expression of CCL3–CCR5 (the median as the threshold). Statistics were compared using the log-rank test.
Figure 6.
Intercellular interactions among different cell types in tumors and PBMCs. A, Network showing the interactions among different immune cell types. The width of lines denotes the number of interactions. B, Heat map showing the number of significant L-R interactions between T-cell and myeloid cells in glioma (top) and PBMC (bottom). C, Dot plot showing the specific L-R interactions between CD8_Cytotoxicity and myeloid cells compared between glioma and PBMC. D, Kaplan–Meier plots showing the clinical outcomes in glioma patients from TCGA IDH-WT glioma database with high or low expression of SPP1–CD44 and SPP1–ITGA4 (the median as the threshold). Statistics were compared using the log-rank test. E, Dot plot showing the specific L-R interactions between Tregs and myeloid cells compared between glioma and PBMC. F, Kaplan–Meier plots showing clinical outcomes in glioma patients from CGGA IDH-WT glioma database with high or low expression of B2M-KLRC1 (the median as the threshold). Statistics were compared using the log-rank test. G, Dot plot showing the specific L-R interactions between myeloid cells and Treg compared between glioma and PBMC. H, Kaplan–Meier plots showing the clinical outcomes in glioma patients from TCGA IDH-WT glioma database with high or low expression of CCL3–CCR5 (the median as the threshold). Statistics were compared using the log-rank test.

References

    1. Louis DN, Perry A, Wesseling P, Brat DJ, Cree IA, Figarella-Branger D, et al. . The 2021 WHO classification of tumors of the central nervous system: a summary. Neuro Oncol 2021;23:1231–51. - PMC - PubMed
    1. Lim M, Xia Y, Bettegowda C, Weller M. Current state of immunotherapy for glioblastoma. Nat Rev Clin Oncol 2018;15:422–42. - PubMed
    1. Chang K, Zhang B, Guo X, Zong M, Rahman R, Sanchez D, et al. . Multimodal imaging patterns predict survival in recurrent glioblastoma patients treated with bevacizumab. Neuro Oncol 2016;18:1680–7. - PMC - PubMed
    1. Habashy KJ, Mansour R, Moussalem C, Sawaya R, Massaad MJ. Challenges in glioblastoma immunotherapy: mechanisms of resistance and therapeutic approaches to overcome them. Br J Cancer 2022;127:976–87. - PMC - PubMed
    1. Nduom EK, Weller M, Heimberger AB. Immunosuppressive mechanisms in glioblastoma. Neuro Oncol 2015;17Suppl 7:vii9–vii14. - PMC - PubMed

Publication types

Substances