. 2023 Dec 15;9(50):eadh2858.
doi: 10.1126/sciadv.adh2858. Epub 2023 Dec 13.

Cysteine desulfurase (IscS)-mediated fine-tuning of bioenergetics and SUF expression prevents Mycobacterium tuberculosis hypervirulence

Affiliations

Cysteine desulfurase (IscS)-mediated fine-tuning of bioenergetics and SUF expression prevents Mycobacterium tuberculosis hypervirulence

Mayashree Das et al. Sci Adv. .

Abstract

Iron-sulfur (Fe-S) biogenesis requires multiprotein assembly systems, SUF and ISC, in most prokaryotes. M. tuberculosis (Mtb) encodes a complete SUF system, the depletion of which was bactericidal. The ISC operon is truncated to a single gene iscS (cysteine desulfurase), whose function remains uncertain. Here, we show that MtbΔiscS is bioenergetically deficient and hypersensitive to oxidative stress, antibiotics, and hypoxia. MtbΔiscS resisted killing by nitric oxide (NO). RNA sequencing indicates that IscS is important for expressing regulons of DosR and Fe-S-containing transcription factors, WhiB3 and SufR. Unlike wild-type Mtb, MtbΔiscS could not enter a stable persistent state, continued replicating in mice, and showed hypervirulence. The suf operon was overexpressed in MtbΔiscS during infection in a NO-dependent manner. Suppressing suf expression in MtbΔiscS either by CRISPR interference or upon infection in inducible NO-deficient mice arrests hypervirulence. Together, Mtb redesigned the ISC system to "fine-tune" the expression of SUF machinery for establishing persistence without causing detrimental disease in the host.


Figures
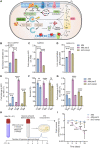
Fig. 1.
Fig. 1.. IscS is required to maintain redox balance of Mycobacterium tuberculosis (Mtb).
(A) Diagrammatic representation of endogenous reactive oxygen species (ROS) generation (O2−•, H2O2, and OH) due to the univalent reduction of O2 via electron leak from redox-active enzymes. O2−• and H2O2 disrupt iron-sulfur (Fe-S) clusters, resulting in leaching of iron and formation of highly deleterious OH radical by Fenton reaction. SUF and ISC pathways are essential for Fe-S cluster biogenesis/repair. (B) The mycothiol redox potential (EMSH) of Mtb, MtbΔiscS, and iscS-comp was determined by measuring Mrx1-roGFP2 biosensor ratio (405/488 nm) using flow cytometry. (C) Mtb, MtbΔiscS, and iscS-comp were stained with CellROX Deep Red dye to measure endogenous ROS. (D) Intracellular labile iron was determined for Mtb, MtbΔiscS, and iscS-comp by ferrozine-based colorimetric assay. Iron concentration was normalized to the protein content. Mtb, MtbΔiscS, and iscS-comp were exposed to 250 μM of cell-permeable iron chelator 2,2-bipyridyl (Bip) for 24 hours, followed by measurement of (E) endogenous ROS and (F) survival. (G) Endogenous ROS of Mtb, MtbΔiscS, and iscS-comp upon treatment with ROS scavenger Thio (10 mM). (H) Schematic representation showing experimental strategy to measure persistence of Mtb under hypoxia (credit: BioRender.com). (I) Viability of Mtb, MtbΔiscS, and iscS-comp cultured under hypoxia by colony-forming unit (CFU) enumeration. Data are presented as means ± SEM. (B to D) *P ≤ 0.05 and ****P ≤ 0.0001 by one-way analysis of variance (ANOVA) with Bonferroni’s multiple comparisons test. (E to G and I) **P ≤ 0.01, ***P ≤ 0.001, and ****P ≤ 0.0001; ns, not significant by two-way ANOVA with Bonferroni’s multiple comparisons test.
Fig. 2.
Fig. 2.. IscS deletion results in deregulation of central carbon metabolism in Mycobacterium tuberculosis (Mtb).
Quantitative liquid chromatography–mass spectrometry (LC-MS/MS) analysis of (A) glycolytic intermediates, pentose phosphate metabolites, tricarboxylic acid (TCA) metabolites, sugar nucleotides, (B) sulfur metabolites, and (C) amino acids of Mtb and MtbΔiscS. Data are presented as fold change respective to Mtb and means ± SEM. *P ≤ 0.05, **P ≤ 0.01, ***P ≤ 0.001, and ****P ≤ 0.0001 by two-way analysis of variance (ANOVA) with Bonferroni’s multiple comparisons test compared to Mtb levels. PPP, pentose phosphate pathway; G6P, glucose-6-phosphate/fructose-6-phosphate; F16BP, fructose-1,6-bisphosphate; G3P, glyceraldehyde-3-phosphate; 3PG, 3-phosphoglycerate; PEP, phosphoenolpyruvate; MG, methylglyoxal; Met, methionine; SAM, S-adenosyl methionine; SAH, S-adenosyl homocysteine; Cth, cystathionine; 6PG, 6-phosphogluconate; R5P, ribulose-5-phosphate; S7P, sedoheptulose-7-phosphate; GDP-Man, guanosine diphosphate mannose; UDP-Glc, uracil diphosphate glucose; UDP-Glc-Nac, uridine diphosphate N-acetylglucosamine; ns, not significant.
Fig. 3.
Fig. 3.. Deletion of IscS results in diminished oxygen consumption rate (OCR) and extracellular acidification rate (ECAR).
(A) OCR and (B) ECAR measurement of Mycobacterium tuberculosis (Mtb) , MtbΔiscS, and iscS-comp after injection of glucose and the uncoupler carbonyl cyanide m-chlorophenyl hydrazine (CCCP) indicated by the dotted lines. (C) Graph plotting basal respiration, glucose-induced respiration, maximum respiratory, and spare respiratory capacity (SRC) as derived from OCR values. All points of OCR and ECAR are normalized to colony-forming unit (CFU) (2 × 10⁶ cells per well). Data are presented as means ± SEM. *P ≤ 0.05, **P ≤ 0.01, ***P ≤ 0.001, and ****P ≤ 0.0001 calculated by unpaired two-tailed t test.
Fig. 4.
Fig. 4.. MtbΔiscS displayed altered expression of genes regulated by iron-sulfur (Fe-S)–containing WhiBs, SufR, and DosR/S/T system.
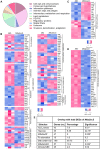
Total RNA was isolated from Mycobacterium tuberculosis (Mtb) cultures, grown to 0.4 OD600, and subjected to RNA sequencing (RNA-seq) analysis. (A) Mycobrowser-based classification of the genes/pathways [1.5-fold change; false discovery rate (FDR) ≤ 0.05] deregulated in MtbΔiscS. (B to D) Heatmaps showing gene expression changes belonging to various functional categories. Heatmaps were constructed with row z-score on normalized logCPM values. (E) The table summarizes the overlap between the IscS transcriptome with the whole-genome expression under different stress conditions and transcriptomes of Mtb-whiB1 KD, MtbΔwhiB3, and MtbΔsufR. Fisher’s exact test with *P < 0.05 as a cutoff for significance (table S2).
Fig. 5.
Fig. 5.. MtbΔiscS shows enhanced sensitivity to anti-tuberculosis (TB) drugs.
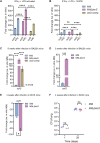
(A) Mtb, MtbΔiscS, and iscS-comp grown until OD600 values of 0.6 were treated with various concentrations of Rif, Mox, Bdq, and Inh, and MIC90 was determined using Alamar blue assay. Data are representative of two independent experiments done in duplicate. (B) Alamar blue dataset was used to calculate percent inhibition of MtbΔiscS by Rif compared to Mtb and iscS-comp. The strains Mtb, MtbΔiscS, and iscS-comp were treated with 1× MIC90 of (C) Mox (D) Rif, and (E) Inh, and survival over time was monitored by enumerating colony-forming units (CFUs). Data are presented as means ± SEM. (B to E) *P ≤ 0.05, **P ≤ 0.01, and ***P ≤ 0.001 calculated by unpaired two-tailed t test. ns, not significant.
Fig. 6.
Fig. 6.. IscS provides resistance to oxidative stress but not nitrosative stress in Mycobacterium tuberculosis (Mtb).
(A to C) Exponentially grown cells of Mtb, MtbΔiscS, and iscS-comp with or without Mrx1-roGFP2 were exposed to 80 μM cumene hydroperoxide (CHP) and 60 μM menadione (Mnd), followed by enumeration of colony-forming units (CFUs) for survival after 4 hours (A) and 24 hours (B). (C) Mrx1-roGFP2 ratio was measured at 4 hours after treatment with CHP or Mnd. (D) Survival of Mtb, MtbΔiscS, and iscS-comp after 24-hour exposure to nitric oxide (NO) donor diethylenetriamine (DETA) NO (1 mM). (E and F) Survival of Mtb, MtbΔiscS, and iscS-comp after repeated exposure to NO donor DETA NO (1 and 2 mM) was tracked for 4 days by CFU enumeration. Raw CFU values are plotted. (G) Naïve, (H) Interferon-γ (IFN-γ) + lipopolysaccharide (LPS)–activated RAW264.7, and (I) activated + 1400W (iNOS inhibitor)–treated macrophage were infected with Mtb, MtbΔiscS, and iscS-comp at an multiplicity of infection (MOI) of 1:2 for 4 hours, and intramacrophage survival was monitored over time by CFU enumeration. Data are presented as means ± SEM. (A to I) P ≥ 0.05, *P ≤ 0.05, **P ≤ 0.01, ***P ≤ 0.001, and ****P ≤ 0.0001 calculated by two-way analysis of variance (ANOVA) with Bonferroni’s multiple comparisons test. ns, not significant.
Fig. 7.
Fig. 7.. MtbΔiscS displays hypervirulence in mice.
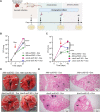
BALB/c female mice (n = 5) were given aerosol challenge with Mycobacterium tuberculosis (Mtb) , MtbΔiscS, and iscS-comp and assessed for survival in (A) lungs and (B) spleen at indicated time points. (C) The gross pathology of the infected lungs is shown after 4 and 8 weeks of infection. Black arrows show the granulomatous lesions formed upon Mtb infection. The white circles highlight the patches of lung consisting of multiple granulomatous lesions in the MtbΔiscS-infected lungs. (D) Hematoxylin and eosin–stained lung sections were imaged (at ×4 magnification) and analyzed for histopathology on Mtb infection. Changes in lung morphology are shown with formation of granuloma (G) and the normal alveolar spaces (AS). (A) P ≥ 0.05, *P ≤ 0.05, ***P ≤ 0.001, and ****P ≤ 0.0001 calculated by two-way analysis of variance (ANOVA) with Bonferroni’s multiple comparisons test. (B) *P ≤ 0.05 and ***P ≤ 0.001 calculated by unpaired two-tailed t test.
Fig. 8.
Fig. 8.. Nitric oxide (NO) induces the expression of Suf system and contributes to hypervirulence of MtbΔiscS in mice.
Gene expression analysis by quantitative reverse transcription polymerase chain reaction (qRT-PCR) of bacterial Suf genes (sufS and sufC) in Mtb, MtbΔiscS, and iscS-comp isolated from infected RAW264.7 murine macrophages (A) Lipopolysaccharide (LPS) + interferon-γ (IFN-γ) activated and (B) activated + iNOS inhibitor (1400W) after 48 hours of infection. (C) Gene expression of sufS was analyzed in Mtb, MtbΔiscS, and iscS-comp isolated from mouse lung after 8 weeks of infection. (D) Similarly, transcript levels of sufS were determined in Mtb and MtbΔiscS isolated from 3-week–infected mouse lung. (A and B) Fold change in transcript levels is compared to that of respective strains grown under standard in vitro conditions and compared to in vitro Mtb (C to D). Data are presented as means ± SEM. (E and F) iNOS−/− female mice (n = 6) were given aerosol challenge with Mtb and MtbΔiscS and assessed for survival in the lung after 4 weeks of infection. (F) Bacterial burden was determined by plating lung homogenates and colony-forming unit (CFU) enumeration. (E) The transcript levels of sufS were estimated in Mtb and MtbΔiscS isolated from 4-week–infected lungs of iNOS−/− mice. (A, B, and F) ****P ≤ 0.0001, calculated by two-way analysis of variance (ANOVA) with Bonferroni’s multiple comparisons test. (C to E) Statistical significance was analyzed over untreated control by paired two-tailed t test (**P < 0.01 and ****P < 0.0001). ns, not significant.
Fig. 9.
Fig. 9.. Overexpression of Suf system contributes to hypervirulence of MtbΔiscS in mice.
(A) BALB/c mice (n = 5) were given aerosol challenge with Mtb-sufSKD and ΔiscS-sufSKD and divided into three groups of (i) no doxycycline treatment (−Dox), (ii) acute phase [doxycycline started at 7 days after infection (+Dox acute)], and (iii) chronic phase [doxycycline started at 21 days after infection (+Dox chronic)] (credit: BioRender.com). Post-infection animals were sacrificed from the (B) acute group at days 7 and 21 and (C) at days 21 and 42 from the chronic group, and colony-forming unit (CFU) per lung was measured. (D) Gross pathology of Mtb-sufSKD and ΔiscS-sufSKD–infected lungs at 42 days after infection. White arrows and white circles show the granulomatous lesions formed upon Mycobacterium tuberculosis (Mtb) infection. (E) Hematoxylin and eosin–stained lung sections were imaged (at ×40 magnification) and analyzed for histopathology on Mtb infection. Changes in lung morphology are shown with formation of granuloma (G) and the normal alveolar spaces (AS). (B and C) ****P ≤ 0.0001, calculated by two-way analysis of variance (ANOVA) with Bonferroni’s multiple comparisons test.

References

    1. S. Ehrt, D. Schnappinger, Mycobacterial survival strategies in the phagosome: Defence against host stresses. Cell. Microbiol. 11, 1170–1178 (2009). - PMC - PubMed
    1. F. C. Fang, Antimicrobial reactive oxygen and nitrogen species: Concepts and controversies. Nat. Rev. Microbiol. 2, 820–832 (2004). - PubMed
    1. H. K. Miller, V. Auerbuch, Bacterial iron-sulfur cluster sensors in mammalian pathogens. Metallomics 7, 943–956 (2015). - PMC - PubMed
    1. V. Saini, A. Farhana, J. N. Glasgow, A. J. Steyn, Iron sulfur cluster proteins and microbial regulation: Implications for understanding tuberculosis. Curr. Opin. Chem. Biol. 16, 45–53 (2012). - PMC - PubMed
    1. I. Elchennawi, S. Ollagnier de Choudens, Iron–Sulfur Clusters toward Stresses: Implication for Understanding and Fighting Tuberculosis. Inorganics 10, 174 (2022).

Publication types

Substances