. 2023 Dec 12;56(12):2682-2698.e9.
doi: 10.1016/j.immuni.2023.11.010.

TCR signaling promotes formation of an STS1-Cbl-b complex with pH-sensitive phosphatase activity that suppresses T cell function in acidic environments

Affiliations

TCR signaling promotes formation of an STS1-Cbl-b complex with pH-sensitive phosphatase activity that suppresses T cell function in acidic environments

Yuan-Li Tsai et al. Immunity. .

Abstract

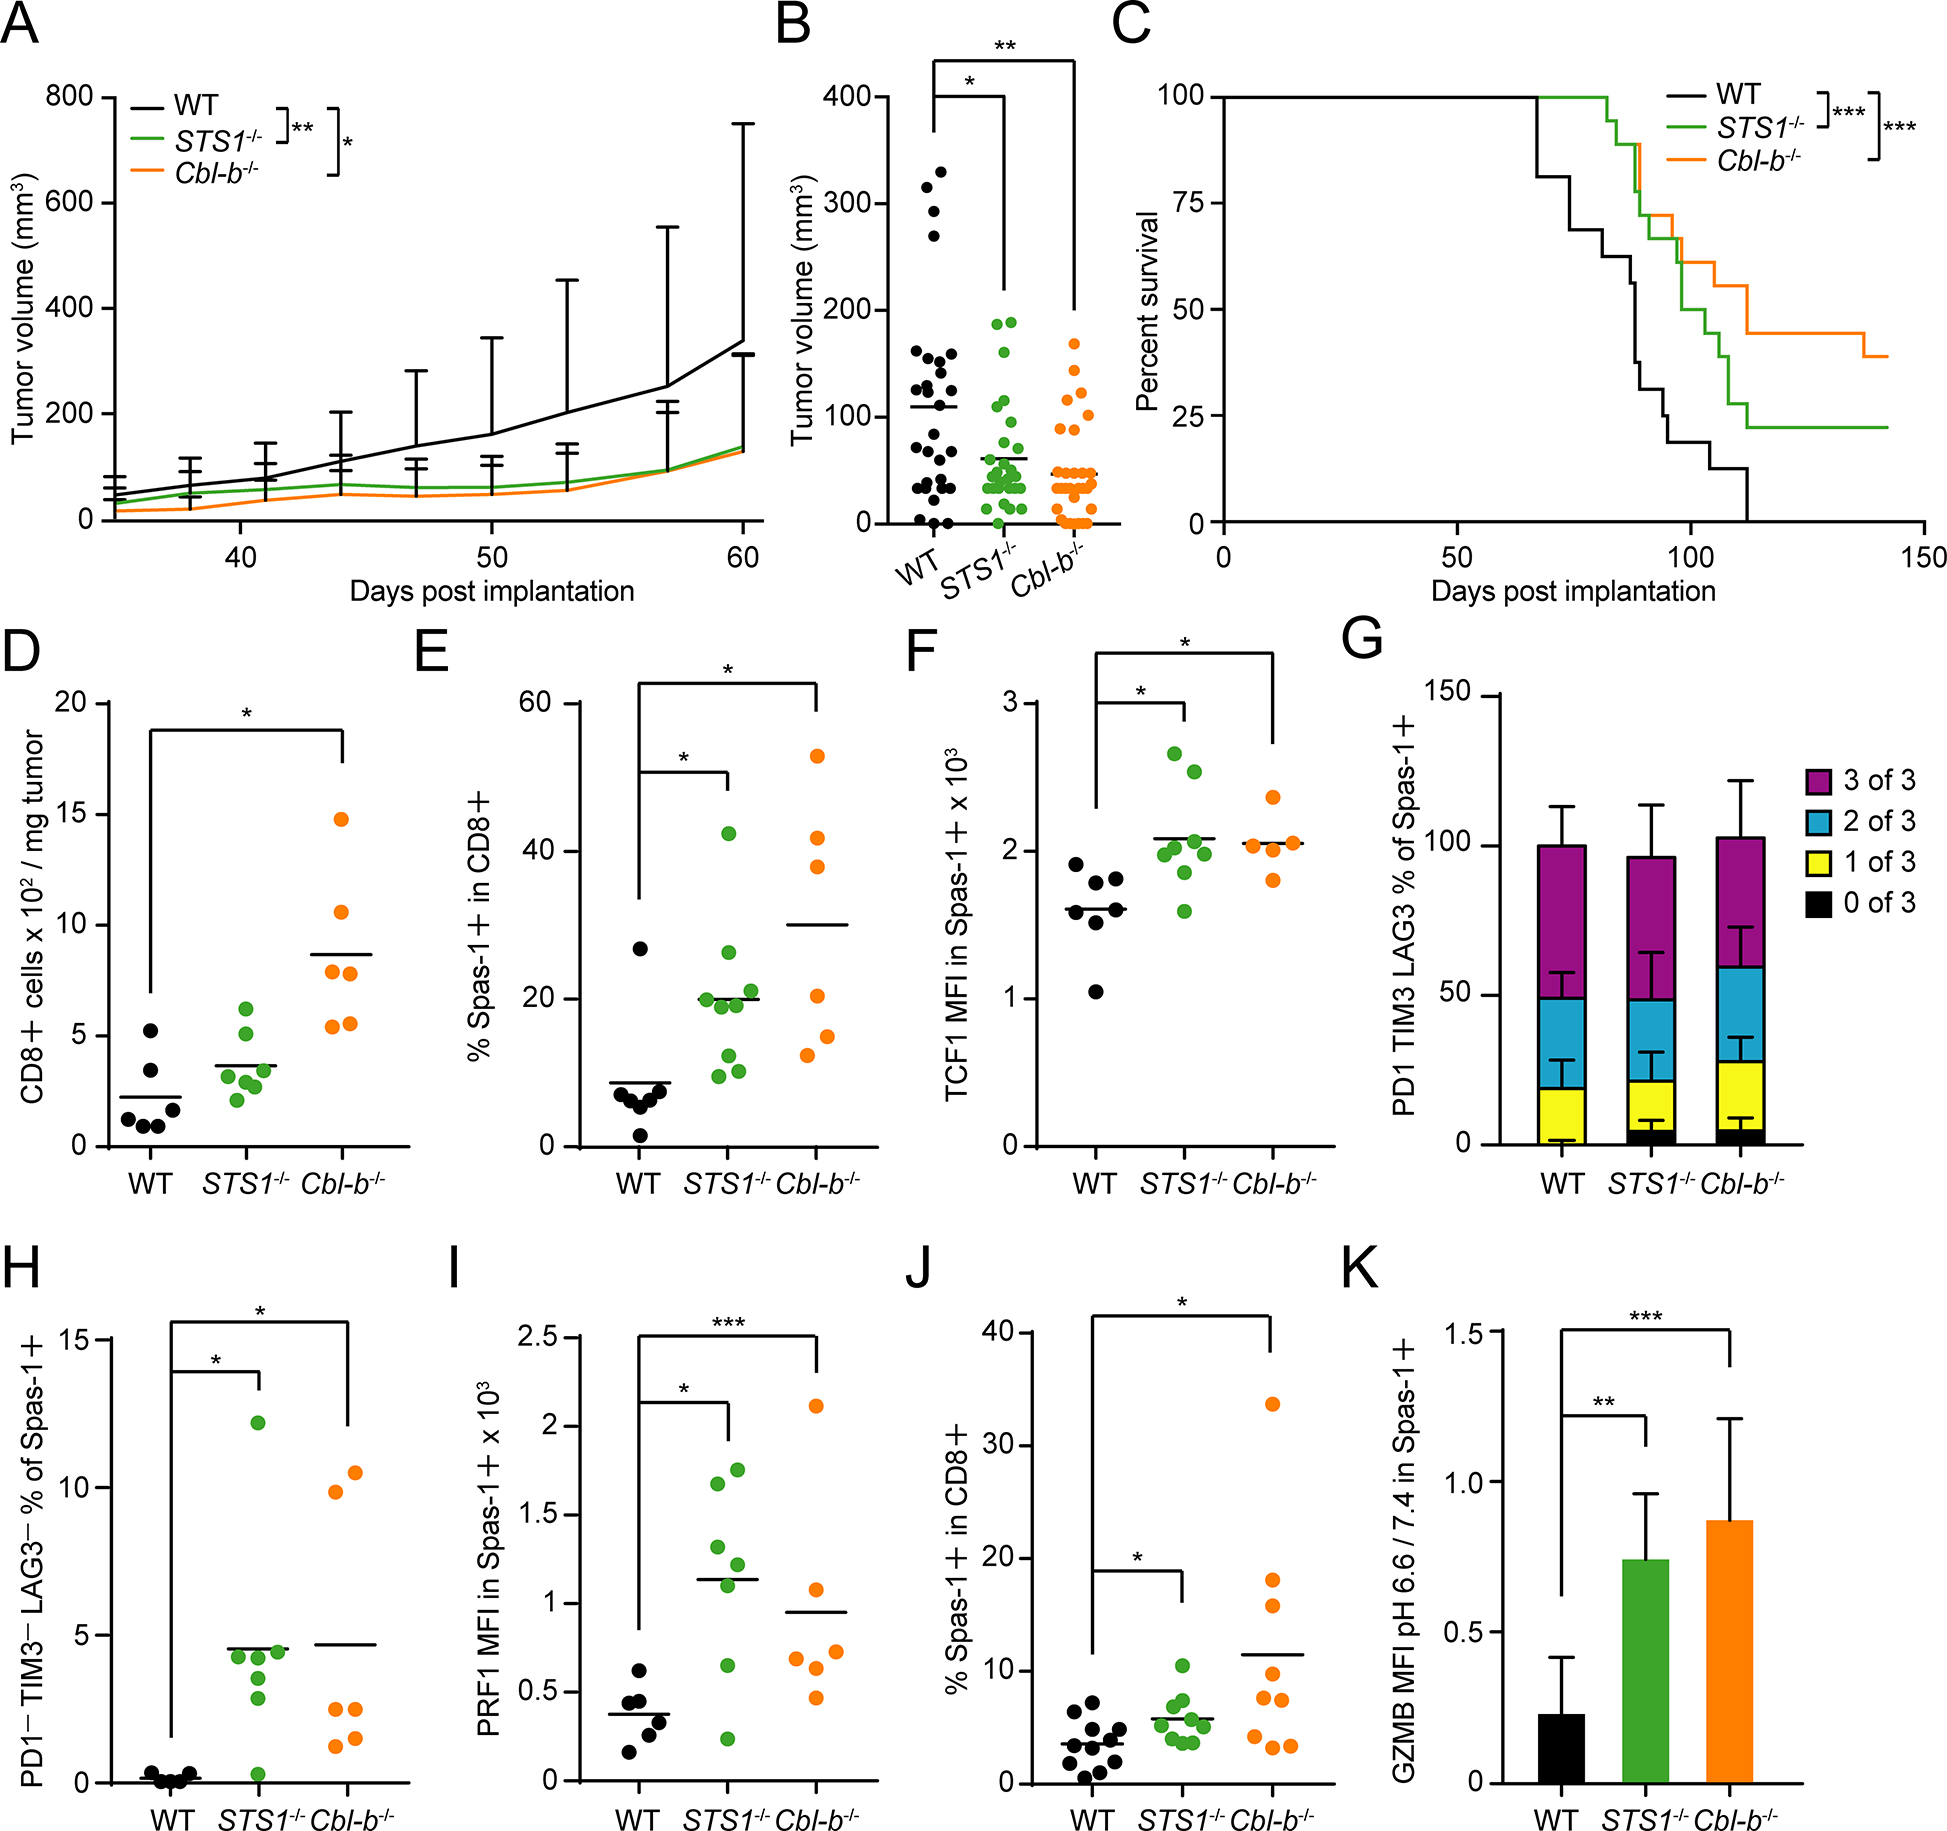
T cell responses are inhibited by acidic environments. T cell receptor (TCR)-induced protein phosphorylation is negatively regulated by dephosphorylation and/or ubiquitination, but the mechanisms underlying sensitivity to acidic environments are not fully understood. Here, we found that TCR stimulation induced a molecular complex of Cbl-b, an E3-ubiquitin ligase, with STS1, a pH-sensitive unconventional phosphatase. The induced interaction depended upon a proline motif in Cbl-b interacting with the STS1 SH3 domain. STS1 dephosphorylated Cbl-b interacting phosphoproteins. The deficiency of STS1 or Cbl-b diminished the sensitivity of T cell responses to the inhibitory effects of acid in an autocrine or paracrine manner in vitro or in vivo. Moreover, the deficiency of STS1 or Cbl-b promoted T cell proliferative and differentiation activities in vivo and inhibited tumor growth, prolonged survival, and improved T cell fitness in tumor models. Thus, a TCR-induced STS1-Cbl-b complex senses intra- or extra-cellular acidity and regulates T cell responses, presenting a potential therapeutic target for improving anti-tumor immunity.

Keywords: TCR signaling; pH sensing; phosphatase.


Conflict of interest statement

Declaration of interests A.W. is a co-founder and a scientific advisory board (SAB) member of Nurix Therapeutics, Inc., which has a Cbl-b inhibitor in phase I clinical trials. Dr. Weiss has founder shares and receives payment for his role on the Nurix SAB. A.W. also serves on the advisory boards of BlueSphere Bio, BridGene Biologics, EpiBiologics, Genentech, Imidomics, and Jasper Therapeutics. L.F. has received research support from Roche/Genentech, Abbvie, Bavarian Nordic, Bristol Myers Squibb, Dendreon, Janssen, Merck, and Partner Therapeutics. L.F. has served on the SABs of Actym, Astra Zeneca, Atreca, Bioatla, Bolt, Bristol Myer Squibb, Daiichi Sankyo, Immunogenesis, Innovent, Merck, Merck KGA, Nutcracker, RAPT, Scribe, Senti, Sutro, and Roche/Genentech.

Figures

Figure 1.
Figure 1.. STS1 interacts with Cbl-b PPVPP motif using its SH3 domain to dephophorylate TCR signaling molecules.
(A) Immunoblot using lysates from WT, Cbl-b−/− (J.Cbl-b) or c-Cbl−/− (J.c-Cbl) Jurkat cells transfected with Ctrl or c-Cbl and Cbl-b targeting siRNA and stimulated with anti-TCR antibodies. (B) Same as (A) except the whole cell lysates (WCLs) were subjected to immunoprecipitation (IP) using indicated antibodies. The relative Cbl-b and STS1 amounts in the IP fraction were quantified. (C) Locations of the FLAG-tag and domains of STS1. Defective mutant for each domain is indicated. (D) Same as (B) except STS1−/− Jurkat (J.STS1) cells transfected with WT or mutant W295A were used for anti-FLAG IP. (E) Predicted proline-rich regions (PRRs) on Cbl-b between AA 470 and 529. For the PRR-defective mutants, proline residues in each PRR were replaced by alanine. (F) Same as (D) except J.Cbl-b cells reconstituted with WT or PRR mutants were used for anti-Cbl-b IP. (G) Same as (B) except Jurkat and J.STS1 cells were used for anti-Cbl-b IP. (H) Same as (G) except J.STS1 cells reconstituted with WT and mutants were used. (I) Same as (G) except J.Cbl-b cells reconstituted with WT and mutant AAVAA were used.
Figure 2.
Figure 2.. Acidic pHe-induced suppression of T cell function is mediated by STS1 and Cbl-b.
(A) In vitro phosphatase assay using DifMUP as substrate and the phosphatase domains of the indicated recombinant proteins under different pH. (B) Immunoblot using lysates from Jurkat cells stimulated with anti-TCR antibodies in PBS at indicated pHe. WCLs were subjected to STS1 IP. (C) Measured pHi of T cells in indicated pHe buffer. (D) In vitro proliferation of CD8+ T cells from WT, STS1, Cbl-b single or doubly deficient mice labeled with CellTrace Violet and stimulated by plate-bound anti-CD3 antibody for 72 hr at 1 or 0.1 μg/mL at pHe 7.4 or 6.6. (E) Same as (D) except CD25 was detected. (F) Same as (D) except granzyme B was detected. (G) Same as (D) except IFNγ in the medium was detected by ELISA.
Figure 3.
Figure 3.. Acidic pHe induced T cell suppression is mediated by the unconventional phosphatase domain of STS1.
(A) CD69 induction of WT, STS1−/− or Cbl-b−/− OT-1 T cells incubated with splenocytes loaded with different concentrations of OVA, Q4H7 and G4 peptides at pHe 7.4 or 6.6 overnight. (B) STS1 mutant constructs. Location of each mutation was shown. STS1-SHP1 chimeric mutant was created by replacing the STS1 phosphatase domain with SHP1 phosphatase domain. (C) CD69 induction of STS1−/− OT-1 T cells expressing STS1-SHP1 chimera stimulated with G4 peptide-loaded splenocytes. The CD69 median fluorescence intensities (MFIs) of STS1-SHP1-reconstituted cells (mCherry+) and non-reconstituted cells (mCherry) were quantified. (D) Same as (C) except cells were reconstituted with WT STS1 or different mutants and stimulated at pHe 7.4 or 6.6. (E) Quantification of CD69 MFIs from (D). (F) Cbl-b mutants used to study pH sensitivity. Murine Cbl-b was coupled to T2A-EGFP at the C-terminus for gating purposes (not shown). Location of each mutant is depicted. (G) IFNγ expression in Cbl-b−/− OT-1 T cells expressing Cbl-b mutants stimulated with G4 peptide-loaded splenocytes at pHe 7.4 or 6.6.
Figure 4.
Figure 4.. Suppression of T cell proliferation and differentiation in vivo is mediated by STS1 and Cbl-b.
(A) In vivo proliferation of WT OT-1 T cells (CellTrace Yellow-labeled) and STS1−/− OT-1 T cells (CellTrace Violet-labeled) in the lymph nodes (LNs) after ovalbumin stimulation. (B) Quantification of divided and undivided populations of WT and STS1−/− OT-1 cells in (A). (C) Proliferation index of WT and STS1−/− OT-1 T cells in (A). (D) Same as (A) except WT and Cbl-b−/− OT-1 T cells were used. (E) Same as (B) except WT and Cbl-b−/− OT-1 T cells were used. (F) Proliferation index of WT and Cbl-b−/− OT-1 T cells in (D). (G) Same as (A) except CD44 and CD62L expressions are plotted. (H) Same as (G) except WT and Cbl-b−/− OT-1 T cells were used. (I) Same as (G) except TCF1 expression in divided and undivided cells was analyzed. The MFIs of TCF1 were quantified. (J) Same as (I) except WT and Cbl-b−/− OT-1 T cells were used. (K) Same as (I) except PD1 expression was analyzed. (L) Same as (K) except WT and Cbl-b−/− OT-1 T cells were used. (M) Same as (K) except CXCR3 expression was analyzed. (N) Same as (M) except WT and Cbl-b−/− OT-1 T cells were used. (O) In vivo Tfh differentiation of WT, STS1−/− or Cbl-b−/− OT-2 T cells after ovalbumin stimulation. PD1+ CXCR5+ OT-2 T cells were quantified. (P) Same as (O) except CXCR5+ Bcl-6+ OT-2 T cells were quantified.
Figure 5.
Figure 5.. Assessment of autocrine and paracrine acid sources in vivo.
(A) Measured pHi of T cells treated with vehicle or EIPA and stimulated by plate-bound anti-CD3 antibodies for 72 hr. (B) Same as (A) except cells were assessed for proliferative response or CD25 and Granzyme B expressions. (C) OT-1 mice were injected with ovalbumin in the footpad for 72 hr, followed by Cy5-pHLIP in the hock. CD44 and CD62L expression of OT-1 T cells in the popliteal LNs were plotted.

(D) Same as (C) except Cy5-pHLIP was detected in CD44Hi and CD44Lo populations. (E) The MFIs of Cy5-pHLIP in (D) were quantified. (F) Scheme same as (C) except 106 Pmel-1 T cells were adoptively transferred into OT-1 mice before the treatment. CD44 and CD62L expression of Pmel-1 T cells in the LNs were plotted. (G) Same as (F) except Cy5-pHLIP was detected in CD44Hi, CD44Lo OT-1 and Pmel-1 T cells. The percentages of pHLIPHi Pmel-1 T cells in the LNs were quantified.
Figure 6.
Figure 6.. STS1 or Cbl-b deficiencies suppressed prostate tumor progression.
(A) TRAMP-C2 tumor growth at the right flank in WT, STS1−/− or Cbl-b−/− mice. Tumor sizes were measured twice weekly. (B) Tumor volumes measured at 45 days post tumor implantation. (C) Survival of mice implanted with tumor cells. (D) Number of CD3+ CD8+ T cells normalized per mg of tumor. Tumor-infiltrating T cells were analyzed by flow cytometry. Gated CD45+ CD3+ CD8+ cells are shown. (E) Quantification of percentages of Spas-1-specific (Spas-1+) CD8+ T cells in (D). (F) Quantification of the MFIs of TCF1 in Spas-1+ T cells in (E). (G) Same as (F) except PD1, TIM3 and LAG3 were detected. Quantification of percentages of T cells positive for 0, 1, 2, or 3 proteins. (H) Quantification of PD1 TIM3 LAG3 populations in (G). (I) Quantification of PRF1 MFIs in Spas-1+ T cells in (E). (J) Same as (D) except spleocytes were used. The percentages of Spas-1+ CD8+ T cells were quantified. (K) Splenocytes from tumor-bearing mice were stimulated with anti-CD3/CD28 antibody-coated beads at pHe 7.4 or 6.6. After 72 hr, Granzyme B in Spas-1-specific CD8+ T cells were analyzed. The ratios of granzyme B MFI of cells cultured in pHe 6.6 to 7.4 were quantified.
Figure 7.
Figure 7.. Neutralizing the acidic TME pHe improvement of T cell function depended on STS1 or Cbl-b.
(A) B16-F10 melanoma growth in the right flank of WT, STS1−/− or Cbl-b−/− Pmel-1 mice. Tumor sizes were measured twice weekly. (B) Survival of mice implanted with tumor cells. (C) Number of CD8+ Vβ13+ Pmel-1 T cells normalized to mg of tumor. Tumor-infiltrating T cells were analyzed by flow cytometry. Gated CD8+ Vβ13+ cells are shown. (D) Quantification of CD44+ CD62L population in (C). (E) PD1, TIM3 and LAG3 were detected within CD8+ Vβ13+ T cells. Quantification of percentages of T cell positive for 0, 1, 2, or 3 proteins. (F) Quantification of PD1 TIM3 LAG3 populations in (E). (G) Quantification of PD1+ TIM3+ LAG3+ populations in (E). (H) Quantification of Tox+ population in (C). (I) Same as (C) except splenocytes were used. The percentages of CD44+ CD62L+ population in Vβ13+ CD8+ T cells were quantified. (J) Splenocytes from tumor-bearing mice were stimulated with mgp100 peptide in pHe 7.4 or 6.6 overnight. The MFIs of CD69 on CD8+ Vβ13+ T cells were quantified. The ratios of CD69 MFI in pHe 6.6 to 7.4 were quantified. (K) WT, STS1−/− and Cbl-b−/− OT-1 T cells were stimulated with OVA peptide-loaded splenocytes in pHe 7.4 or 6.6, followed by fresh medium with IL-2. Cytolytic T cells were co-cultured with ovalbumin-expressing B16-F10 cells at different effector-to-target (E:T) cell ratios for 72 hr. The percentages of dead cancer cells were detected by flow cytometry and quantified. (L) Mice were injected with saline or esomeprazole (PPI) 24 hr before Cy5-pHLIP injection. Tumor areas were circled in yellow and the MFIs were quantified by ImageJ. Scale bar = 13 mm. (M) Same as (A) except one day after tumor size reached 100 mm3, mice were injected with PPI every other day for total 6 injections. Tumor volumes were measured at the day of harvest. (N) Quantification of PD1 TIM3 LAG3 populations in CD8+ Vβ13+ tumor-infiltrating T cells in (M). (O) Same as (N) except the percentages of PD1+ TIM3+ LAG3+ populations were quantified. (P) Same as (N) except the MFIs of Ki67 were quantified. (Q) Same as (N) except the ratios of CD8+/Treg were quantified. (R) Measured pHi of T cells treated with PPI and stimulated by plate-bound anti-CD3 antibodies for 72 hr. (S) Same as (R) except cells were subjected to the detection of proliferation, CD25 and Granzyme B expressions.

References

    1. Iwashima M, Irving BA, van Oers NS, Chan AC, and Weiss A (1994). Sequential interactions of the TCR with two distinct cytoplasmic tyrosine kinases. Science 263, 1136–1139. 10.1126/science.7509083. - DOI - PubMed
    1. Courtney AH, Lo WL, and Weiss A (2018). TCR Signaling: Mechanisms of Initiation and Propagation. Trends Biochem Sci 43, 108–123. 10.1016/j.tibs.2017.11.008. - DOI - PMC - PubMed
    1. Gaud G, Lesourne R, and Love PE (2018). Regulatory mechanisms in T cell receptor signalling. Nat Rev Immunol 18, 485–497. 10.1038/s41577-018-0020-8. - DOI - PubMed
    1. Mandl JN, Monteiro JP, Vrisekoop N, and Germain RN (2013). T cell-positive selection uses self-ligand binding strength to optimize repertoire recognition of foreign antigens. Immunity 38, 263–274. 10.1016/j.immuni.2012.09.011. - DOI - PMC - PubMed
    1. Zinzow-Kramer WM, Weiss A, and Au-Yeung BB (2019). Adaptation by naive CD4(+) T cells to self-antigen-dependent TCR signaling induces functional heterogeneity and tolerance. Proc Natl Acad Sci U S A 116, 15160–15169. 10.1073/pnas.1904096116. - DOI - PMC - PubMed

Publication types

MeSH terms

Substances