. 2023 Dec 12;56(12):2699-2718.e11.
doi: 10.1016/j.immuni.2023.11.005.

Stat5 opposes the transcription factor Tox and rewires exhausted CD8+ T cells toward durable effector-like states during chronic antigen exposure

Affiliations

Stat5 opposes the transcription factor Tox and rewires exhausted CD8+ T cells toward durable effector-like states during chronic antigen exposure

Jean-Christophe Beltra et al. Immunity. .

Abstract

Rewiring exhausted CD8+ T (Tex) cells toward functional states remains a therapeutic challenge. Tex cells are epigenetically programmed by the transcription factor Tox. However, epigenetic remodeling occurs as Tex cells transition from progenitor (Texprog) to intermediate (Texint) and terminal (Texterm) subsets, suggesting development flexibility. We examined epigenetic transitions between Tex cell subsets and revealed a reciprocally antagonistic circuit between Stat5a and Tox. Stat5 directed Texint cell formation and re-instigated partial effector biology during this Texprog-to-Texint cell transition. Constitutive Stat5a activity antagonized Tox and rewired CD8+ T cells from exhaustion to a durable effector and/or natural killer (NK)-like state with superior anti-tumor potential. Temporal induction of Stat5 activity in Tex cells using an orthogonal IL-2:IL2Rβ-pair fostered Texint cell accumulation, particularly upon PD-L1 blockade. Re-engaging Stat5 also partially reprogrammed the epigenetic landscape of exhaustion and restored polyfunctionality. These data highlight therapeutic opportunities of manipulating the IL-2-Stat5 axis to rewire Tex cells toward more durably protective states.

Keywords: CD8(+) T cell; IL-2; PD-1 blockade; Stat5; Tex intermediate; Tox; epigenetic reprogramming; exhaustion; orthogonal IL-2:IL2Rβ.


Conflict of interest statement

Declaration of interests A.C.H. performed consulting work for Immunai and receives research funding from B.M.S and Merck. K.C.G. is the founder of Synthekine. E.J.W. is a member of the Parker Institute for Cancer Immunotherapy, which supported the study. E.J.W. is an advisor for Coherus, Danger Bio, Marengo, Janssen, NewLimit, Pluto Immunotherapeutics, Related Sciences, Santa Ana Bio, Synthekine. E.J.W. is a founder of Arsenal Biosciences.

Figures

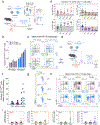
Figure 1:
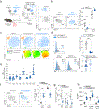
Figure 1:. Stat5a and Tox are reciprocally active and oppositely regulated in Ag-specific CD8+ T cells during chronic infection.
A- Ingenuity pathways analysis (IPA) was performed on differentially expressed genes (DEGs; pval≤0.05) between WT and ToxKO CD8+ T cells (Table. S1). B- Transcriptional regulators identified by IPA and enriched in WT (grey) or ToxKO (blue) CD8+ T cells. Non-significant hits are colored in black. Bubble size represents the number of genes considered by the IPA for each TF (Table. S1). C- Taiji rank analysis identifying TFs with increased activity in indicated subsets based on published RNAseq and ATACseq data. Plotted are overlapping TFs identified in both the IPA analysis in Fig. 1B and the independent Taiji analysis. D- IPA regulators enriched from Fig. 1B (logp≥10) and in the independent Taiji Rank analysis in Fig. 1C were plotted based on their fold change in Taiji enrichment for Texint cells (Y-axis) and correlation of the IPA-defined gene network for each TF to Tox expression (X-axis). E- UMAP of re-processed scRNAseq of LCMV-specific P14 CD8+ T cells at d8 (upper panel) or d30 (lower panel) post LCMV clone 13 (Cl13) infection. Module scores for a Stat5a network (defined by the IPA; left) or Tox signature (right; genes enriched in P14 WT versus P14 ToxKO) were used to color the UMAP. F- Correlation scores between Stat5a network and a Tox signature at indicated time of Cl13 infection. Please see also Figure S1 and Table S1.
Figure 2:
Figure 2:. Stat5 opposes Tox and antagonizes establishment of exhaustion.
A- Experimental design. B- Frequency of Ly108-Tim-3-defined subsets in indicated RV+ (Violet-excited positive [VEX+]) populations at d8p.i. C- t-sne representation of flow cytometry data highlighting FlowSOM clusters for bulk VEX+ P14 cells (left), P14 EmptyVEX+ (middle) and P14 STAT5CAVEX+ (right) (see methods). D- Tcf1 and Tox expression in indicated RV+ (VEX+) populations at d8p.i. E- MFI of indicated markers (ratio P14 STAT5CA/P14 Empty). F- Frequency of Ly108-Tim-3-defined subsets in indicated YFP+ (cre+) populations at d8p.i. G- Absolute numbers of indicated YFP+ (cre+) populations at d8p.i. H- Tox expression in indicated sub-populations of YFP+ (cre+) P14 WT and P14 Stat5iKO at d8p.i. (B) N=3 independent experiments (ind exp) with 12 mice per group (D) N=2 (Tcf1) or 4 (Tox) with 8 (Tcf1) or 15 (Tox) mice per group (E) N=2–4 ind exp with 6–16 mice per group (F-G) N=3 ind exp with 10–12 mice per group (H) N=2 with 7–9 mice per group. Mean ± SEM shown. For statistical analysis, paired (B, D) or unpaired (F-H) two-tailed Student’s t test were performed. A Wilcoxon signed rank test was performed for E with a hypothetical value of 1. *p < 0.0332, **p < 0.0021, ***p < 0.0002, ****p < 0.0001. Please see also Figure S2.
Figure 3:
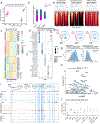
Figure 3:. Enhanced Stat5a activity restrains Tox and the exhaustion program while supporting an effector epigenetic landscape.
Splenic P14 Empty and P14 STAT5CA cells isolated at d8 of Cl13 infection were analyzed by ATACseq. Naïve (not depicted) and P14 CD8+ T cells isolated from Arm infected mice at d8p.i. were used as reference. A- PCA of normalized ATACseq counts (top 500 DAPs). B- Number of peaks more accessible in indicated populations and comparisons (FDR 0.01, lfc≥2). C- Clustered heatmap (k-means) of DAPs between P14 Empty and P14 STAT5CA. D- Top 10 motifs (Homer) enriched in DAPs from corresponding clusters in Fig.3C. E- Heatmap of accessibility for indicated populations at Tox-related enhancers (more accessible in ToxWT versus ToxKO P14 CD8+ T cells; left) or genomic regions more accessible in Tex (versus naïve, Teff and Tmem; middle) or Teff (versus naïve, Tex and Tmem) cells (FDR 0.01, lfc>3; Table S2). F- Frequency of genes from indicated signature gene lists, (Table S2) with DAPs between P14 Empty and P14 STAT5CA that possess direct binding sites for Stat5 (based on published CHIPseq). G- Average change in accessibility of DAPs between P14 Empty and P14 STAT5CA that overlapped (blue) or not (grey) with a Stat5 binding site. H- Dot plot of exhaustion signature genes containing at least 3 DAPs between P14 Empty and P14 STAT5CA cells and scored by the number of DAPs per gene (Y-axis), average lfc (X-axis) and number of Stat5 binding sites (bubble size). I- ATACseq, Cut&Run (H3K27ac) and CHIPseq (NFAT1, NFAT2 and Stat5) tracks at the Tox locus. Blue highlights indicate ATAC peaks reduced in P14 STAT5CA cells compared to P14 Empty. J- Top 10 local motif (homer) at Tox enhancers (FDR<0.05). Please see also Figure S3 and Table S2.
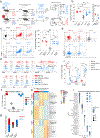
Figure 4:
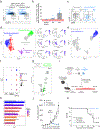
Figure 4:. Constitutive Stat5a activity drives a stable and protective effector-NK-like CD8+ T cell differentiation state during chronic viral infection and cancer.
A- Frequency of co-transferred P14 Empty and P14 STAT5CA cells among RV+ (violet excited fluorescent protein [VEX+]) CD8+ T cells at d27p.i. with Cl13 (left) or Cl13 with CD4-depletion (right). B- Ratio of cell number (P14 STAT5CA/P14 Empty) at indicated time points in the spleen. C- Frequency of Ly108-CD69-defined subsets in indicated populations of VEX+ cells at d27p.i. D-E UMAP of scRNAseq data combining P14 EmptyVEX+ and P14 STAT5CAVEX+ cells isolated at d27p.i. plotting Seurat clusters (D-left), samples (E) or selected genes (D-right). F- Module scores for indicated signatures in Seurat clusters from Fig. 4D. G- DEGs (log2FC>0.25, p_value_adj≤0.05) between C2 and C3 from Fig. 4D. H- Gene ontology for genes Up in C2 vs C3 from Fig. 4D. I- Experimental design. J-K- B16gp33 tumor growth (J) and Kaplan Meyer survival curve (K) for each experimental group. (A) Representative of 2 ind exp with 10 mice per group (B) N=4 ind exp with 16–21 mice per time points (C) Representative of 2 ind exp with 9–10 mice per group (J-K) Representative of 2 ind exp with at least 6 mice per group in each. Mean ± SEM shown. For statistical analysis, a Wilcoxon signed rank test was performed with a hypothetical value of 1 (B). **p < 0.0021. Please see also Figure S4 and Table S3.
Figure 5:
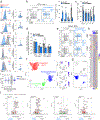
Figure 5:. Stat5-signals drive Texint cell development and are essential for CD8+ T cell responses to PD-L1 blockade.
A- Expression of key markers on indicated splenic populations at d27p.i. B-C Frequency (B) and absolute number (C) of Ly108 and CD69-defined subsets among indicated yellow fluorescent protein positive (YFP+, cre+) populations of P14 Empty and P14 Stat5iKO at d27p.i. D- Absolute numbers of Tmem and Ly108+ Texprog cells in indicated P14 populations at d27 post Arm (memory) or Cl13 (Ly108+ progenitors) infection with (YFP+cre+) or without (YFPcre) in vitro treatment with tat-cre recombinase prior to adoptive transfer. E- Frequency of Ly108 and CD69-defined subsets among YFP+ (cre+) P14 WT and P14 Stat5iKO cells at d35p.i. in CD4+ T cell-sdepleted hosts treated (αPD-L1) or not (PBS) with anti-PD-L1 antibodies (see methods). F-G- UMAP plotting RNA-defined Seurat clusters (F-left) or samples (G) from CITEseq analysis of P14 WT and P14 Stat5iKO cells isolated at d27p.i. H- Top DEGs between P14 WT and P14 Stat5iKO. I- Number of DEGs between oligo-tagged antibodies (Ly108 and CD69)-defined populations (see Fig. S6D,E). J- DEGs (FC≥0.25) between indicated oligo-tagged antibodies (Ly108 and CD69)-defined populations of P14WT and P14 Stat5iKO cells. (A) N=2–5 ind exp with 6–18 mice per group (B) N=4 ind exp with 14 mice per group (C) N=3 ind exp with 9–10 mice per group (D) N=1–2 ind exp with 2–8 mice per group (E) Representative of 2 ind exp with 8–10 mice per group. Mean ± SEM shown. For statistical analysis, unpaired (B-D) two-tailed Student’s t tests were performed. A Wilcoxon signed rank test was performed for A with a hypothetical value of 1. *p < 0.0332, **p < 0.0021, ***p < 0.0002, ****p < 0.0001. Please see also Figure S5, S6 and Table S4.
Figure 6:
Figure 6:. Orthogonal IL-2:IL2Rβ-triggered Stat5 activation in Ag-specific CD8+ T cells enforces Texint cell development and synergizes with PD-L1 blockade.
A- Experimental design. B- Absolute numbers of yellow fluorescent protein positive (YFP+) P14 Empty and P14 IL2Rβ-ortho cells isolated at d26p.i. from experimental groups infused with indicated concentration of orthoIL-2. C- Frequency of Ly108 and CD69-defined subsets among co-transferred P14 EmptyYFP+ and P14 IL2Rβ-orthoYFP+ cells isolated at d26p.i. from indicated experimental groups. D- Frequency of indicated subsets among P14 IL2Rβ-orthoYFP+ cells isolated at d26p.i. from experimental groups infused with indicated concentrations of orthoIL-2. Dotted grey lines indicate mean frequencies of each sub-population across all experimental groups in P14 IL2Rβ-orthoYFP- control cells. E- Experimental design. F-G Ratio of cell number (P14 IL2Rβ-orthoYFP+/P14 EmptyYFP+) (F) and relative frequency (G) of P14 EmptyYFP+ and P14 IL2Rβ-orthoYFP+ cells in indicated experimental groups at d35p.i. Combo stands for αPD-L1+orthoIL-2 (100KIU). H- Frequency of Ly108 and CD69-defined subsets among P14 EmptyYFP+ and P14 IL2Rβ-orthoYFP+ cells isolated at d35p.i. from indicated experimental groups. I- Ratio of cell number between indicated subsets of P14 IL2Rβ-orthoYFP+/P14 EmptyYFP+ in indicated experimental groups at d35p.i. (B) N=2 ind exp with 6–10mice per group (C) N=2 with 6 mice per group (D) N=2 with 6–17 mice per group (F-I) N=2 with 9–15 mice per group. Mean ± SEM shown. For statistical analysis, a Wilcoxon signed rank test was performed for with a hypothetical value equal to the mean in control (PBS) group (F, I). *p < 0.0332, **p < 0.0021. Please see also Figure S7.
Figure 7:
Figure 7:. Targeted IL-2-Stat5 signals on rechallenged Texprog provokes a partial epigenetic rewiring of these cells and improves function.
A- Experimental design. P14 Memory (Memory) and P14 Ly108+ Tex progenitors expressing the IL2Rβ-ortho receptor (yellow fluorescent protein positive [YFP+], Tex) were sorted from indicated time post Arm (d≥90p.i.) or Cl13 (d26p.i.) infection respectively (see sorting strategy – right panel), transferred into new hosts (2.5×10³ each) and challenged with LCMV Arm. Mice injected with Tex cells (Ly108+ P14 expressing IL2Rβ-orthoYFP+) were treated with either PBS (Tex[PBS]) or daily infusion of orthoIL-2 (150KIU day 3–7; [Tex[oIL2]) in combination or not with αPD-L1 blockade (day0, −3 and −6p.ch.). P14 memory cells were treated with PBS or αPD-L1 at similar time points. Cells were analyzed in the spleen at d8p.ch. B- Absolute numbers in the spleen at d8 (left) and 40 p.ch. (right). C- Cytokine secretion after 5h of in vitro re-stimulation with gp33 peptide. D- MFI of indicated markers on re-challenged memory and Tex cells from each experimental condition. E- Frequency of KLRG1 and CD127-defined sub-populations among re-challenged memory and Tex cells from indicated experimental groups. F- PCA of normalized ATACseq counts (top 500 DAPs). G- Number of peaks more accessible in indicated populations and comparisons (FDR 0.01, lfc≥2). H- Clustered heatmap (k-means) plotting all DAPs between indicated populations (Table S5). I- Motif enrichment analysis (Homer) plotting the top 10 motifs enriched in DAPs from corresponding clusters in Fig.7H. (B) N=5 with 5–18 mice per group (C) Representative of 2 ind exp with 2–8 mice per group (D) Representative of 5 ind exp with 5–18 mice per group (E) N=5 with 5–18 mice per group. Mean ± SEM shown. For statistical analysis, unpaired (B, C, E) two-tailed Student’s t tests were performed. *p < 0.0332, **p < 0.0021, ***p < 0.0002, ****p < 0.0001. Please see also Table S5.

Comment in

References

    1. Ramakrishna S, Barsan V, and Mackall C (2020). Prospects and challenges for use of CAR T cell therapies in solid tumors. Expert Opin Biol Ther 20, 503–516. 10.1080/14712598.2020.1738378. - DOI - PubMed
    1. McLane LM, Abdel-Hakeem MS, and Wherry EJ (2019). CD8 T Cell Exhaustion During Chronic Viral Infection and Cancer. Annu Rev Immunol 37, 457–495. 10.1146/annurev-immunol-041015-055318. - DOI - PubMed
    1. Collier JL, Weiss SA, Pauken KE, Sen DR, and Sharpe AH (2021). Notso-opposite ends of the spectrum: CD8(+) T cell dysfunction across chronic infection, cancer and autoimmunity. Nat Immunol 22, 809–819. 10.1038/s41590-021-00949-7. - DOI - PMC - PubMed
    1. Wherry EJ, Blattman JN, Murali-Krishna K, van der Most R, and Ahmed R (2003). Viral persistence alters CD8 T-cell immunodominance and tissue distribution and results in distinct stages of functional impairment. J Virol 77, 4911–4927. - PMC - PubMed
    1. Zajac AJ, Blattman JN, Murali-Krishna K, Sourdive DJ, Suresh M, Altman JD, and Ahmed R (1998). Viral immune evasion due to persistence of activated T cells without effector function. J Exp Med 188, 2205–2213. - PMC - PubMed

Publication types

MeSH terms