. 2024 Jan;625(7996):760-767.
doi: 10.1038/s41586-023-06921-9. Epub 2023 Dec 13.

GDF15 linked to maternal risk of nausea and vomiting during pregnancy

Affiliations

GDF15 linked to maternal risk of nausea and vomiting during pregnancy

M Fejzo et al. Nature. 2024 Jan.

Abstract

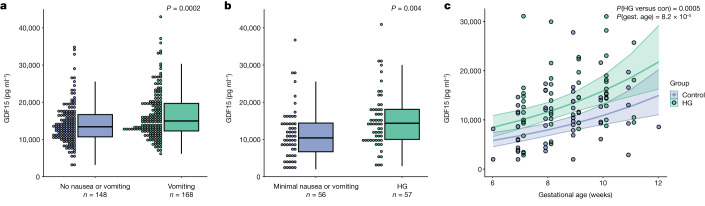
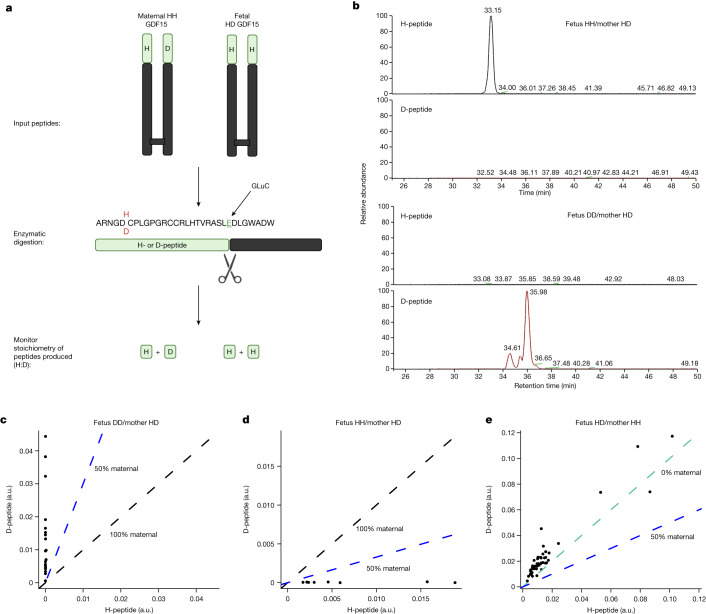
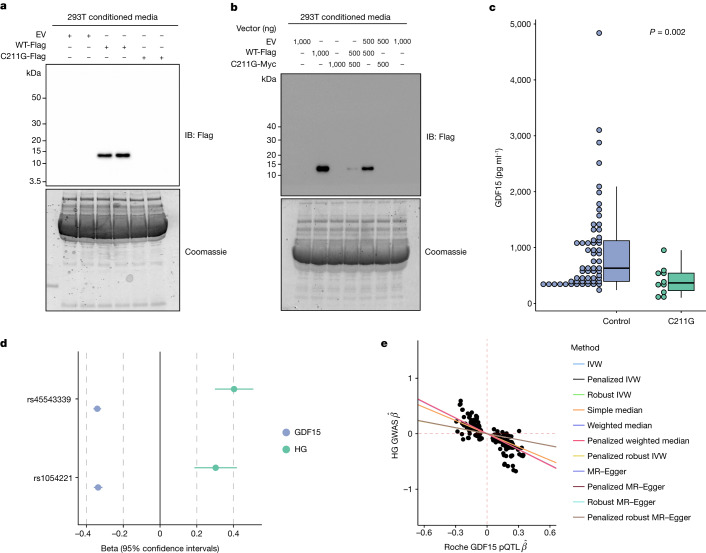
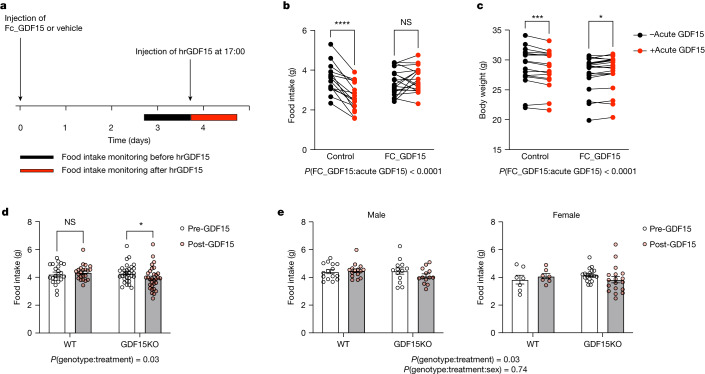
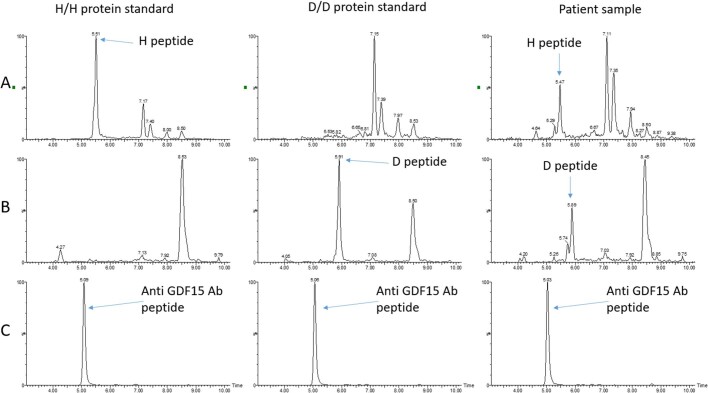
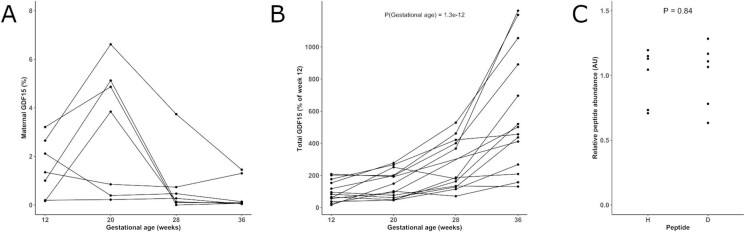
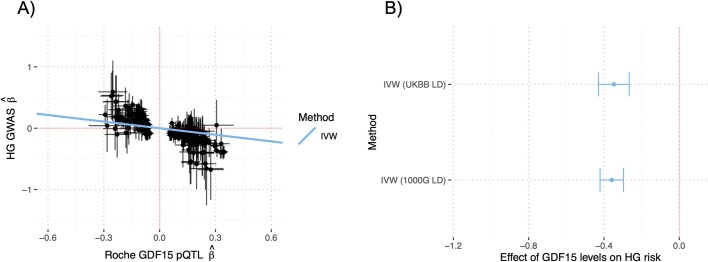
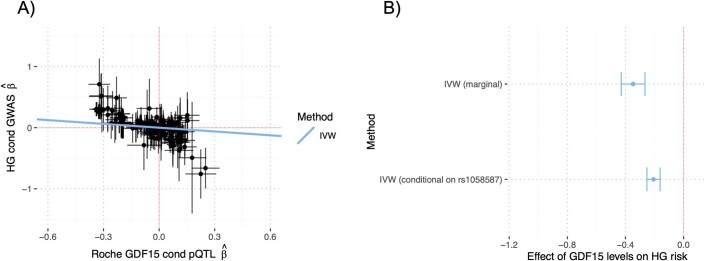
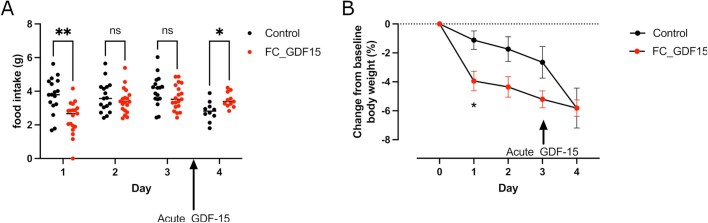
GDF15, a hormone acting on the brainstem, has been implicated in the nausea and vomiting of pregnancy, including its most severe form, hyperemesis gravidarum (HG), but a full mechanistic understanding is lacking1-4. Here we report that fetal production of GDF15 and maternal sensitivity to it both contribute substantially to the risk of HG. We confirmed that higher GDF15 levels in maternal blood are associated with vomiting in pregnancy and HG. Using mass spectrometry to detect a naturally labelled GDF15 variant, we demonstrate that the vast majority of GDF15 in the maternal plasma is derived from the feto-placental unit. By studying carriers of rare and common genetic variants, we found that low levels of GDF15 in the non-pregnant state increase the risk of developing HG. Conversely, women with β-thalassaemia, a condition in which GDF15 levels are chronically high5, report very low levels of nausea and vomiting of pregnancy. In mice, the acute food intake response to a bolus of GDF15 is influenced bi-directionally by prior levels of circulating GDF15 in a manner suggesting that this system is susceptible to desensitization. Our findings support a putative causal role for fetally derived GDF15 in the nausea and vomiting of human pregnancy, with maternal sensitivity, at least partly determined by prepregnancy exposure to the hormone, being a major influence on its severity. They also suggest mechanism-based approaches to the treatment and prevention of HG.


Conflict of interest statement

D.S.C.-J. reports non-financial support from Roche Diagnostics Ltd, outside the submitted work; G.C.S.S. reports personal fees and non-financial support from Roche Diagnostics Ltd, outside the submitted work; D.S.C.-J. and G.C.S.S. report grants from Sera Prognostics Inc, non-financial support from Illumina Inc, outside the submitted work. G.C.S.S. has been a paid consultant to GSK (preterm birth) and is a member of a Data Monitoring Committee for GSK trials of RSV vaccination in pregnancy. N.S. and P.W. have received grant funding from Roche Diagnostics paid to their institution for biomarker work inclusive of GDF15 measurements. J.R.B.P. is an employee and shareholder of Adrestia Therapeutics Ltd. K.M.G. is a paid consultant for BYOMass Inc. C.L.M. has received research funding and equipment at reduced cost from Dexcom Inc. G.T. is a full-time employee of Regeneron Genetics Center and receives salary, stock and stock options as compensation. F.M.G. has received research grant support from Eli-Lilly and AstraZeneca outside the scope of this current work. M.S.F. is a paid consultant for Materna Biosciences, Inc., NGM Biopharmaceuticals, and a Board member and Science Advisor for the Hyperemesis Education and Research Foundation. S.O. has undertaken remunerated consultancy work for Pfizer, Third Rock Ventures, AstraZeneca, NorthSea Therapeutics and Courage Therapeutics. Part of the work in this paper is the subject of a pending patent application relating to therapy for hyperemesis gravidarum filed by Cambridge Enterprise Limited (GB application No. 2304716.0; Inventor: Professor Stephen O’Rahilly). S.L. and N.R. are named creators on this patent. All other authors declare no competing interests.

Figures

Fig. 1
Fig. 1. Circulating GDF15 is elevated in women experiencing nausea and vomiting in pregnancy and hyperemesis gravidarum.
a, Dot and box plots illustrating the distribution of circulating GDF15 levels in women at approximately 15 weeks’ gestation with a history of vomiting in pregnancy versus those reporting no nausea and vomiting in pregnancy. P value is from an unadjusted linear regression model using natural-log transformed GDF15 concentrations. b, Dot and box plots illustrating the distribution of GDF15 levels (mean gestational age is approximately 10 weeks) in women presenting with hyperemesis gravidarum (HG) and those with low levels of nausea and vomiting in pregnancy. P value is from an unadjusted linear regression model using natural-log transformed GDF15 concentrations. c, Scatter plot illustrating the relationship between gestational age and GDF15 in the first trimester. The trend lines show predicted values of GDF15 levels (mean ± 95% CI) in women with and without HG from a linear regression model of natural-log transformed GDF15 with gestational age and HG status included as predictor variables. The P values are derived from the same regression model for the effect of HG (HG versus con) and gestational age (gest. age). Five participants (HG = 1, control = 4) included in the analysis in panel b are not plotted or included in this model as they were recruited after the first trimester. The box plots in a and b are Tukey box plots: the lower whiskers represent minimum values, the upper whiskers represent 1.5 × IQR and the upper and lower bounds of the box represent the 75th and 25th percentiles, respectively. The centre of the box represents the median. Source Data
Fig. 2
Fig. 2. Circulating GDF15 in human pregnancy is predominantly of fetal origin.
a, Schema of experimental design. The GDF15 dimer for maternal and fetal GDF15 is extracted and then digested with the endopeptidase GluC, cutting the N-terminal region into two distinct peptides with glutamic acid C-termini. The stoichiometry of the H- and D-peptides can then be monitored using liquid chromatography with tandem mass spectrometry to determine the relative levels of maternal or fetal derived GDF15 in the maternal circulation. b, Representative liquid chromatography–mass spectrometry retention time of H- and D-peptides from maternal plasma where the mother is heterozygous at H202D and the fetus is homozygous for the H or D allele as indicated. ce, Scatter plots of the relative quantitation of H-peptide versus the D-peptide in plasma from pregnancies with the indicated genotypes. The dashed coloured lines indicate the expected relationships between the H- and D-peptides for the given circulatory origins of GDF15. c, n = 20 samples from five pregnancies. d, n = 8 samples from two pregnancies. e, n = 47 samples from 12 pregnancies. Panel a created using BioRender.com. a.u., arbitrary units. Source Data
Fig. 3
Fig. 3. Rare and common hyperemesis gravidarum risk variants lower circulating GDF15 in the non-pregnant state.
a, A rare HG risk variant, GDF15 C211G, impairs secretion of GDF15 as determined by western blotting of conditioned media from cells expressing Flag-tagged wild-type GDF15 (WT-Flag) or GDF15 C211G (C211G-Flag). b, GDF15 C211G impairs the secretion of wild-type GDF15 in a dominant-negative manner as co-expression of the mutant inhibited secretion of wild-type GDF15 from 293 T cells cotransfected with different amounts (shown in nanograms) of WT-Flag and Myc-tagged GDF15 C211G (C211G-Myc), as indicated. Representative images from three independent experiments are presented; EV = empty vector. c, Dot and box plots showing GDF15 levels measured using the Ansh total GDF15 assay in GDF15 C211G carriers (n = 10) identified by exome sequencing a Croatian population and age and sex-matched controls (n = 60) from the same study. P value is from a linear regression model of natural-log transformed GDF15 against C211G status. Box plot is a Tukey box plot: lower whiskers, minimum values; upper whisker (control), 1.5 × IQR; upper whisker (C211G), maximum value; box bounds, 25th, 50th and 75th percentiles. d, Forest plot illustrating the effect of HG risk SNPs (n(HG cases) = 1,306, n(controls) = 15,756) on circulating GDF15 measured in 18,184 participants in the Generation Scotland Study. Effect estimates for the rs1054221 variant are from an analysis conditioned on the lead HG variant rs45543339. The effect of the HG risk allele on circulating GDF15 in standard deviations and of the SNP on risk of HG in log-odds (±95% CIs) are shown. e, Scatter plot of HG genome-wide association study (GWAS) effect estimates (log-odds) versus Roche-based GDF15 pQTL effect estimates derived from cis-Mendelian randomization at the GDF15 locus. Mendelian randomization was performed using 259 SNPs with genome-wide evidence of pQTL effects on GDF15 levels within 1 Mb GDF15 locus and adjusted using LD estimates from UKBB (Methods). Causal effect estimates are reflected as regression lines. Source Data
Fig. 4
Fig. 4. Treatment with long-acting GDF15 influences the response to the anorectic actions of acute GDF15 treatment in mice.
a, Schema of the experimental paradigm for results presented in b and c. Adult male and female C57Bl/6 J mice were injected with 0.01 mg kg−1 of Fc-GDF15 fusion protein (Fc_GDF15) or vehicle control (PBS). Food intake was measured overnight (from 17:00 to 09:00) before (black bar) and after treatment (red bar) with short acting human recombinant GDF15 (hrGDF15 0.1 mg kg−1). b, Food intake recorded overnight (17:00 to 09:00) the day before (black dots) and after an acute bolus of hrGDF15 (red dots) in mice with and without pretreatment with Fc_GDF15. c, Body weight at 09:00 the day before (black dots) and 09:00 the day after (red dots) an acute bolus of hrGDF15 in mice with and without pretreatment with Fc_GDF15. n = 17 (12 male, 5 female) in the control and 19 in the FC_GDF15 group (13 male, 6 female). de, In the wild-type (n = 22, 7 female, 15 male) and Gdf15−/− (n = 31, 13 male, 18 females, GDF15KO) mice food intake was measured for 24 h before (Pre-GDF15) and after (Post-GDF15) treatment with 0.01 mg kg−1 human recombinant GDF15. d, Mean ± s.e.m. food intake over a 24 h period before and after GDF15 treatment. e, The same data (mean ± s.e.m. food intake) is plotted with individual data points disaggregated by sex to demonstrate the consistency of the effect across both sexes. All P values presented in this figure are two-sided. Data were analysed with mixed-effects models, post hoc testing comparing food intake and body weight before and after acute GDF15 treatment was conducted with the Sidak test to correct for multiple testing. bc, *P = 0.02, ***P = 0.0006, ****P < 0.0001. d, *P = 0.03. NS, not significant. Source Data
Extended Data Fig. 1
Extended Data Fig. 1. LC-MS/MS traces of two GDF15 related peptides and the murine anti-GDF15 antibody peptide from the heterozygous foetus analysis.
A: N-terminal peptide from the wild-type protein, RT = ~ 5.47. B: N-terminal peptide from the mutant protein, RT = ~ 5.51. C: Peptide from the murine anti GDF15 antibody, RT = ~ 5.09. Data shown is traces generated from extracted plasma spiked with mutant homodimer, wild-type homodimer and an extracted participant sample.
Extended Data Fig. 2
Extended Data Fig. 2. Measurement of foetal and maternally derived GDF15 in pregnancy.
A: The estimated proportion of maternally derived GDF15 in 7 different pregnancies across 4 gestational ages where the foetus is homozygous for either the H or D at H202D and the mother is heterozygous at this site. B: The relative abundance of Total GDF15 measured by mass spectrometry in 14 different pregnancies where the foetus is homozygous for either H or D at H202D across 4 gestational ages, including the 7 genotype-discordant pregnancies presented in panel (A) and a further 7 pregnancies where the maternal genotype is concordant with the foetal genotype. Total GDF15 is expressed as a percentage of the mean value at 12 weeks gestation. Two sided P-value derived from a linear mixed model of log transformed Total GDF15~Gestational age with random intercepts. C: The relative abundance of N-terminal peptides from synthetic GDF15 homodimers with H or D at position 202 extracted using the R&D anti-GDF15 capture antibody coupled to magnetic beads. Plasma was fortified at the same concentration for each protein, extracted (n = 6) and analyzed by Orbitrap MS. AU = arbitrary units. Paired sample Wilcoxon test was used to compare the abundance of recovered H and D peptides, the presented P-value is two-sided. Source Data
Extended Data Fig. 3
Extended Data Fig. 3. The C211G mutant is expressed intracellularly and heterodimerizes with its wild-type counterpart.
A: Western blotting of cell lysates expressing Flag-tagged fusions of wild-type GDF15 (WT-Flag) or GDF15 C211G (C211G-Flag). B: Co-expression of wild-type GDF15 (WT-Flag) and Myc-tagged GDF15 C211G (C211G-Myc) does not impair the intracellular expression of wild-type GDF-15. C: WT and C211G form intracellular heterodimers, as judged by the co-immunoprecipitation of WT-Flag and C211G-Myc using anti-Flag antibodies. Asterisks mark co-eluted immunoglobulin light chains. Replicates, N = 3, representative images are shown. EV indicates transfections with the empty plasmid backbone only.
Extended Data Fig. 4
Extended Data Fig. 4. Mendelian Randomization estimates are robust to LD reference panel.
MR was performed using m = 259 SNPs with genome-wide evidence of pQTL effects on GDF15 levels within 1 Mb GDF15 locus and adjusted using LD estimates from 1000 G WGS individuals (n = 489; see Methods). A: Scatterplot of HG GWAS effect estimates (ie log-odds) vs Roche-based GDF15 pQTL effect estimates. Vertical and horizontal lines represent 95% confidence intervals of HG effects and GDF15 effects, respectively. Causal effects were estimated using LD-aware IVW MR and depicted as a regression line. B: Forest plot of the IVW MR causal effect-size estimates of circulating GDF15 levels on HG risk from UK Biobank and 1000 G LD references. Each point represents the estimated causal effect and 95% confidence interval of a 1 standard deviation increase in circulating GDF15 in the non-pregnant state on HG risk in log-odds. The null of no mediating/causal effect is represented as a solid red line at 0.
Extended Data Fig. 5
Extended Data Fig. 5. Mendelian Randomization estimates are robust to previously reported confounder SNP.
MR was performed using m = 258 SNPs with genome-wide evidence of pQTL effects on GDF15 levels within 1 Mb GDF15 locus after residualizing (ie conditioning) on the effect of variant rs1058587, which was previously suggested to confound quantification of GDF15 levels,. Results were adjusted using LD estimates from UKBiobank WGS individuals (n = 138335; see Methods). A Scatterplot of conditional HG GWAS effect estimates (ie log-odds) vs conditional Roche-based GDF15 pQTL effect estimates. Vertical and horizontal lines represent 95% confidence intervals of HG effects and GDF15 effects, respectively. Causal effect estimates obtained using LD-aware IVW MR and reflected as regression lines. B: Forest plot of the causal effect-size estimates of circulating GDF15 levels on HG risk from standard (ie marginal) pQTL/GWAS results and those obtained using pQTL/GWAS results conditioned on variant rs1058587. Each point represents the estimated causal effect and 95% confidence interval of a 1 standard deviation increase in circulating GDF15 in the non-pregnant state on HG risk in log-odds. The null of no mediating/causal effect is represented as a solid red line at 0.
Extended Data Fig. 6
Extended Data Fig. 6. Longitudinal effects of long acting GDF15 on food intake and body weight and mice.
A-B: The effects of 0.01 mg/kg of Fc-GDF15-15 fusion protein (FC_GDF15) or vehicle control (PBS) on food intake (A) or body weight (B). In (A) Days 1 – 3 represent 24-hour food intake from 5 pm to 5 pm after treatment with control or FC_GDF15. Day 4 represents food intake from 5 pm to 5 pm after both groups received an acute bolus of human recombinant GDF15 (0.1 mg/kg). The black lines indicate mean food intake for each day. In (B) mean +/− SEM change in body weight at 5 pm is presented as a percentage of baseline body weight. Days 1–3: N = 17 (12 male, 5 female) in Control and 19 in FC_GDF15 group (13 male, 6 female). Day 4: N = 10 (5 male, 5 female) in Control and 11 in FC_GDF15 group (5 male, 6 female) – as one cohort of mice were sacrificed at 9am on Day 4. Hypothesis testing was conducted using a mixed-effects model. Post-hoc testing comparing Control and FC_GDF15 treated groups was undertaken with the Sidak test to correct for multiple testing. A: **P = 0.002,*P = 0.04, ns = non-significant, P > 0.05, B:*P = 0.02. All reported P-values are two-sided. Source Data

References

    1. Lockhart SM, Saudek V, O’Rahilly S. GDF15: a hormone conveying somatic distress to the brain. Endocr. Rev. 2020;41:bnaa007. doi: 10.1210/endrev/bnaa007. - DOI - PMC - PubMed
    1. Fejzo MS, et al. Nausea and vomiting of pregnancy and hyperemesis gravidarum. Nat. Rev. Dis. Primers. 2019;5:62. doi: 10.1038/s41572-019-0110-3. - DOI - PubMed
    1. Fejzo MS, et al. Placenta and appetite genes GDF15 and IGFBP7 are associated with hyperemesis gravidarum. Nat. Commun. 2018;9:1178. doi: 10.1038/s41467-018-03258-0. - DOI - PMC - PubMed
    1. Tanno T, Noel P, Miller JL. Growth differentiation factor 15 in erythroid health and disease. Curr. Opin. Hematol. 2010;17:184–190. - PMC - PubMed
    1. Tanno T, et al. High levels of GDF15 in thalassemia suppress expression of the iron regulatory protein hepcidin. Nat. Med. 2007;13:1096–1101. doi: 10.1038/nm1629. - DOI - PubMed

MeSH terms