. 2024 Feb;626(7998):367-376.
doi: 10.1038/s41586-023-06914-8. Epub 2023 Dec 13.

Modelling post-implantation human development to yolk sac blood emergence

Affiliations

Modelling post-implantation human development to yolk sac blood emergence

Joshua Hislop et al. Nature. 2024 Feb.

Abstract

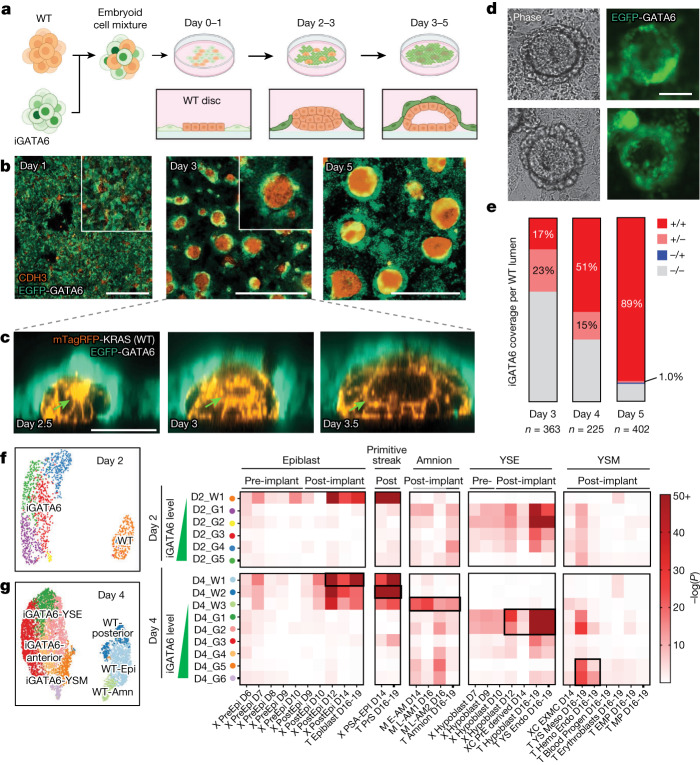
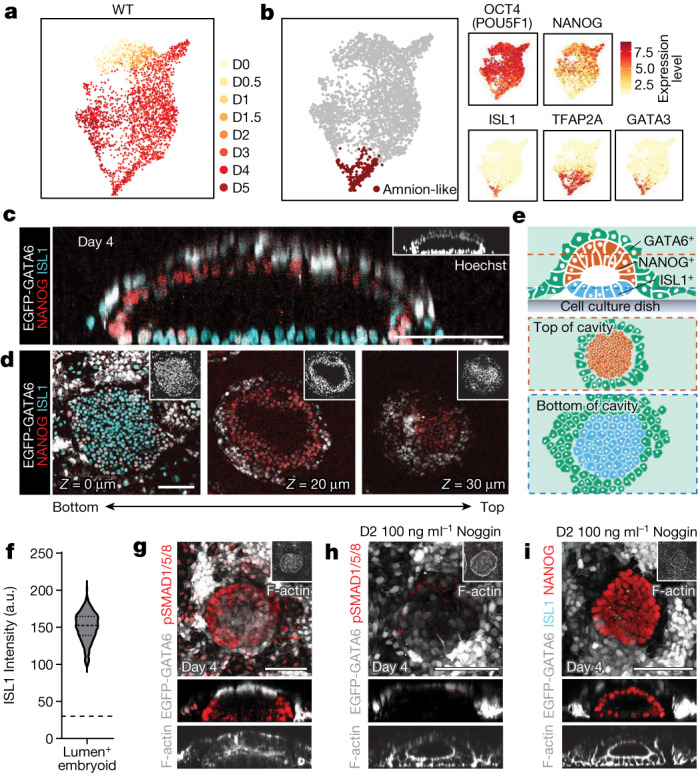
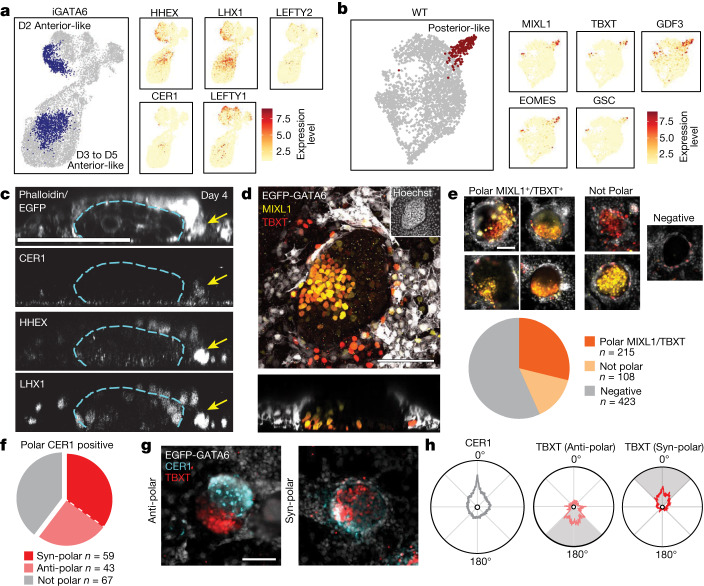
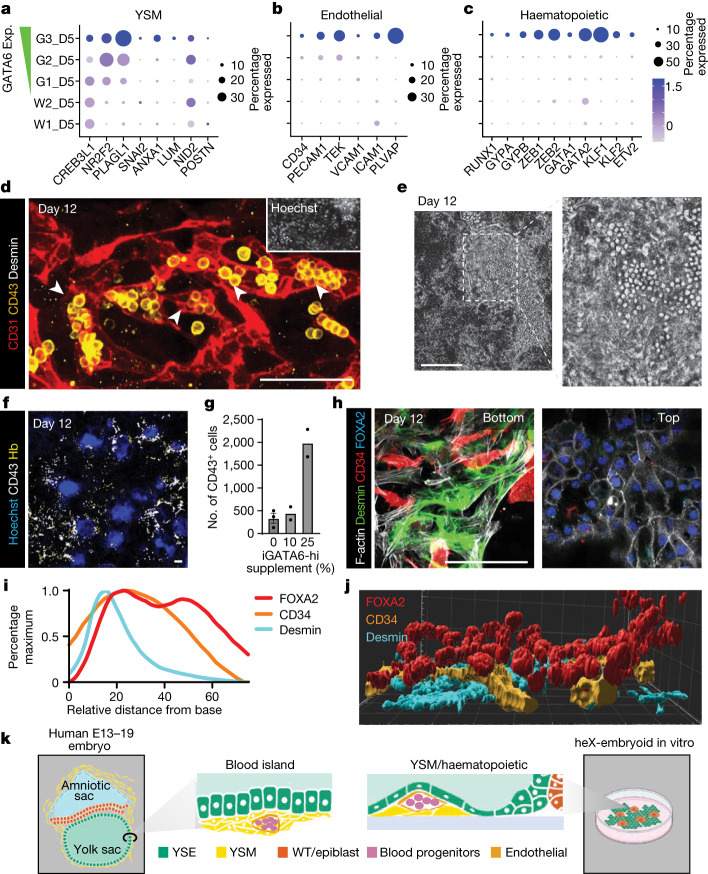
Implantation of the human embryo begins a critical developmental stage that comprises profound events including axis formation, gastrulation and the emergence of haematopoietic system1,2. Our mechanistic knowledge of this window of human life remains limited due to restricted access to in vivo samples for both technical and ethical reasons3-5. Stem cell models of human embryo have emerged to help unlock the mysteries of this stage6-16. Here we present a genetically inducible stem cell-derived embryoid model of early post-implantation human embryogenesis that captures the reciprocal codevelopment of embryonic tissue and the extra-embryonic endoderm and mesoderm niche with early haematopoiesis. This model is produced from induced pluripotent stem cells and shows unanticipated self-organizing cellular programmes similar to those that occur in embryogenesis, including the formation of amniotic cavity and bilaminar disc morphologies as well as the generation of an anterior hypoblast pole and posterior domain. The extra-embryonic layer in these embryoids lacks trophoblast and shows advanced multilineage yolk sac tissue-like morphogenesis that harbours a process similar to distinct waves of haematopoiesis, including the emergence of erythroid-, megakaryocyte-, myeloid- and lymphoid-like cells. This model presents an easy-to-use, high-throughput, reproducible and scalable platform to probe multifaceted aspects of human development and blood formation at the early post-implantation stage. It will provide a tractable human-based model for drug testing and disease modelling.


Conflict of interest statement

The University of Pittsburgh has a pending patent on behalf of the inventors J.H., R.S., S.K. and M.R.E., application no. PCT/US2023/067404, covering the derivation and generation of cell and extracellular products shown in this paper. All other authors declare no competing interests.

Figures

Fig. 1
Fig. 1. Engineering codevelopment of embryonic and extra-embryonic endoderm tissues.
a, Schematic demonstrating cell mixing and subsequent organization of iGATA6 (green) and WT (orange) hiPS cells after GATA6 induction by Dox. b, IF staining demonstrating self-organization of heX-embryoids in the cultures. c, Live time-lapse images of one embryoid showing growth of a central lumen from a rosette indicated by an arrow. d, Phase and fluorescence images from live day 4 cultures showing developed heX-embryoid morphologies with EGFP-expressing iGATA6 around a WT cluster. e, Quantification of characteristics of WT clusters possessing different iGATA6 coverage and lumen formation characteristics. No islands without coverage were observed possessing a lumen (±0%). n represents the number of heX-embryoid assessed from at least two biological replicates. f, Single-cell UMAP and hypergeometric statistical comparisons of differentially expressed gene (DEG) lists between day 2 embryoids and human and cynomolgus monkey embryo single-cell datasets. Labels above heatmaps indicate pre-implantation versus post-implantation embryo sample comparisons; grey bars under labels indicate cynomolgus monkey comparisons. Leading letters indicate the source dataset: T from ref. , X from ref. , M from ref. and XC from refs. ,. g, Single-cell UMAP and hypergeometric statistical comparisons of differentially expressed gene lists between day 4 embryoids and human and cynomolgus monkey embryo single-cell datasets. Black boxes highlight high DEG similarity (low P values) to relevant populations of interest. YSE, yolk sac endoderm; YSM, yolk sac mesoderm. For hypergeometric tests, we performed Benjamini–Hochberg correction for multiple tests in all comparisons. Tests were performed as one-sided tests. Scale bar, 50 µm (c), 100 µm (d), 1,000 µm (b). Illustration in a was created using BioRender (https://biorender.com). Source Data
Fig. 2
Fig. 2. Amniotic cavity formation and expansion.
a, Merged UMAP of all WT lineages from the embryoids labelled by day of development. b, The merged WT population showing the compartment expressing markers of amnion. ISL1, TFAP2A (AP-2α) and GATA3 are expressed in this area, whereas NANOG is negative and OCT4 is low. c, An orthogonal slice of an individual embryoid showing top to bottom compartmentalization of ISL1+ and NANOG+ cells. iGATA6 (white) cells cover the top. d, Horizontal z-slices at the indicated distance from the dish of the WT cluster from c. e, Schematic showing the position of each population within a single heX-embryoid. Dotted lines indicate the area of slices shown. f, Violin plot showing the expression of ISL1 in day 4 embryoids containing lumens (n = 350). The dotted line indicates a negative threshold for ISL1. g, Expression patterns of BMP4 effectors (phosphorylated SMAD1, SMAD5 and SMAD8/9). Lower images show a lateral slice of the WT disc. h, IF staining for the BMP4 effectors (phosphorylated SMAD1, SMAD5 and SMAD8/9) at day 4 of cultures after application of the inhibitor Noggin at day 2 of development. Lower images show a lateral slice of the WT disc. i, IF staining for ISL1 and NANOG at day 4 after application of Noggin at day 2 of development. Lower images show a lateral slice of the WT disc. Scale bars, 100 μm. n represents embryoid structures harvested from three independent experiments. a.u., arbitrary units. Source Data
Fig. 3
Fig. 3. Anterior hypoblast domain and posterior pole in heX-embryoids.
a, Merged UMAP of all iGATA6 lineages showing the compartments expressing markers of anterior hypoblast. Two separate domains of these markers were observed, one within day 2 and one within day 3–5 of the embryoid cells. (UMAP labelled by day can be seen in Extended Data Fig. 5). b, Merged UMAP of all WT lineages showing the compartment expressing markers of the posterior pole and primitive streak. c, IF staining showing a z-slice of a heX-embryoid with a HHEX/LHX1/CER1 copositive domain adjacent to a WT cluster. The dotted line indicates the boundaries of the WT cluster in each image, and the arrow indicates the copositive domain. d, IF staining showing a TBXT/MIXL1 copositive domain within the WT clusters of the embryoid. e, Examples of WT clusters with polarized TBXT/MIXL1 domains (top) or without co-expression of markers (bottom). The pie chart shows proportions of cluster types observed in the embryoid cultures, n = 746 total. f, A pie chart showing the proportion of clusters with a particular TBXT/CER1 polarity type when CER1 confined to one pole is present. n = 169 total. g, Representative WT clusters showing TBXT and CER1 expression domains at opposing poles of the cluster (anti-polar, top) or at the same pole of the cluster (syn-polar, bottom). h, Diagrams indicating the average radial expression patterns of TBXT in each polarity pattern from WT clusters with a polarized CER1-expressing domain indicated in f. All diagrams are scaled to the same expression intensity value (1 a.u.). Degrees indicate radial distance around the circularized perimeter of a WT cluster from the CER1 peak shown. Shaded areas indicate region of highest average TBXT polarity corresponding to the polarity types. Scale bars, 100 µm. n represents the embryoid structures from three to four separate experiments harvested on day 4 after induction. Source Data
Fig. 4
Fig. 4. Haematopoietic lineages and haematopoietic foci structures in the heX-embryoids.
a, Dot plot showing the expression pattern of yolk sac mesoderm markers in day 5 embryoid scRNA-seq populations. b, Dot plot showing the expression pattern of endothelial markers in day 5 embryoid scRNA-seq populations. c, Dot plot showing the expression pattern of haematopoietic markers in day 5 embryoid scRNA-seq populations. d, IF image of day 12 embryoid showing the generation of CD43+ spherical cells within CD31+ endothelial cells. e, Live phase image taken on day 12 showing cells spherical cells. The dotted box indicates area of the inset. f, IF image of a day 12 culture after GATA6-hi cells were added into the starting cell mix. g, Bar plot showing the number of CD43+ cells detected on day 12 after the given percentage of GATA6-hi cells were supplemented. n(0%) = 4 replicates, n(10%) = 2 replicates, n(25%) = 2 replicates. Error bars represent mean ± s.e.m. h, Two slices from a single representative structure demonstrating Desmin+ mesoderm-like cells and CD34+ endothelial-like cells localized underneath a FOXA2+ endoderm-like layer, reminiscent of yolk sac blood island morphology. i, Histogram showing the z-distribution of the indicated markers between the bottom of the dish and the top of the culture. Bimodal distribution of FOXA2 indicates areas of expression outside the haematopoietic foci. Distributions are averaged from nine foci from three technical replicates. j, 3D reconstruction of one haematopoietic focus showing the positioning of endoderm (FOXA2), endothelial (CD34) and mesoderm (Desmin) marker expression. k, Schematic depicting in vivo embryonic yolk sac blood islands and in vitro haematopoietic foci structures. Scale bars, 100 µm. Illustration in k was created using BioRender (https://biorender.com). Source Data
Fig. 5
Fig. 5. Haematopoietic programme characterization in heX-embryoids.
a, IF of day 12 erythroid-like progenitors. b, IF of day 12 myeloid-like progenitors. c, IF of day 12 megakaryocyte-like progenitors. d, IF of day 17 multilineage haematopoietic foci. e, IF of day 17 uni-lineage haematopoietic foci. f, Results of a CFU methylcellulose assay seeded from day 21 cultures. Counts from n = 3 biological replicates shown. Example colonies are shown. CFU-E, colony forming unit-erythroid; BFU-E, burst forming unit-erythroid; GM, colony forming unit-granulocyte, macrophage; GEMM, colony forming unit-granulocyte, erythrocyte, macrophage, megakaryocyte. g, UMAP of day 21 populations. Boxed area shows populations with similarity to in vivo haematopoietic lineages. Hypergeometric statistical comparison to ref. for these clusters is shown. For hypergeometric tests, we performed the Benjamini–Hochberg correction for multiple comparisons in all comparisons. Tests were one-sided. h, IF of day 12 and 21 cultures, showing representative erythroid-like colonies with primitive (high Hb ε, low Hb γ) characteristics on day 12 and definitive (high Hb γ, high Hb ε) characteristics on day 21. i, qPCR showing change HBE and HBG expression ratio across the indicated days. **P = 0.0012 (confidence interval 95%). P was calculated using one-way ANOVA with Tukey’s multiple comparisons test between days 12 and 21. n = 3 biological replicates sampled per day. j, Flow cytometry scatterplots showing erythroid- (CD235ab+), myeloid- (CD33+) and megakaryocyte-like (CD42b+) populations within the CD43+ population of day 21 cultures. Bar plots show cells identified within the CD43+ population in eight biological replicates. k, Flow cytometry analysis of week 3 culture for neutrophil-like cells, pregated for CD45+ cells. The bar plot shows the percentage of CD31+CD15+ cells in three biological replicates. l, Flow cytometry analysis of week 2 culture for lymphoid-like progeny, pregated for CD45+CD117+ cells. The bar plot shows the percentage of CD117+CD43+CD7+ cells in three biological replicates. m, Flow cytometry analysis of week 3 culture for natural killer-like cells, pregated for CD45+VLA-4+ cells. The bar plot shows the percentage of CD56+VLA-4+ cells in four biological replicates. Error bars are ±s.e.m. Scale bars, 100 µm. Source Data
Extended Data Fig. 1
Extended Data Fig. 1. Fate acquisition, sorting, and symmetry breaking following GATA6 induction.
(a) Schematic depicting u-Embryoid development in 3D versus from 2D > > 3D in comparison to embryo morphology. heX-embryoid is similar to a flattened yolk sac cavity with epiblast interface and amniotic cavity. (b) The gene circuit used to create inducible GATA6-expressing iPSCs. pConst is a constitutively active promoter. (c) Heterogeneity of EGFP (GATA6) activation in iGATA6 cells, detected via flow cytometry analysis. Higher gene circuit copy numbers lead to higher expression level of EGFP and GATA6. (d) 3D culture of iGATA6 and WT showing co-expression of the amnion marker ISL1 and the pluripotency marker NANOG spread fully throughout the WT layer without D-V polarization. Middle slice shows the development of a central lumen. Scale bar = 100 μm. (e) 3D culture of iGATA6 and WT showing expression of the pluripotency marker NANOG throughout the WT layer but inconsistent ISL1 expression in notable subset of these 3D tissues. These spheres do not exhibit polarization. Scale bar = 100 μm. (f) Immunofluorescence images of fixed cultures demonstrating cell organization of iGATA6 (green) and WT (NANOG) hiPSCs between day 0 and day 3 after GATA6 induction. PDGFRα rises within the iGATA6 cells as they acquire a more yolk sac endoderm-like morphology. Scale bar = 100 μm. (g) Time lapse images showing the initial confinement of red WT cells with green iGATA6 cells, followed by migration of iGATA6 cells over the WT disc before day 2 after heX-embryoid induction. Scale bar = 50 μm. (h) Time-lapse images of a single position within the iGATA6/WT co-culture from day 0 to day 3 after GATA6 induction. The top cropped images correspond to positions within the white boxes in the images below. Scale bar = 200 μm. (i) Z-slices of two representative embryoids showing localization of OCT4, GATA4, and SOX17 within the bilaminar disc-like area of embryoid culture, as well as development of a central lumen by day 5. Scale bar = 50 μm. (j) Switching media away from mTeSR on Day 0 resulted in substantial cell death. Testing media changes starting on day 2 resulted in: modified IVC1 (mIVC1) causing limited iGATA6 migration and subsequent patterning; Essential 6 (E6) media causing substantially lacking disc-like morphology and poor boundary formation; IMDM media at day 2 of culture showing WT disc formation with limited iGATA6 migration. Scale bars = 500 μm.
Extended Data Fig. 2
Extended Data Fig. 2. Lumen development and optimization within WT cluster.
(a) Embryoids at different stages of lumenogenesis. (b) Immunofluorescence images showing dynamic of LAMA1 deposition on days 1, 3, and 5 of embryoid development after induction. Dotted boxes show the areas of inset in the fourth panels of the day 3 and day 5 images. (c) Time course graphs showing the increase in LAMA1 signal in immunofluorescence images over the first five days cultures. n = 3 randomly sampled areas in one round of experiments. Error bars represent mean ± s.e.m. (d) Immunofluorescence image showing the deposition of laminin around a WT cluster with a central lumen as well as polarization of PODXL. (e) Immunofluorescence showing horizontal and lateral slices of a representative WT cluster with polarization of PODXL and ZO-1 towards a central lumen. (f) A representative cluster of WT iPSCs at day 3. No laminin deposition is observable in the vicinity of the cluster. (g) ELISA comparing secreted AFP and APOA1 detected on D0 and D5 after GATA6 induction with Dox. n = 3 biological replicates. Error bars represent mean ± s.e.m. (h) Distribution of WT cluster areas versus the number of lumens observed in heX-embryoids with iGATA6 coverage. Shaded area indicates the areas of the bilaminar disc between E9 and E17 as recorded by refs.  and ; 64% of discs observed have areas that fall into this range of values, and 39.8% have a single lumen. 33.2% fall into both categories. n = 331 total. (i) Distribution of WT cluster circularity versus the number of lumens observed in the embryoids with iGATA6 coverage, with a representative image of an embryoid with the indicated characteristics. n = 331. (j) Heatmaps displaying the average area, circularity, and resulting disc number of the embryoids resulting from different initial seeding densities of iGATA6 and WT cells. The dotted box shows the optimized seeding density used for the experiments. (k) Distribution of WT cluster areas versus the number of lumens observed in heX-embryoids with iGATA6 coverage when seeded at the optimized ratio indicated in J. Shaded area indicates the areas of the bilaminar disc between E9 and E16-19 as recorded by refs.  and ; 74% of discs that fall into this area range. 89.7% of discs have a single lumen. 70.9% of discs fall into both categories. n = 79 total. Scale bars = 100 μm. Source Data
Extended Data Fig. 3
Extended Data Fig. 3. Single Cell RNA-seq analysis and clustering per day (day 0 to 5).
(a) Individual UMAP projections and clustering for each time point recorded through day 5. (b) Violin plots showing a curated set of genes in heX-embryoid day 0, day 2, and day 4 clusters. Embryoid clusters are ordered by lowest to highest GATA6 expression level. “W” clusters are clusters with putative wild-type lineage; “G” clusters are clusters with putative iGATA6 lineage. (c) Volcano plots showing the differentially expressed genes between the DE(P) identities (left) and YS Endoderm (right) from ref. . Markers highlighted in red are genes expressed in the respective day 4 embryoid cluster. A subset of notable genes is labeled. P-values were computed by the Wilcoxon rank sum test and were adjusted for multiple comparisons via Bonferroni correction. These tests were performed as two-sided tests. (d) Similarity to YS Endoderm versus DE(P) within the embryoid clusters with endoderm identity. Black line indicates a significance threshold of p = 0.05. P-values were computed from the empirical distribution (please see Methods) and were adjusted for multiple corrections by the Benjamini Hochberg (BH) method. Tests were performed as one-sided tests. Source Data
Extended Data Fig. 4
Extended Data Fig. 4. Hypergeometric statistical comparison of heX-embryoid time points to human and NHP embryo data.
(a) Hypergeometric statistical comparison of each embryoid day to the annotated human embryo populations from ref. . Blue dots above each column indicates the relative GATA6 expression level of each population indicated per day. (b) Hypergeometric statistical comparison of each embryoid day to the annotated human embryo populations from refs. ,. Scale used is the same as shown in the panel A. (c) Hypergeometric statistical comparison of each embryoid day to the annotated cynomolgus embryo populations from ref. . Scale used is the same as shown in panel A. heX-embryoid clusters correspond to those in the individual day-by-day clustering in Extended Data Fig. 3 and are ordered from left to right on the x-axis by lowest to highest GATA6 expression level. “W” clusters are clusters with putative wild-type lineage; “G” clusters are clusters with putative iGATA6 lineage. Dotted outlines indicate fate comparisons of the most interest for each cluster. Abbreviations from other datasets: NNE = Non-neural ectoderm, DE (P) = Definitive endoderm (proliferative), DE (NP) = Definitive endoderm (not proliferative), YS = Yolk sac, PGC = Primordial germ cell, CTB = Cytotrophoblast, STB = Syncytiotrophoblast, EVT = Extravillous trophoblasts, PSA-EPI = Primitive streak anlage in the epiblast, EXMC = Extraembryonic mesoderm cells, E− = Early, L− = Late, Gast = Gastrulating cells, AM = Amnion, VE/YE = Visceral endoderm/Yolk sac endoderm. Elements of these graphs are also shown in Fig. [1f-g]. Source Data
Extended Data Fig. 5
Extended Data Fig. 5. Merged clustering of RNA-seq Day 0 – Day 5 of the embryoids.
(a) UMAP showing the merged clusters annotated by day. (b) UMAP showing the merged clusters with unsupervised clustering applied. (repeated figures: The WT clusters are shown in Fig. 2a Cluster 14 is the amnion-like cluster shown in Fig. 2b; Cluster 6 is the D2 anterior-like cluster shown in Fig. 3a; Cluster 2 is the D3-5 anterior-like cluster shown in Fig. 3a; and Cluster 15 is the posterior-like cluster shown in Fig. 3b.). (c) Heatmap showing the top 20 genes corresponding to each cluster of the merged day 0 through day 5 dataset. (d) Gene set enrichment analysis on the genes with greater than 2-fold upregulation in the D2 anterior-like cluster (5) as compared to the day 3–5 anterior-like cluster (2) using the indicated pathway reference datasets. All top pathways identified correspond to cell cycle, suggesting the separation observed in the UMAP is mainly attributable to differences in proliferative state. Combined score was obtained via Enrichr and was computed by taking the log of the p-value from the Fisher exact text (one-sided) and multiplying it by the z-score of the deviation from the expected rank. Source Data
Extended Data Fig. 6
Extended Data Fig. 6. Amnion and anteroposterior domains.
(a) Immunofluorescence staining for the amnion markers ISL1 and AP-2α at day 4. Top-down widefield image of a flattened coverslip. (b) Expression patterns of BMP4 effectors (phosphorylated SMAD1, SMAD5, and SMAD8/9) in heX-embryoid. Lower images show a lateral slice of the WT disc shown. (c) Dot plot of marker genes from the BMP pathway from day 4 heX-embryoid scRNA-seq. BMP4 expression and a number of associated genes (boxed in red) are highest in the amnion-like population. (d) Immunofluorescence staining for the BMP4 effectors (phosphorylated SMAD1, SMAD5, and SMAD8/9) in heX-embryoid at day 4 after application of the inhibitor Noggin at Day 2 of development. Lower images show a lateral slice of the WT disc shown. (e) Immunofluorescence staining for ISL1 and NANOG in heX-embryoid at day 4 after application of Noggin at Day 2 of development. Lower images show a lateral slice of the WT disc shown. (f) Bar graph showing ISL1 expression (D4) intensities within WT clusters; control (Ctrl) heX-embryoid versus BMP4 inhibition (Noggin) conditions. n[control] = 87, n[Noggin] = 134, **** p = 1.36 × 10−96 (C.I. = 95%), calculated via a two-tailed two-sample t-test assuming equal variances. n represents heX-embryoid structures harvested from one round of experiments. Note that a.u. intensities shown will differ from those shown in different experiments, such as those in Fig. 2i, due to differences in staining and imaging parameters at time of sampling. Error bars represent mean ± s.e.m. (g) Z-slice of a covered day 2 heX-embryoid structures showing a pole of cells expressing anterior hypoblast markers, matching the polarization of those markers shown in day 4 (see Fig. 3c). (h) Control heX-embryoids showing development of TBXT+ posterior-like domains and LHX1+ areas expressing CER1. (i) heX-embryoids with 100 ng/mL Noggin added at day 2 showing presence of LHX1+ areas expressing CER1, but no expression of TBXT+ domains. TBXT expression is seen in iGATA6-lineage cells at the periphery of the WT disc. (j) A representative WT cluster showing syn-polarity of TBXT and CER1 within the WT cluster and iGATA6 layers, respectively. Filled arrow indicates CER1-expressing cells within the iGATA6 layer; empty arrow indicates CER1 and TBXT co-expressing cells within the WT layer. Z-slices are representative slices from the center of two different WT discs. (k) A representative WT cluster showing anti-polarity of TBXT and CER1 within the WT cluster and iGATA6 layers, respectively. Filled arrow indicates CER1-expressing cells within the iGATA6 layer; empty arrow indicates CER1 and TBXT co-expressing cells within the WT layer. Z-slice is a representative slice from the center of a WT disc. (l) Merged UMAPs of all D0-D5 scRNA-seq data showing the posterior-like compartment expressing the inhibitor CER1. Dotted boxes show WT lineages. Scale Bars = 100 μm. Source Data
Extended Data Fig. 7
Extended Data Fig. 7. Identification of endothelial/hematopoietic populations in heX-embryoids.
(a) Violin plots showing the distribution of ECM genes as well as the yolk sac mesoderm marker gene BST2 in day 5 scRNA-seq. (b) Heatmap showing day 5 scRNA-seq populations compared to hematopoietic populations from the human E16-19 embryo via hypergeometric statistical comparison. This heatmap shows selected results from Extended Data Fig. 4c. We performed multiple test adjustments via Benjamini Hochberg (BH) correction in all comparisons. Tests were performed as one-sided tests. (c) Scatterplots showing the distribution of markers obtained via image analysis of 3 independent experiments at day 5. Percentages correspond to the fraction of cells recorded with corresponding marker expression levels above the thresholds represented by the dotted lines. (d) IF image showing cells expressing hematopoietic markers in heX-embryoid culture. Cells expressing the hematopoietic marker TAL1 (Scl) localize between the yolk sac endoderm-like compartment and the tissue culture dish and form arrangements of spindle-shaped cells. Orthogonal slice shows the position of spindle cells against the dish. Dashed line indicates the position from which the slice was taken. Arrow indicates the position of these cells in the EGFP channel, demonstrating that they were derived from the iGATA6 population. Scale bar = 100 µm. (e) IF image showing RUNX1 and TAL1 expressing cells positioned against the dish. Scale bar = 100 µm. (f) Image analysis of z-slices from 5 areas in 3 biological replicates. The peak of ERG expression is underneath the peak of EGFP expression, representing the iGATA6 endoderm-like layer. Dotted curves represent s.e.m. calculated at each point. (g) IF image showing cells expressing VE-cadherin and VEGFR2 positioned against the dish. Arrow indicates likely differentiating endothelial cell from the overlaying iGATA6 layer. Scale bar = 100 µm. (h) Results from image analysis demonstrating the change in area of CD34+ cells between day 5 and day 12 of the cultures, assessed via analysis of immunofluorescence Images. n = 3 biological replicates for D5 and D12 (mTeSR); n = 5 biological replicates for D12 (IMDM). **: P = 0.0055 (C.I. = 95%) P-value was calculated via a one-way ANOVA, using Dunnett’s multiple comparisons test. Error bars represent mean ± s.e.m. (i) Representative flow cytometry plot on day 5 and day 12 showing expansion of the CD34+ population by day 12, along with an unstained control (n = 3). Source Data
Extended Data Fig. 8
Extended Data Fig. 8. GATA6-hi supplementation and structure of hematopoietic foci.
(a) CD43+ and Hemoglobin+ cells in day 12 heX-embryoid without additional supplementation of GATA6-hi cells. Red color in high Hoechst areas is nonspecific staining. Scale bar = 500 μm. Insets show areas of CD43+ cells. Dotted outlines on right show zoomed-in areas shown within the image. Scale bar = 100 μm. (b) Expression of CD43+ and Hemoglobin+ cells in day 12 heX-embryoid with supplementation of 25% GATA6-hi cells at initial seeding. A notable expansion of CD43+ and Hemoglobin+ cells is observable. Scale bar = 500 μm. A representative image of 2–4 biological replicates. (c) Z-slices of a day 12 heX-embryoid at the indicated height above the bottom focal plane including the images shown in Fig. 4h. Expression of the mesodermal marker Desmin is regionalized close to the bottom of the tissue; endothelial marker CD34 is expressed near the bottom and middle of the tissue, with highest expression just above Desmin (z = 6–8); endoderm marker FOXA2 is exclusively expressed above the other tissues. Scale bar = 50 μm. (d) Z-slices around the hematopoietic focus shown in Fig. 4e. Desmin is observed regionalized below the endothelial-like (CD31+) and hematopoietic-like (CD43+) tissues. No stain for endoderm is shown. Scale bar = 100 μm.
Extended Data Fig. 9
Extended Data Fig. 9. Hematopoietic foci in heX-embryoids.
(a) Representative images of multilineage containing erythroid- (CD235ab+) and megakaryocyte-like (CD42b+) cells from day 17 heX-embryoid Scale bars = 100 μm. (b) A representative hematopoietic area containing myeloid- (CD33+) and megakaryocyte-like (CD42b+) cells from day 17 heX-embryoid. Scale bars = 100 μm. (c) Representative images of unilineage hematopoietic foci (left, CD42b; right, CD235ab) at day 17. Scale bars = 100 μm. (d) Quantification of the percentages ± SD of hematopoietic areas in two-week heX-embryoids. Left panel stained for CD43, CD33 and CD42b and right panel stained for CD43, CD235ab and CD42b. CD43mono+ indicates cells that were positive only for CD43 and negative for the other two markers stained in the sample. CD43mono− indicates that there are no cells positive for CD43 alone, but does not exclude cells copositive for CD43 and another of the markers investigated. Quantification of colonies was performed from at least two independent samples. (e) UMAP from Fig. 5d showing scRNA-seq performed on day 21 heX-embryoid with annotations based on hypergeometric statistical comparisons with identities from ref. . The full scatterplot has been cropped to show only populations of interest with similarity to in vivo hematopoietic lineages. (f) A dot plot showing the expression of a subset of HOX genes within the hematopoietic clusters. HOXA genes are broadly negative, indicating a transcriptional state similar to the yolk sac tissue. (g) Expression of LIN28A, FGF23, and GAD1 within the hematopoietic clusters. A subset of cells expresses these markers of early hemogenic identity within the yolk sac. Source Data
Extended Data Fig. 10
Extended Data Fig. 10. Hematopoietic cell composition in heX-embryoids.
(a) Expression of Hemoglobin ε+ and Hemoglobin γ+ cells in day 15 heX-embryoids. At day 15, areas of Hemoglobin ε-high, Hemoglobin γ-low cells are observed, suggesting more primitive-like hematopoiesis. Scale bar = 500 μm. Dotted box outlines inset shown to the right. A representative image of 3 biological replicates. (b) Expression of Hemoglobin ε+ and Hemoglobin γ+ cells in day 21 heX-embryoid. At day 21, areas of Hemoglobin ε-high, Hemoglobin γ-high cells are observed, suggesting more definitive-like hematopoiesis. Scale bar = 500 μm. Dotted box outlines inset shown to the right. A representative image of 3 biological replicates. (c) Violin plot showing the distribution of the ratios of Hemoglobin ε to Hemoglobin γ at each day. n[D15] = 3,188 cells, n[D21] = 4088. Counts are from three biological replicates. Central dotted line indicates median, smaller dotted lines above and below indicate quartiles. (d) Subclustering of cluster 11, the putative endothelial population, from the day 21 scRNA-seq data. Hierarchical subclustering identifies two major subpopulations within this cluster, corresponding to hemogenic (11.1) and non-hemogenic (11.2) endothelial subtypes. Marker genes for each population are shown in violin plots to the right. (e) Expression of hemogenic endothelial markers within the day 21 hematopoietic populations. Markers co-express mainly in the area annotated as “blood progenitors” in the hypergeometric statistical comparison. (f) Scatterplots showing the co-expression of hemogenic endothelial markers within the day 21 hematopoietic populations. (g) Immunofluorescence images of day 21 of culture shows co-expression of RUNX1 and VE-cad. Scale bar = 50 μm. (h) Scatterplots showing the co-expression of respective lineage markers within the day 21 hematopoietic population. Source Data
Extended Data Fig. 11
Extended Data Fig. 11. heX-embryoid formation from hiPSCs to model human early post-implantation development in vitro.
(a) From an initially mixed state, heX-embryoid cells segregate into WT clusters surrounded by iGATA6 cells. These iGATA6 cells migrate laterally to create a bilaminar boundary on top of the WT clusters. These clusters then undergo lumenogenesis, specification of amnion-like cells, and formation of anterior hypoblast-like and posterior-like pole. Within heX-embryoids, yolk sac mesoderm-like tissue specifies and hematopoietic cell specification is observed. (b) Schematic  comparing heX-embryoid morphology in relation to the human embryo. e The fluorescence image is taken from Extended Data Fig. 1i and is stained for OCT4, GFP, and F-actin. Human E16 embryo image is taken from ref. . Illustrations in a and b were created using BioRender (https://biorender.com).
Extended Data Fig. 12
Extended Data Fig. 12. heX-embryoid development, passaging, cryostorage as well as engineering in a separate iPSC line.
(a) Most structures corresponding to former WT clusters at day 12 in heX-embryoid have taken on expression of ISL1 and lost expression of the pluripotency markers SOX2 and NANOG. A limited number of cells express SOX2 at the core of former WT clusters, potentially indicating the specification of an ectoderm-like fate in a small number of WT-lineage cells. Scale bar = 500 μm. (b) A subset of former WT clusters have taken on markers of ectoderm differentiation. Scale bar = 500 μm. (c) heX-embryoid morphology and characteristics following cryostorage and defrosting. Scale Bar = 500 μm. (d) Characteristics and morphology of cultures induced immediately after mixing (passage 1) or maintained together and passaged for two months (passage 15). Scale Bar = 500 μm. (e) Schematic showing the creation of the heX-embryoid parental cell line. iGATA6 cells with heterogeneous copy numbers of the inducible GATA6 circuit are mixed with wild-type. This cell combination is then maintained together or frozen prior to induction. (f) A portion of day 4 PGP9 iGATA6 cells expressing high levels of GATA6 (EGFP) also express the anterior endoderm marker HHEX near the edge of a WT cluster. Scale Bar = 100 μm. (g) A ring of PODXL expression lines the inside of a cavities formed in day 4 PGP9 WT clusters. Scale Bar = 100 μm. (h) ISL1+ cells specify away from NANOG+ cells, along the base of a cavity formed in day 4 PGP9 WT. Scale Bar = 100 μm. (i) TBXT+ cells develop polar domains at the edge of day 4 PGP9 WT clusters. Representative islands show that both syn- and anti-polar arrangement of cells are observable. Scale Bar = 100 μm. n represents heX-embryoid structures from at least three biological replicates. Error shown is ± s.e.m. Illustration in e was created using BioRender (https://biorender.com).

Update of

References

    1. Palis J, Yoder MC. Yolk-sac hematopoiesis: the first blood cells of mouse and man. Exp. Hematol. 2001;29:927–936. doi: 10.1016/S0301-472X(01)00669-5. - DOI - PubMed
    1. Rossant J, Tam PPL. Early human embryonic development: blastocyst formation to gastrulation. Dev. Cell. 2022;57:152–165. doi: 10.1016/j.devcel.2021.12.022. - DOI - PubMed
    1. Lovell-Badge R, et al. ISSCR Guidelines for Stem Cell Research and Clinical Translation: the 2021 update. Stem Cell Rep. 2021;16:1398–1408. doi: 10.1016/j.stemcr.2021.05.012. - DOI - PMC - PubMed
    1. Rivron NC, Martinez Arias A, Pera MF, Moris N, M’Hamdi H I. An ethical framework for human embryology with embryo models. Cell. 2023;186:3548–3557. doi: 10.1016/j.cell.2023.07.028. - DOI - PubMed
    1. Clark AT, et al. Human embryo research, stem cell-derived embryo models and in vitro gametogenesis: considerations leading to the revised ISSCR guidelines. Stem Cell Rep. 2021;16:1416–1424. doi: 10.1016/j.stemcr.2021.05.008. - DOI - PMC - PubMed