. 2023 Dec 26;37(21-24):1017-1040.
doi: 10.1101/gad.351057.123.

Restrictor synergizes with Symplekin and PNUTS to terminate extragenic transcription

Affiliations

Restrictor synergizes with Symplekin and PNUTS to terminate extragenic transcription

Marta Russo et al. Genes Dev. .

Abstract

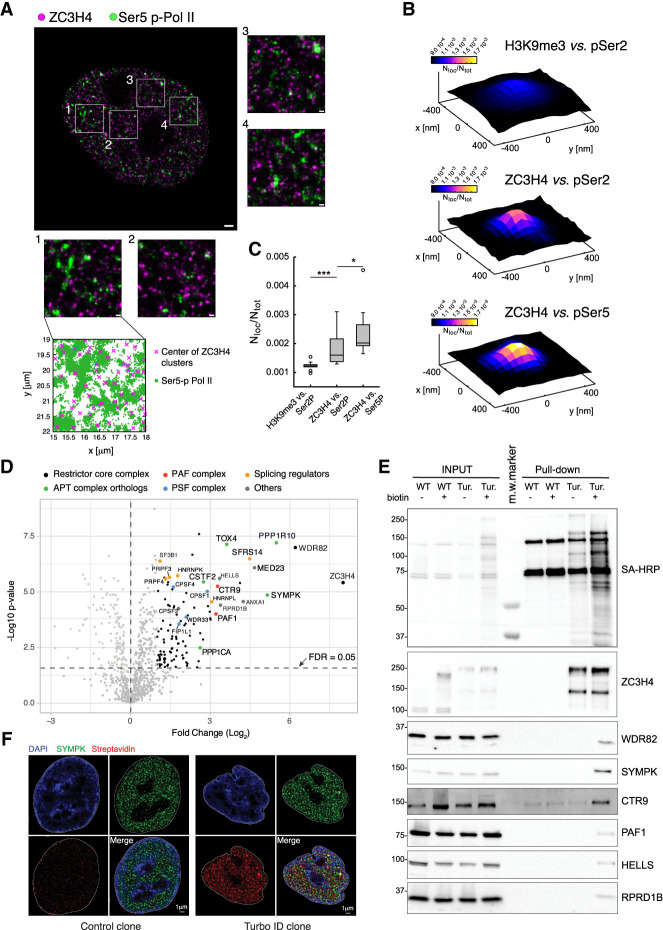
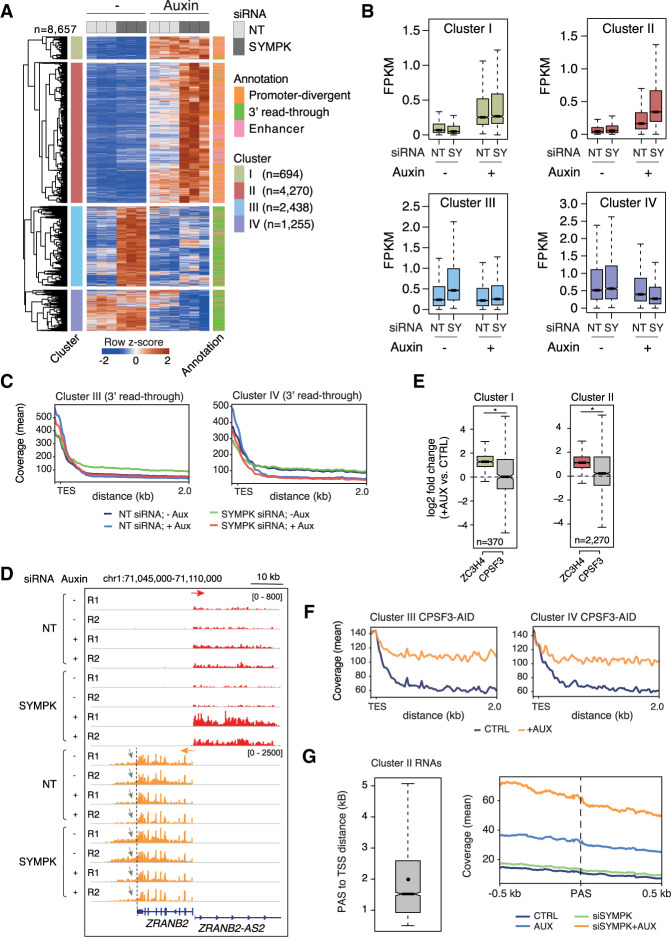
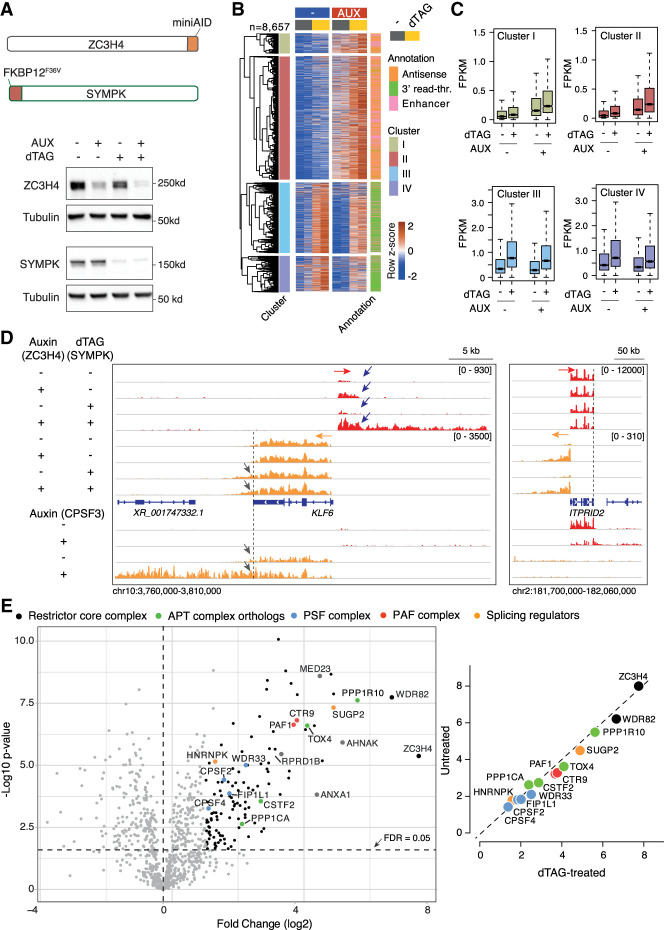
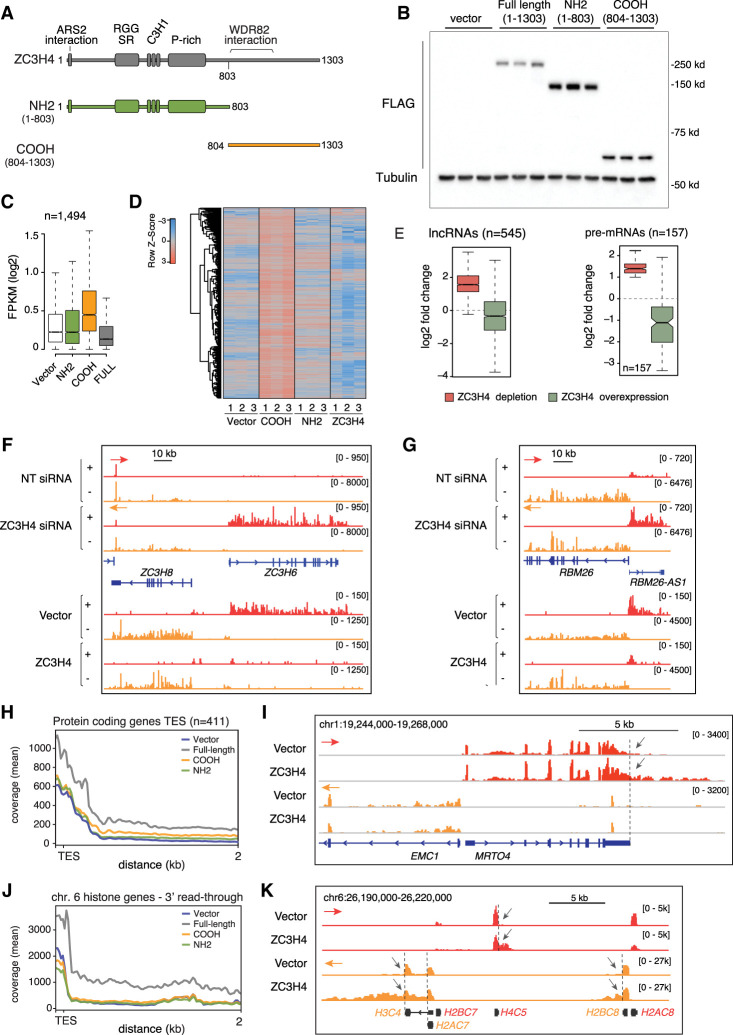
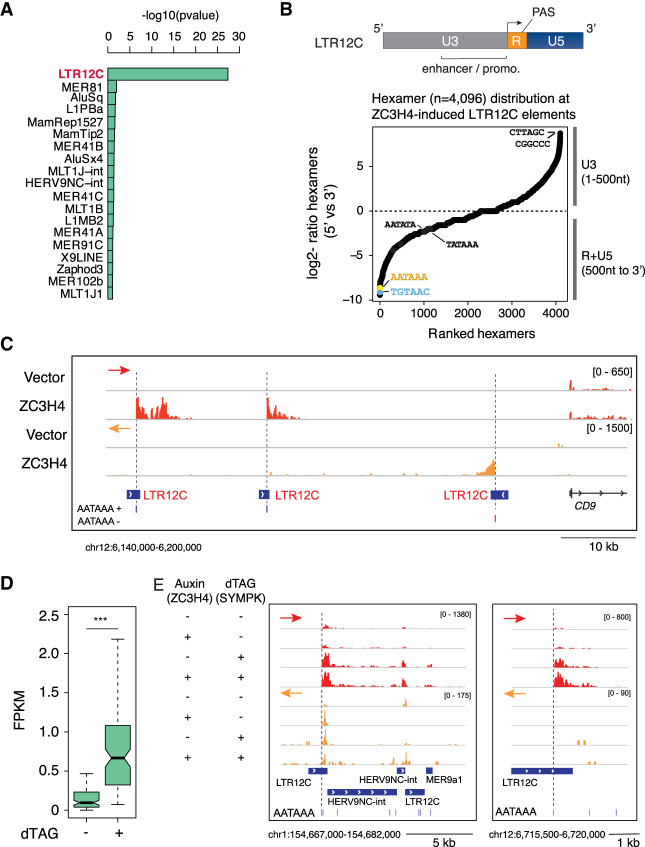
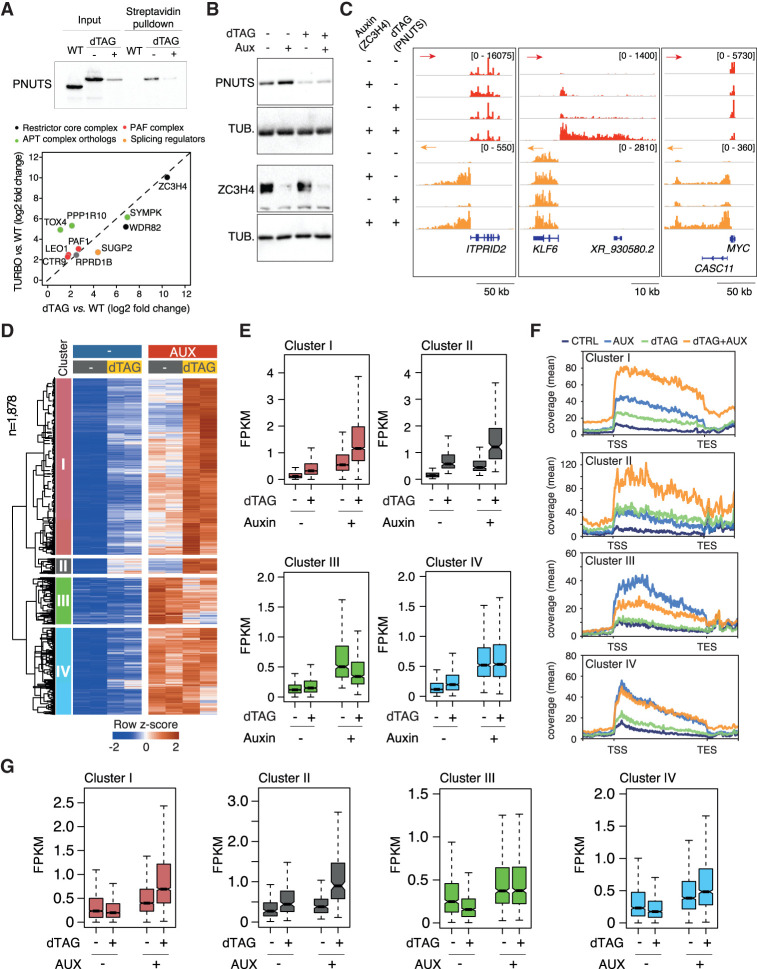
Transcription termination pathways mitigate the detrimental consequences of unscheduled promiscuous initiation occurring at hundreds of thousands of genomic cis-regulatory elements. The Restrictor complex, composed of the Pol II-interacting protein WDR82 and the RNA-binding protein ZC3H4, suppresses processive transcription at thousands of extragenic sites in mammalian genomes. Restrictor-driven termination does not involve nascent RNA cleavage, and its interplay with other termination machineries is unclear. Here we show that efficient termination at Restrictor-controlled extragenic transcription units involves the recruitment of the protein phosphatase 1 (PP1) regulatory subunit PNUTS, a negative regulator of the SPT5 elongation factor, and Symplekin, a protein associated with RNA cleavage complexes but also involved in cleavage-independent and phosphatase-dependent termination of noncoding RNAs in yeast. PNUTS and Symplekin act synergistically with, but independently from, Restrictor to dampen processive extragenic transcription. Moreover, the presence of limiting nuclear levels of Symplekin imposes a competition for its recruitment among multiple transcription termination machineries, resulting in mutual regulatory interactions. Hence, by synergizing with Restrictor, Symplekin and PNUTS enable efficient termination of processive, long-range extragenic transcription.

Keywords: RNA polymerase II; transcription; transcription termination.


Figures

Figure 1.
Figure 1.
A high-stringency ZC3H4 proximity interactome. (A) dSTORM image of a representative nucleus of HeLa cells stained with anti-ZC3H4 (magenta) and anti-pSer5 CTD Pol II (green) antibodies. Magnified images corresponding to the four boxed regions are also shown. At the bottom, the distribution of the pSer5 Pol II localizations relative to the centers of ZC3H4 clusters in one area is shown. Scale bars indicate 1 µm for the whole nuclei and 200 nm for the boxed regions. (B) Partial colocalization analysis of pSer2/pSer5 Pol II localizations around ZC3H4 clusters in STORM data. pSer2 and pSer5 Pol II localizations were mapped in a 30-nm grid, and the ZC3H4 clusters where the pSer2 or pSer5 Pol II density was higher than its own average density (i.e., ∼30% of clusters) were identified. The cumulative pSer2 and pSer5 Pol II nuclear map around ZC3H4 clusters was computed, the signal was normalized by the total map intensity, and the value of at least 15 nuclei was averaged. Position (0,0) in the plot represents the center of ZC3H4 clusters, and the intensity is the pSer2 or pSer5 Pol II normalized signal, which is proportional to the probability of finding the signal in that spatial position. (C) Box plots represent the colocalization strength; i.e., the average normalized signal of the pSer2 or pSer5 Pol II within 30 nm from the ZC3H4 cluster center. Every point represents the colocalization strength for a single nuclear map. As a control, we performed the same analysis for H3K9me3 localizations around pSer2 Pol II clusters. (D) Volcano plot showing the proteins identified by proximity labeling in HCT116 cells carrying a ZC3H4-Turbo-ID fusion gene. Biotin was added for 10 min to biotin-depleted cells, followed by the preparation of total lysates, streptavidin pull-down, and mass spectrometry. The identified proteins are shown according to their relative abundance (log2 fold change) and statistical significance in ZC3H4-TurboID cells versus biotin-treated wild-type cells. Proteins belonging to different complexes are indicated with different colors. n = 5 independent biological replicates. Significant hits are indicated as black dots. (E) Western blot analysis of selected proteins identified by proximity labeling in ZC3H4-TurboID cells. The top panel shows the detection of the pulled-down material by Western blot with streptavidin-HRP (SA-HRP). Input lysates and pulled-down proteins are shown. Molecular weight markers (in kilodaltons) are indicated at the left. Note the presence of a few biotinylated proteins in WT cells, which represent the three known endogenously biotinylated, long-half-life carboxylases (pyruvate carboxylase, 130 kDa; 3-methylcrotonyl CoA carboxylase, 75 kDa; and propionyl CoA carboxylase, 72 kDa) (Chandler and Ballard 1986; Ahmed et al. 2014). (F) DeepSIM superresolution images of representative nuclei from wild-type cells (control) and a ZC3H4-TurboID knock-in HCT116 clone (Turbo-ID) stained with an anti-Symplekin antibody (green) and streptavidin (red). Nuclear counterstaining with DAPI and a merged image are also shown.
Figure 2.
Figure 2.
Transcriptional effects of combined ZC3H4 depletion and partial siRNA-mediated Symplekin depletion. (A) Heat map showing extragenic transcripts differentially expressed in auxin-treated (ZC3H4-depleted) and/or SYMPK siRNA transduced HCT116 cells (FDR ≤ 0.05, |log2FC| ≥ 0.8, FPKM mean value ≥ 0.1). Row Z-scores are shown. Four clusters (I–IV from top to bottom) were identified that were characterized by different responses to ZC3H4 and/or Symplekin depletion. Each transcript was assigned to the nearest enhancer, promoter, or gene 3′ end (annotation flags at the right). Data are from n = 3 independent biological replicates. (B) Signal intensity of differentially expressed extragenic transcripts in clusters I–IV in the different experimental conditions used. The median value is indicated by a horizontal black line. Boxes show values between the first and third quartiles. The top and bottom whiskers show the smallest and the highest values, respectively. Outliers are not shown. The notches correspond to ∼95% confidence interval for the median. (C) Metaplots of transcripts in clusters III and IV, showing the effects of different perturbations on readthrough transcription at genes’ 3′ ends. (TES) Transcription end site. (D) A representative genomic region showing the effects of auxin-driven ZC3H4 depletion and partial siRNA-mediated Symplekin depletion on the ZRANB2 gene promoter-divergent transcription (ZRANB2-AS2) and on readthrough transcription (indicated by gray arrows) at the 3′ end of the ZRANB2 gene. The red and orange arrows indicate the plus and the minus strand signals, respectively. (E) Effects of auxin-induced CPSF3 depletion on promoter-divergent transcripts assigned to clusters I and II. Log2FC in auxin-treated versus untreated cells is shown. The effects of ZC3H4 depletion are shown for comparison. Statistical significance was assessed by a Wilcoxon paired test (cluster I, P = 2.732294 × 10⁻¹⁹; cluster II, P = 4.253707 × 10−65). (F) Metaplot showing the effects of auxin-induced CPSF3 depletion on readthrough transcripts assigned to clusters III and IV. Data from TES + 2 kb are shown; one bin = 20 bp. (G) Abundance of nascent extragenic transcripts synergistically regulated by ZC3H4 and Symplekin in a window of ±500 nt before and after the first PAS. We considered transcripts belonging to cluster II overlapping with a PRO-seq peak (n = 3090), which was used for the accurate identification of the main TSS. After removing transcripts with the first PAS at <500 nt from the TSS, we retained n = 2335 transcripts and measured the distance between their TSSs and the first PAS. (Left) The distance between the start of the PRO-seq peaks and the PAS is shown in a box plot. The mean (2002 nt) is shown as a dot. Median = 1522 nt. (Right) The coverage around the PAS (±500 nt) is shown in a metaplot.
Figure 3.
Figure 3.
Transcriptional effects of dTAG-induced depletion of Symplekin in combination with auxin-driven ZC3H4 depletion. (A, top) Schematic representation of the ZC3H4 and SYMPK degron knock-in alleles (not to scale). (Bottom) Depletion of ZC3H4 and Symplekin in double-knock-in HCT116 cells upon treatment with 100 µM auxin and/or 500 nM dTAG for 24 h. Molecular weight markers are shown at the right. (B) Heat map showing extragenic transcripts differentially expressed in auxin-treated (ZC3H4-depleted) and/or dTAG-treated (Symplekin-depleted) HCT116 cells. Row Z-scores are shown. The four clusters (I–IV) indicated in the heat map correspond to those in Figure 2A. Data are from n = 2 independent biological replicates. (C) Signal intensity of differentially expressed extragenic transcripts in clusters I–IV in the indicated experimental conditions. The median value is indicated by a horizontal black line. Boxes show values between the first and third quartiles. The top and bottom whiskers show the smallest and the highest values, respectively. Outliers are not shown. The notches correspond to ∼95% confidence interval for the median. (D) Two representative genomic regions showing the effects of individual or combined degron-driven degradation of Symplekin (dTAG) and ZC3H4 (auxin) on promoter-divergent (plus strand; red) and 3′ readthrough transcription (minus strand; orange). For comparison, the effects of auxin-mediated CPSF3 depletion in the same regions are shown at the bottom. (E, left) Volcano plot showing the proteins identified by proximity labeling upon dTAG-driven Symplekin depletion in HCT116 cells carrying a ZC3H4-Turbo ID fusion gene. The identified proteins are shown according to their relative abundance (log2 fold change) and statistical significance in ZC3H4-Turbo-ID cells versus biotin-treated control cells. n = 5 independent biological replicates. Significant hits are indicated as black dots. Selected statistically significant proteins are indicated in different colors depending on the functional group or complex to which they belong. (Right) Correlation between protein enrichment in mass spectrometry experiments in untreated versus dTAG-treated cells. Data are shown as fold enrichment (log2) in ZC3H4-Turbo-ID cells relative to wild-type cells.
Figure 4.
Figure 4.
Transcription termination defects caused by the overexpression of ZC3H4. (A) Schematic representation of ZC3H4 and its N-terminal and C-terminal fragments overexpressed in HeLa Flp-In-TREx cells. (B) Anti-FLAG Western blot showing the expression of ZC3H4 and its N-terminal and C-terminal fragments in three independent clones each. Cells were treated with 100 ng/mL doxycycline for 48 h before harvesting. (C) Effects of the overexpression of ZC3H4 and its N-terminal and C-terminal fragments on a set of transcripts previously reported to be up-regulated upon ZC3H4 depletion in HeLa cells (Austenaa et al. 2021). (D) The same data as in C are shown as a heat map. Row Z-scores are shown. (E) Box plot showing the effects of ZC3H4 depletion or overexpression on a set of n = 568 extragenic transcripts (left) and n = 157 pre-mRNAs (right) up-regulated upon ZC3H4 depletion, as well as detectable expression in control, nondepleted cells. The median value is indicated by a horizontal black line. Boxes show values between the first and third quartiles. The top and bottom whiskers show the smallest and the highest values, respectively. Outliers are not shown. The notches correspond to ∼95% confidence interval for the median. (F,G) Representative genomic regions showing the effects of ZC3H4 depletion or overexpression on the ZC3H6 gene transcript (F) and the RBM26-AS1 transcript (G). Note that in the bottom part of the two panels, the tracks were rescaled to show the basal expression of these transcripts. The red and orange arrows indicate the plus and minus strand signals, respectively. (H) Metaplot showing readthrough transcription at genes’ 3′ ends in HeLa cells overexpressing ZC3H4. Data are shown up to 2 kb after the TES; one bin = 20 bp. (I) Representative genomic region showing readthrough transcription (gray arrows) at the MRTO4 gene in cells overexpressing ZC3H4. (J) Metaplot showing readthrough transcription at replication-dependent histone genes in HeLa cells overexpressing ZC3H4. (K) Representative genomic snapshot showing readthrough transcription (gray arrows) at a group of histone genes in the chromosome 6 cluster.
Figure 5.
Figure 5.
Derepression of solo LTR-driven transcription caused by Symplekin titration or depletion. (A) Overrepresented subfamilies of transposable elements enriched in extragenic transcripts up-regulated in response to ZC3H4 overexpression relative to unaffected extragenic transcripts of similar length. The statistical significance was assessed by a Fisher test (“alternative = greater,” significance for P < 0.01). Subfamilies were ranked based on the most significant −log10 transformed P-value. (B, top) Schematic structure of solo LTR12C elements containing the U3 enhancer–promoter element, the R region with the TSS (arrow) and the PAS, and the U5 element. (Bottom) Relative distribution of all possible hexamers in the 5′ versus 3′ fragments of LTR12C elements. (C) A representative genomic region containing three LTR12C elements that, upon ZC3H4 overexpression in HeLa Flp-In TREx cells, generated transcripts extending into the adjacent genomic regions. The position of the canonical PAS in the R region of each LTR is shown. Arrowheads indicate transcription start sites. The red and orange arrows indicate the plus and minus strand signals, respectively. (D) RNA-seq read counts at LTR12C elements induced upon dTAG-driven Symplekin depletion in HCT116 cells. (***) P = 9.630827 × 10⁻²⁰ by Wilcoxon paired test. (E) Representative genomic regions showing LTR12C elements induced upon Symplekin depletion in HCT116 cells. The red and orange arrows indicate the plus and minus strand signals, respectively.
Figure 6.
Figure 6.
Effects of individual and combined depletions of ZC3H4 and PNUTS on extragenic transcription termination. (A) Effects of PNUTS depletion on the proximity interactome of ZC3H4. A dTAG-regulated degron was inserted into both PPP1R10 alleles in ZC3H4-Turbo-ID cells, and the proximity interactome of ZC3H4 was determined before and after PNUTS depletion. (Top) Western blot showing the depletion of degron-containing PNUTS upon dTAG treatment. (Bottom) Volcano plot showing selected proteins identified by proximity labeling upon dTAG-driven PNUTS depletion. The complete list of proteins is in Supplemental Table S8. (B) Levels of PNUTS and ZC3H4 after individual or combined degron-mediated depletion were analyzed by Western blot. Tubulin was used as a loading control. (C) Representative 4sU RNA-seq snapshots showing extragenic transcription changes induced by individual and combined depletion of ZC3H4 and PNUTS. The red and orange arrows indicate the plus and minus strand signals, respectively. (D) Clustered extragenic transcripts differentially expressed in the indicated depletions. The heat map includes promoter-divergent and enhancer-associated RNAs. Row Z-scores are shown. All transcripts in the heat map are significant in both clones in the ZC3H4-depleted condition versus control (FDR ≤ 0.01 and log2 transformed fold change of ≥2). The complete list of differentially expressed transcripts is in Supplemental Table S9. Cluster I: n = 1009, cluster II: n = 89, cluster III: n = 271, cluster IV: n = 509. Data are from n = 2 biological replicates of a single clone. (E) Levels (FPKM) of differentially expressed transcripts in the four clusters. The median value is indicated by a horizontal black line. Boxes show values between the first and third quartiles. The bottom and top whiskers show the smallest and highest values, respectively. Outliers are not shown. The notches correspond to ∼95% confidence interval for the median. (F) The metaplot shows the replicate average of the 4sU-seq signal in the four clusters of extragenic transcription units in C. (TSS) Transcription start site, (TES) transcription end site. (G) The levels of transcripts in clusters I–IV were measured in data sets obtained from cells depleted of Symplekin (by dTAG-mediated degradation) and/or ZC3H4 (by auxin-mediated degradation).

References

    1. Ahmed R, Spikings E, Zhou S, Thompsett A, Zhang T. 2014. Pre-hybridisation: an efficient way of suppressing endogenous biotin-binding activity inherent to biotin-streptavidin detection system. J Immunol Methods 406: 143–147. 10.1016/j.jim.2014.03.010 - DOI - PubMed
    1. Almada AE, Wu X, Kriz AJ, Burge CB, Sharp PA. 2013. Promoter directionality is controlled by U1 snRNP and polyadenylation signals. Nature 499: 360–363. 10.1038/nature12349 - DOI - PMC - PubMed
    1. Andersen PR, Domanski M, Kristiansen MS, Storvall H, Ntini E, Verheggen C, Schein A, Bunkenborg J, Poser I, Hallais M, et al. 2013. The human cap-binding complex is functionally connected to the nuclear RNA exosome. Nat Struct Mol Biol 20: 1367–1376. 10.1038/nsmb.2703 - DOI - PMC - PubMed
    1. Andersson R, Gebhard C, Miguel-Escalada I, Hoof I, Bornholdt J, Boyd M, Chen Y, Zhao X, Schmidl C, Suzuki T, et al. 2014. An atlas of active enhancers across human cell types and tissues. Nature 507: 455–461. 10.1038/nature12787 - DOI - PMC - PubMed
    1. Andersson R, Chen Y, Core L, Lis JT, Sandelin A, Jensen TH. 2015. Human gene promoters are intrinsically bidirectional. Mol Cell 60: 346–347. 10.1016/j.molcel.2015.10.015 - DOI - PMC - PubMed

Publication types

MeSH terms