. 2023 Dec 26;37(21-24):998-1016.
doi: 10.1101/gad.350745.123.

The steroid hormone ADIOL promotes learning by reducing neural kynurenic acid levels

Affiliations

The steroid hormone ADIOL promotes learning by reducing neural kynurenic acid levels

George A Lemieux et al. Genes Dev. .

Abstract

Reductions in brain kynurenic acid levels, a neuroinhibitory metabolite, improve cognitive function in diverse organisms. Thus, modulation of kynurenic acid levels is thought to have therapeutic potential in a range of brain disorders. Here we report that the steroid 5-androstene 3β, 17β-diol (ADIOL) reduces kynurenic acid levels and promotes associative learning in Caenorhabditis elegans We identify the molecular mechanisms through which ADIOL links peripheral metabolic pathways to neural mechanisms of learning capacity. Moreover, we show that in aged animals, which normally experience rapid cognitive decline, ADIOL improves learning capacity. The molecular mechanisms that underlie the biosynthesis of ADIOL as well as those through which it promotes kynurenic acid reduction are conserved in mammals. Thus, rather than a minor intermediate in the production of sex steroids, ADIOL is an endogenous hormone that potently regulates learning capacity by causing reductions in neural kynurenic acid levels.

Keywords: 5-androstenediol; estrogen receptor β; kynurenic acid; kynurenine pathway; nuclear hormone receptor.


Figures

Figure 1.
Figure 1.
F17 lowers KYNA levels and promotes short-term associative learning. (A) Relationship of kynurenine pathway metabolites to pathway enzymes. (B) Anatomic and genetic organization of mechanisms linking KYNA levels to learning capacity and pharyngeal pumping. While KYNA levels affect both pharyngeal pumping and learning capacity through modulation of NMDARs, these behavioral outcomes are mediated by distinct NMDAR-expressing neurons. RIM-, AVA-, ADF-, and hlh-34-expressing neurons indicate neurons previously identified as sites of actions of the indicated genes. nmr-1, flp-18, npr-5, tph-1, and ser-5 encode for an NMDAR subunit, a neuropeptide Y-like ligand, a neuropeptide Y-like receptor, tryptophan hydroxylase (the rate-limiting enzyme in serotonin biosynthesis), and a serotonergic G-protein-coupled receptor, respectively. (C) Effects of vehicle control (DMSO) or F17 on pharyngeal pumping rates in wild type, KYNA-deficient nkat-1 mutants, high-KYNA-containing kmo-1 mutants, and a set of mutants previously shown to block the elevated pharyngeal pumping rates of nkat-1 animals. N = 12–63 animals per condition. Statistical evaluation by ANOVA (Holm-corrected). (D) Associative learning in wild type (WT) and the indicated mutants treated with either DMSO as a vehicle control or F17. Statistical evaluation by ANOVA (Tukey's HSD). n = 7–12 assays per condition. (E) KYNA metabolite levels in wild-type animals and nkat-1 and kmo-1 mutants treated with either DMSO as vehicle control or F17. n = 5 independent biological samples per condition. Statistical evaluation by ANOVA (Holm's correction). In CE, P-values are as follows: (*) P < 0.05, (**) P < 0.01, (***) P < 0.001, (****) P < 0.0001, (ns) P > 0.05.
Figure 2.
Figure 2.
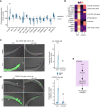
The nuclear hormone receptor NHR-131 is required for F17's biological effects. (A) Genomic location of the five identified EMS alleles (locations i–v) and a known deletion allele (tm1376) in nhr-131. The predicted functional consequence for each allele is missense Gly19Arg (location i), missense Val24Met (location ii), splice-accepting exon 3 (location iii), splice-accepting exon 4 (location iv), and premature stop Trp261STOP (location v). (B) Quantification of Nile Red staining in wild type, isolated EMS mutants (locations i–v), and the nhr-131(tm1376) deletion mutant. Error bars represent the 95% confidence interval of the mean. Statistical evaluation by ANOVA (Holm's correction). n = 12–47 animals per condition. (C, left panel) Composite fluorescence micrographs of transgenic animals expressing the transcriptional reporters for nhr-131p::nhr-131bcsGFP and a coinjection marker (nmr-1p::mCherry). Arrowheads indicate the intestine (i) and the somatic gonad (s). (Right panel) DIC micrograph of the same animal. Scale bars, 30 μm. (D) Pharyngeal pumping rates of L4 stage wild-type, nhr-131(tm1376) mutant, and transgenic strains bearing extrachromosomal arrays expressing the nhr-131 coding sequence using the 5′ upstream sequences from nhr-131 (used in C), cex-1, lim-7, and vha-6. Statistical evaluation by two-way ANOVA (Holm's correction). n = 16 animals per condition. (E) Associative learning in wild type, nhr-131 mutants, and nhr-131 mutants in which a wild-type nhr-131 transgene was driven by either the nhr-131 promoter used in C or the intestine-specific vha-6 promoter. Animals were treated with F17 or DMSO alone. N = 3–6 trials per condition. Statistical evaluation by ANOVA (Holm's correction). (F) Spontaneous Ca2+ transients recorded from RIM neurons expressing GCaMP in wild-type and nhr-131 mutant backgrounds treated with F17 or DMSO alone. Eighteen recordings of the change in fluorescence (ΔF/F) over 225 sec per recording are shown. The summed intensity of each recording is plotted. Statistical evaluation by Kruskal–Wallis (Dunn's test). (G) KYNA metabolite levels in nhr-131 mutants treated with F17 or DMSO alone. Statistical evaluation by Welch's t-test. n = 4 independent biological samples per condition. In B and DG, P-values are as follows: (*) P < 0.05, (**) P < 0.01, (***) P < 0.001, (****) P < 0.0001, (ns) P > 0.1. (H) Inferred pharmaco–genetic–metabolic relationship of F17, nhr-131, and KYNA levels and behavior.
Figure 3.
Figure 3.
Elucidation of a transcriptional program regulated by F17 and nhr-131. (A) Pharyngeal pumping rates after 1, 2, 3, and 4 h of exposure to F17 normalized to those of animals exposed to DMSO vehicle for the same time period. The mean (points) and standard error of the mean (error bars) for determinations from 19–20 animals per condition are plotted. Statistical evaluation by Welch's t-test comparing F17 treatment versus DMSO alone at each time point is denoted. (*) P < 0.05, (****) P < 0.0001. (B) Relationship of genes induced by F17 to nhr-131’s activity. The Venn diagram shows the number of genes regulated by F17 and the subset dependent on nhr-131. The histogram shows the distribution of the magnitude of gene expression changes at 5% FDR for each of the indicated contrasts. In F17-treated versus DMSO-treated animals, the fraction of genes in each bin whose change in expression is sensitive to nhr-131 is indicated. (C) Mean row-normalized gene expression data for all significant F17- and nhr-131-regulated genes. Wild type (WT) and nhr-131 mutants were treated with either F17 (F) or DMSO alone (D). Rows are ordered by k-means clustering into three broad classes. (DE) Differentially expressed, (FDR) false discovery rate. (D) The number of genes in each observed molecular function class. In B and D, F17-induced changes were considered nhr-131-dependent if the difference in F17-induced change in wild-type versus nhr-131 mutants resulted in a Wald test P-value of <0.05. All gene identities and expression changes used in BD are detailed in Supplemental Data Set S1.
Figure 4.
Figure 4.
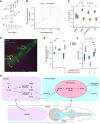
Identification of F17-regulated genes that are required for elevated ad libitum pharyngeal pumping rates. (A) RNA inhibitors that block the F17-induced increase in pharyngeal pumping rate without significantly altering the baseline levels of pumping (DMSO controls). While F17 treatment resulted in a significant increase ([****] P < 0.0001) in pumping rates of vector control animals, this increase was abrogated for the RNAi clones shown. Compared with F17-treated vector control, all gene inactivations shown resulted in a significant difference (P < 0.05) in the pumping rate of F17-treated animals. Statistical evaluation by ANOVA (Holm's correction). n = 10–130 per group. (B) Mean-normalized gene expression data by row for genes in A from wild type (WT) and nhr-131 mutants treated with DMSO (D) or F17 (F). (C,D) Superimposed epifluorescence and DIC micrographs of transgenic animals in both wild-type (WT) and nhr-131 mutant backgrounds, treated with DMSO alone or F17. odr-1p::rfp was used as the coinjection marker. Arrowheads indicate the intestine (i), epidermis (e), neuron (n), pharyngeal muscle (p), and somatic gonad (s). Scale bars, 30 μm. Quantifications for F17-induced transgene up-regulations are shown. C shows quantification of GFP fluorescence in the intestine for n = 7 animals per condition, and D shows quantification in the intestine and pharynx for n = 10–11 animals per condition. Statistical evaluation by ANOVA (Holm's correction) is indicated. (****) P < 0.0001, (ns) P > 0.1. (E) Inferred anatomic and pharmacogenetic organization of F17, nhr-131, cyp-13A4, F12E12.11, and pharyngeal pumping.
Figure 5.
Figure 5.
Identification of a steroid biosynthesis pathway that generates ADIOL, which promotes learning in both young and aged adults. (A) Dose–response relationship of varying concentrations of pregnenolone (PREG); dehydroepiandrosterone (DHEA); 5-androstene-3β, 17β-diol (ADIOL); progesterone (PROG); testosterone (T); 17β-estradiol (E2); and vehicle (DMSO) on pharyngeal pumping. Points represent the mean and whiskers represent the standard error of the mean of the pumping rates of 12–28 animals per dose. Statistical evaluation by ANOVA (Dunnett's correction). (**) P < 0.01 compared with DMSO. (B) Pharyngeal pumping rates of wild-type (WT) and mutant animals treated with different steroids or with DMSO alone as a vehicle control. n = 15–32 animals per condition. The data were statistically evaluated by ANOVA (Holm's correction). (C) Inferred metabolic organization of cyp-13A4 and F12E12.11. (D) KYNA levels from wild-type animals treated with ADIOL and DMSO as a control. The same data for DMSO were used in Figure 1C. n = 5 independent biological samples per condition. Statistical evaluation by ANOVA (Holm's correction). (E) Spontaneous Ca2+ transients recorded from RIM neurons expressing GCaMP in animals treated with DMSO or ADIOL and conditioned with butanone prior to imaging. Fifteen recordings of the change in fluorescence (ΔF/F) over 225 sec (s) per recording are shown. The summed intensity of each recording is plotted. Statistical evaluation by Wilcoxon rank-sum test. (F) Short-term learning performance for wild-type (WT) day 1 animals, kynurenine pathway mutants, and 5-d and 7-d aged animals treated with ADIOL or DMSO alone as a vehicle control. Statistical evaluation by ANOVA (Holm's correction). (G) Overview of ADIOL quantification by multiple reaction monitoring LC-MS/MS. Acidified homogenates were spiked with ADIOL-D3 as an internal standard and extracted into the nonpolar phase, and the residues from the nonpolar phase were subjected to solid-phase extraction using SiO2 cartridges. The residues from the eluates were esterified with nicotinic acid and subjected to UPLC-MS/MS. The mass transitions of doubly protonated ADIOL and ADIOL-D3 primary ions involving the loss of nicotinic acid after collision-induced dissociation (CID) were selected for analysis. (H) Representative chromatograms of the mass transitions monitored. (I) Quantification of endogenous ADIOL from wild-type animals treated with F17 or DMSO alone as a control. n = 3 independent biological replicates per condition. Statistical evaluation by two-tailed t-test. P-values in AI are as follows: (*) P < 0.05, (***) P < 0.001, (****) P < 0.0001. (J) Pharmacogenetic–metabolic relationship of F17, nhr-131, cyp-13A4, F12E12.11, ADIOL, and KYNA with learning and pharyngeal pumping behaviors.
Figure 6.
Figure 6.
ADIOL functions through nhr-91 in RIM neurons. (A) Chemical structures of ER-β ligands ADIOL, DPN, and WAY-200070. (B) Pharyngeal pumping rates of C. elegans treated with varying concentrations of WAY-200070 and DPN relative to DMSO-treated control. Points and error bars represent the mean and 95% confidence interval of 10–16 pharyngeal pumping determinations per condition. Points exhibiting means significantly different from DMSO are denoted. (**) P < 0.01 ANOVA (Dunnett's test). (C) Wild type and nhr-91 mutants treated with DMSO, ADIOL, WAY-200070, or F17 were assayed for learning ability. n = 4–5 trials per condition. (D) Maximum intensity Z-projection of confocal fluorescence micrographs of the head of a young adult expressing a transgenic array consisting of a bicistronic GFP fusion of the nhr-91 genomic sequence and transcriptional mCherry fusions under the control of the tdc-1 and nmr-1 promoters. Yellow structures represent colocalized mCherry and GFP signals. Arrowheads indicate RIM, RIC, and AVA neurons; nerve ring (nr); pharyngeal gland cell (pgc); and glial socket cells (AmSo and OLLSo). Scale bar, 30 μm. (E) Pharyngeal pumping rates of wild type, nhr-91 mutants, and nhr-91 mutants ectopically expressing the nhr-91a cDNA under the control of the RIM-specific cex-1 promoter. Animals were treated with ADIOL or DMSO alone as a control. n = 31 different animals per condition. (F) Associative learning in wild type, nontransgenic nhr-91 mutants, and nhr-91 mutants expressing nhr-91a cDNA under the control of the RIM-specific cex-1 promoter. Animals were treated with ADIOL or DMSO alone as a control. n = 5–6 independent cohorts per condition. (G) Model of the F17/nhr-131 transcriptional program that regulates ADIOL production to influence behavior in C. elegans. F17-induced gene expression up-regulations indicate that biosynthesis of ADIOL occurs in the intestine but do not rule out possible local conversion of DHEA into ADIOL in the nervous system. ADIOL promotes learning and feeding through engaging NHR-91, an ER-β-like nuclear hormone receptor in RIM neurons, to lower KYNA levels. Statistical evaluations are shown in C, E, and F. (***) P < 0.001, (****) P < 0.0001, (ns) P > 0.05 ANOVA (Holm's correction).

Similar articles

Cited by

References

    1. Adams JB. 1985. Control of secretion and the function of C19-Δ5-steroids of the human adrenal gland. Mol Cell Endocrinol 41: 1–17. 10.1016/0303-7207(85)90138-8 - DOI - PubMed
    1. Agudelo LZ, Femenía T, Orhan F, Porsmyr-Palmertz M, Goiny M, Martinez-Redondo V, Correia JC, Izadi M, Bhat M, Schuppe-Koistinen I, et al. 2014. Skeletal muscle PGC-1α1 modulates kynurenine metabolism and mediates resilience to stress-induced depression. Cell 159: 33–45. 10.1016/j.cell.2014.07.051 - DOI - PubMed
    1. Agudelo LZ, Ferreira DMS, Cervenka I, Bryzgalova G, Dadvar S, Jannig PR, Pettersson-Klein AT, Lakshmikanth T, Sustarsic EG, Porsmyr-Palmertz M, et al. 2018. Kynurenic acid and Gpr35 regulate adipose tissue energy homeostasis and inflammation. Cell Metab 27: 378–392.e5. 10.1016/j.cmet.2018.01.004 - DOI - PubMed
    1. Alexander KS, Wu H-Q, Schwarcz R, Bruno JP. 2012. Acute elevations of brain kynurenic acid impair cognitive flexibility: normalization by the α7 positive modulator galantamine. Psychopharmacology 220: 627–637. 10.1007/s00213-011-2539-2 - DOI - PMC - PubMed
    1. Anders S, Pyl PT, Huber W. 2015. HTSeq—a Python framework to work with high-throughput sequencing data. Bioinformatics 31: 166–169. 10.1093/bioinformatics/btu638 - DOI - PMC - PubMed

Publication types