. 2024 Mar;85(3):242-253.
doi: 10.1016/j.eururo.2023.11.008. Epub 2023 Dec 12.

Spatial Relationships in the Tumor Microenvironment Demonstrate Association with Pathologic Response to Neoadjuvant Chemoimmunotherapy in Muscle-invasive Bladder Cancer

Affiliations

Spatial Relationships in the Tumor Microenvironment Demonstrate Association with Pathologic Response to Neoadjuvant Chemoimmunotherapy in Muscle-invasive Bladder Cancer

Wolfgang Beckabir et al. Eur Urol. 2024 Mar.

Abstract

Background: Platinum-based neoadjuvant chemotherapy (NAC) is standard for patients with muscle-invasive bladder cancer (MIBC). Pathologic response (complete: ypT0N0 and partial: <ypT2N0) to NAC is associated with improved survival with ypT0N0 achieved in 30-40% of cases. Strategies to increase response to NAC are needed. Incorporation of immune checkpoint inhibitors (ICIs) has demonstrated promise, and better spatial understanding of the tumor microenvironment may help predict NAC/ICI response.

Objective: Using the NanoString GeoMx platform, we performed proteomic digital spatial profiling (DSP) on transurethral resections of bladder tumors from 18 responders (<ypT2) and 18 nonresponders (≥ypT2) from two studies of NAC (gemcitabine and cisplatin) plus ICI (LCCC1520 [pembrolizumab] and BLASST-1 [nivolumab]).

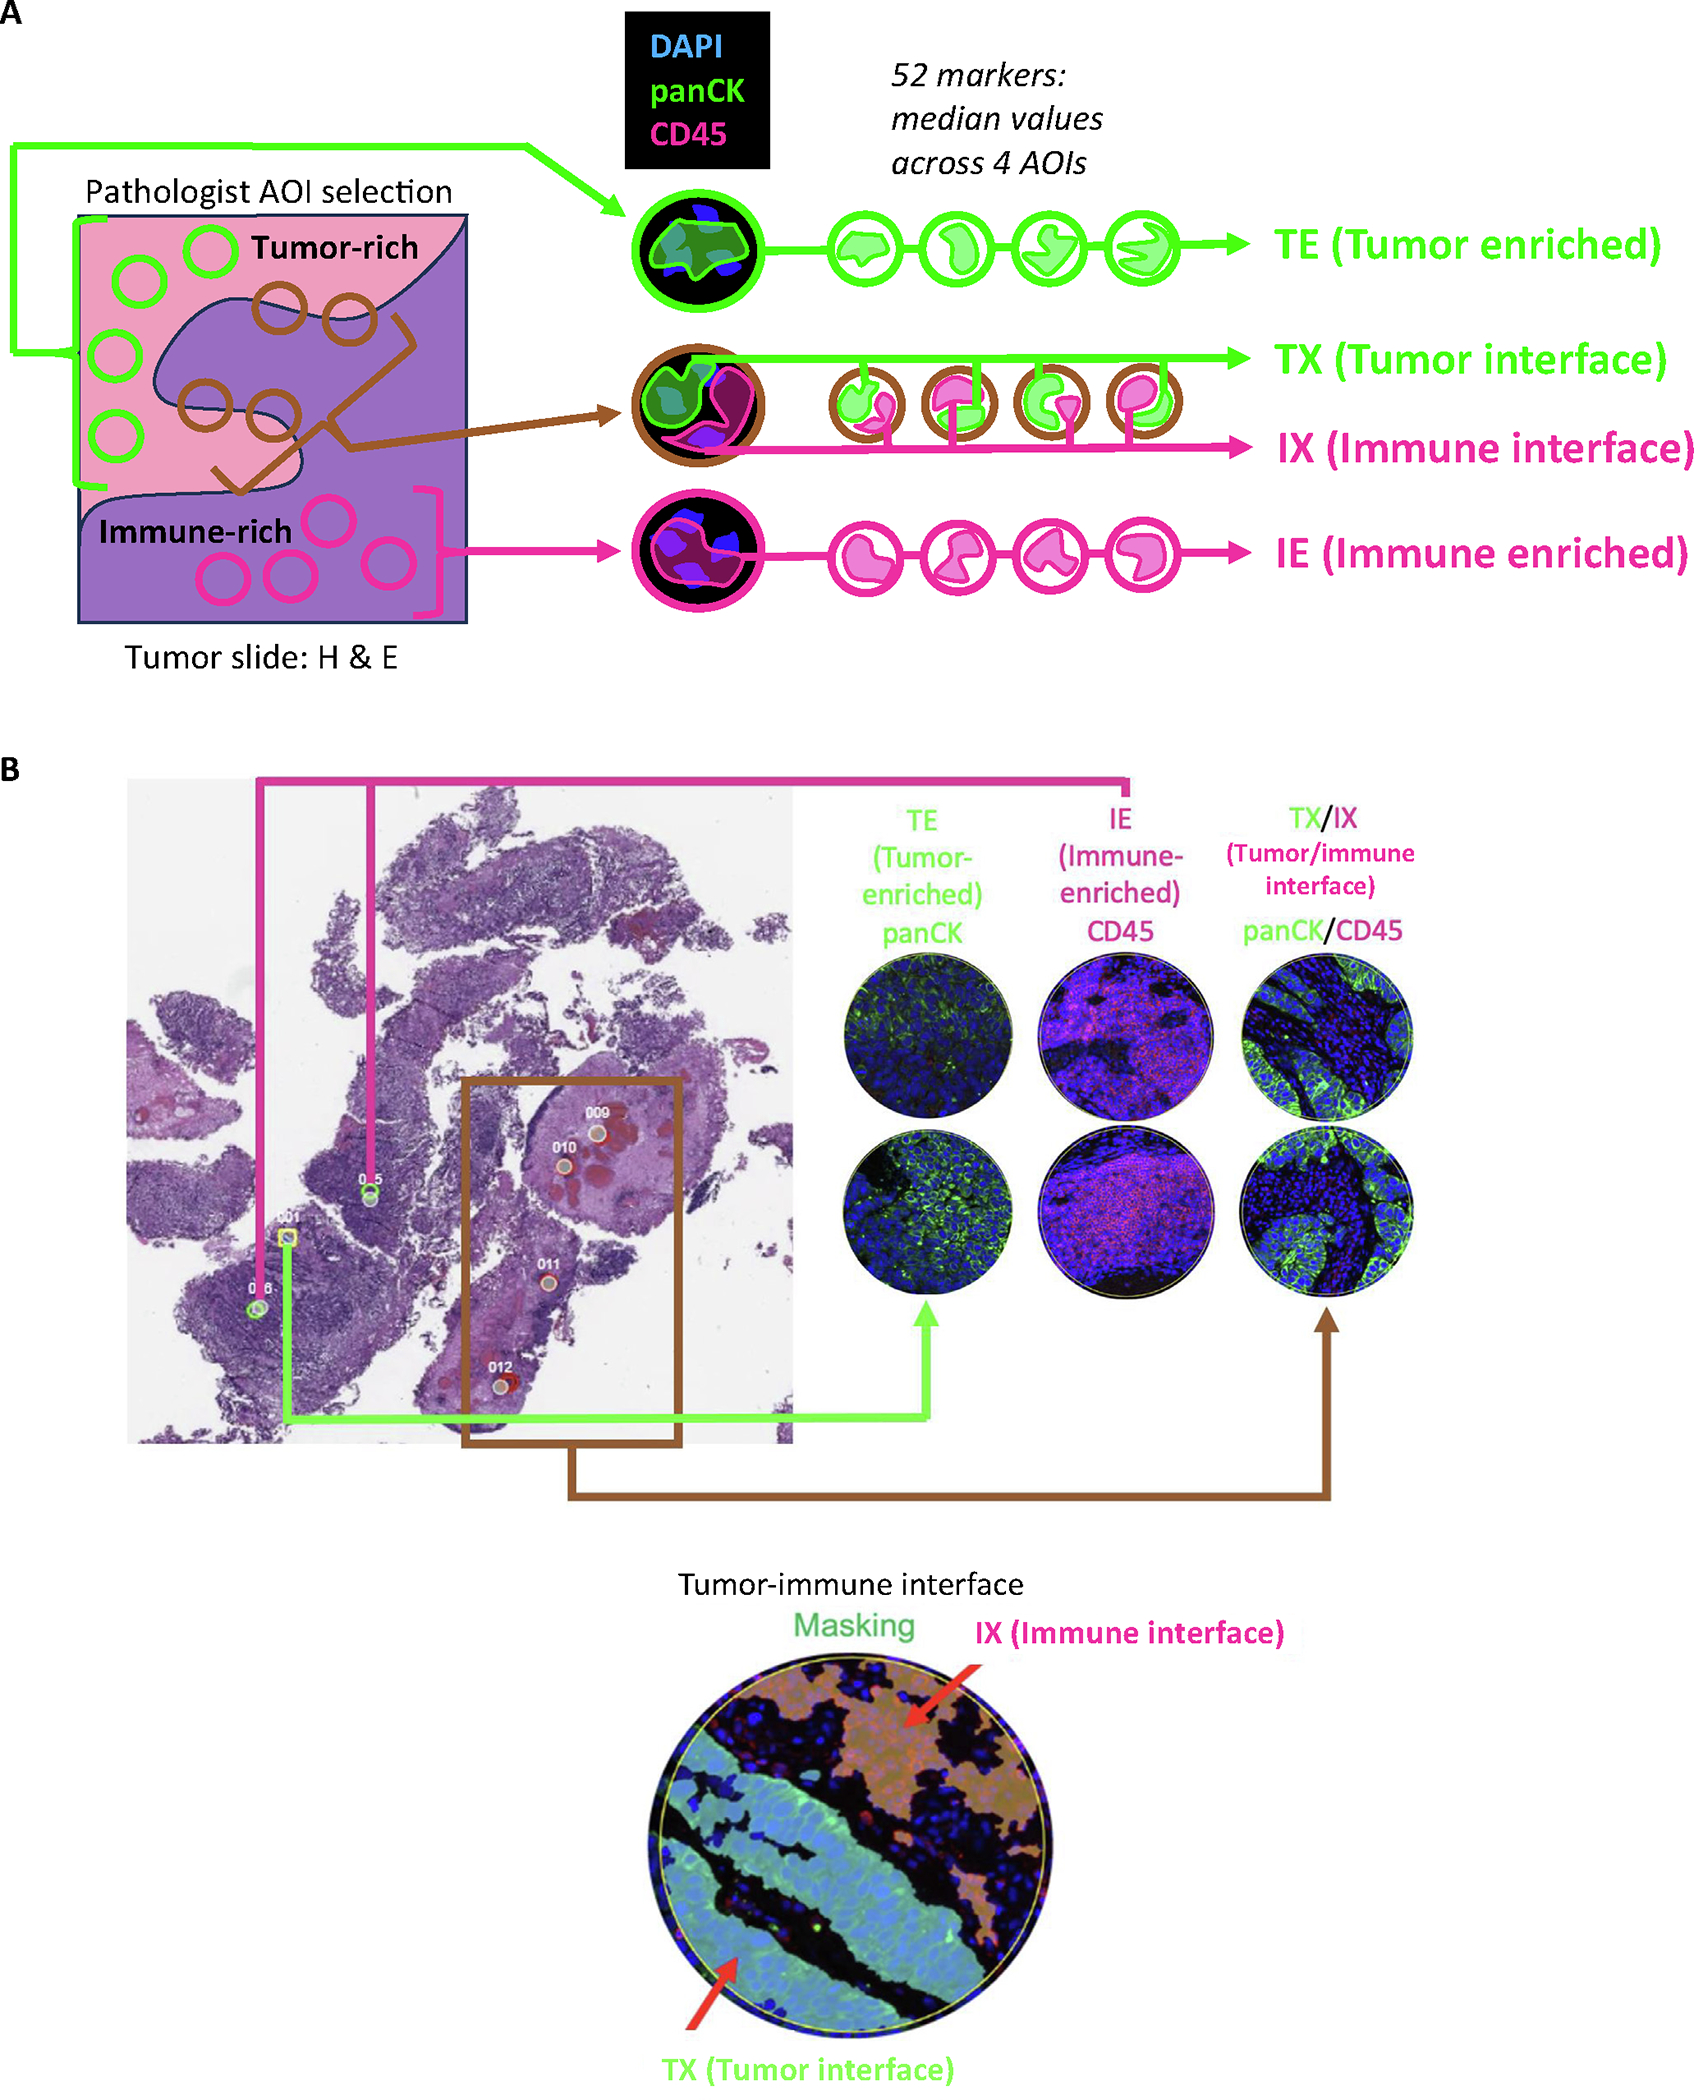
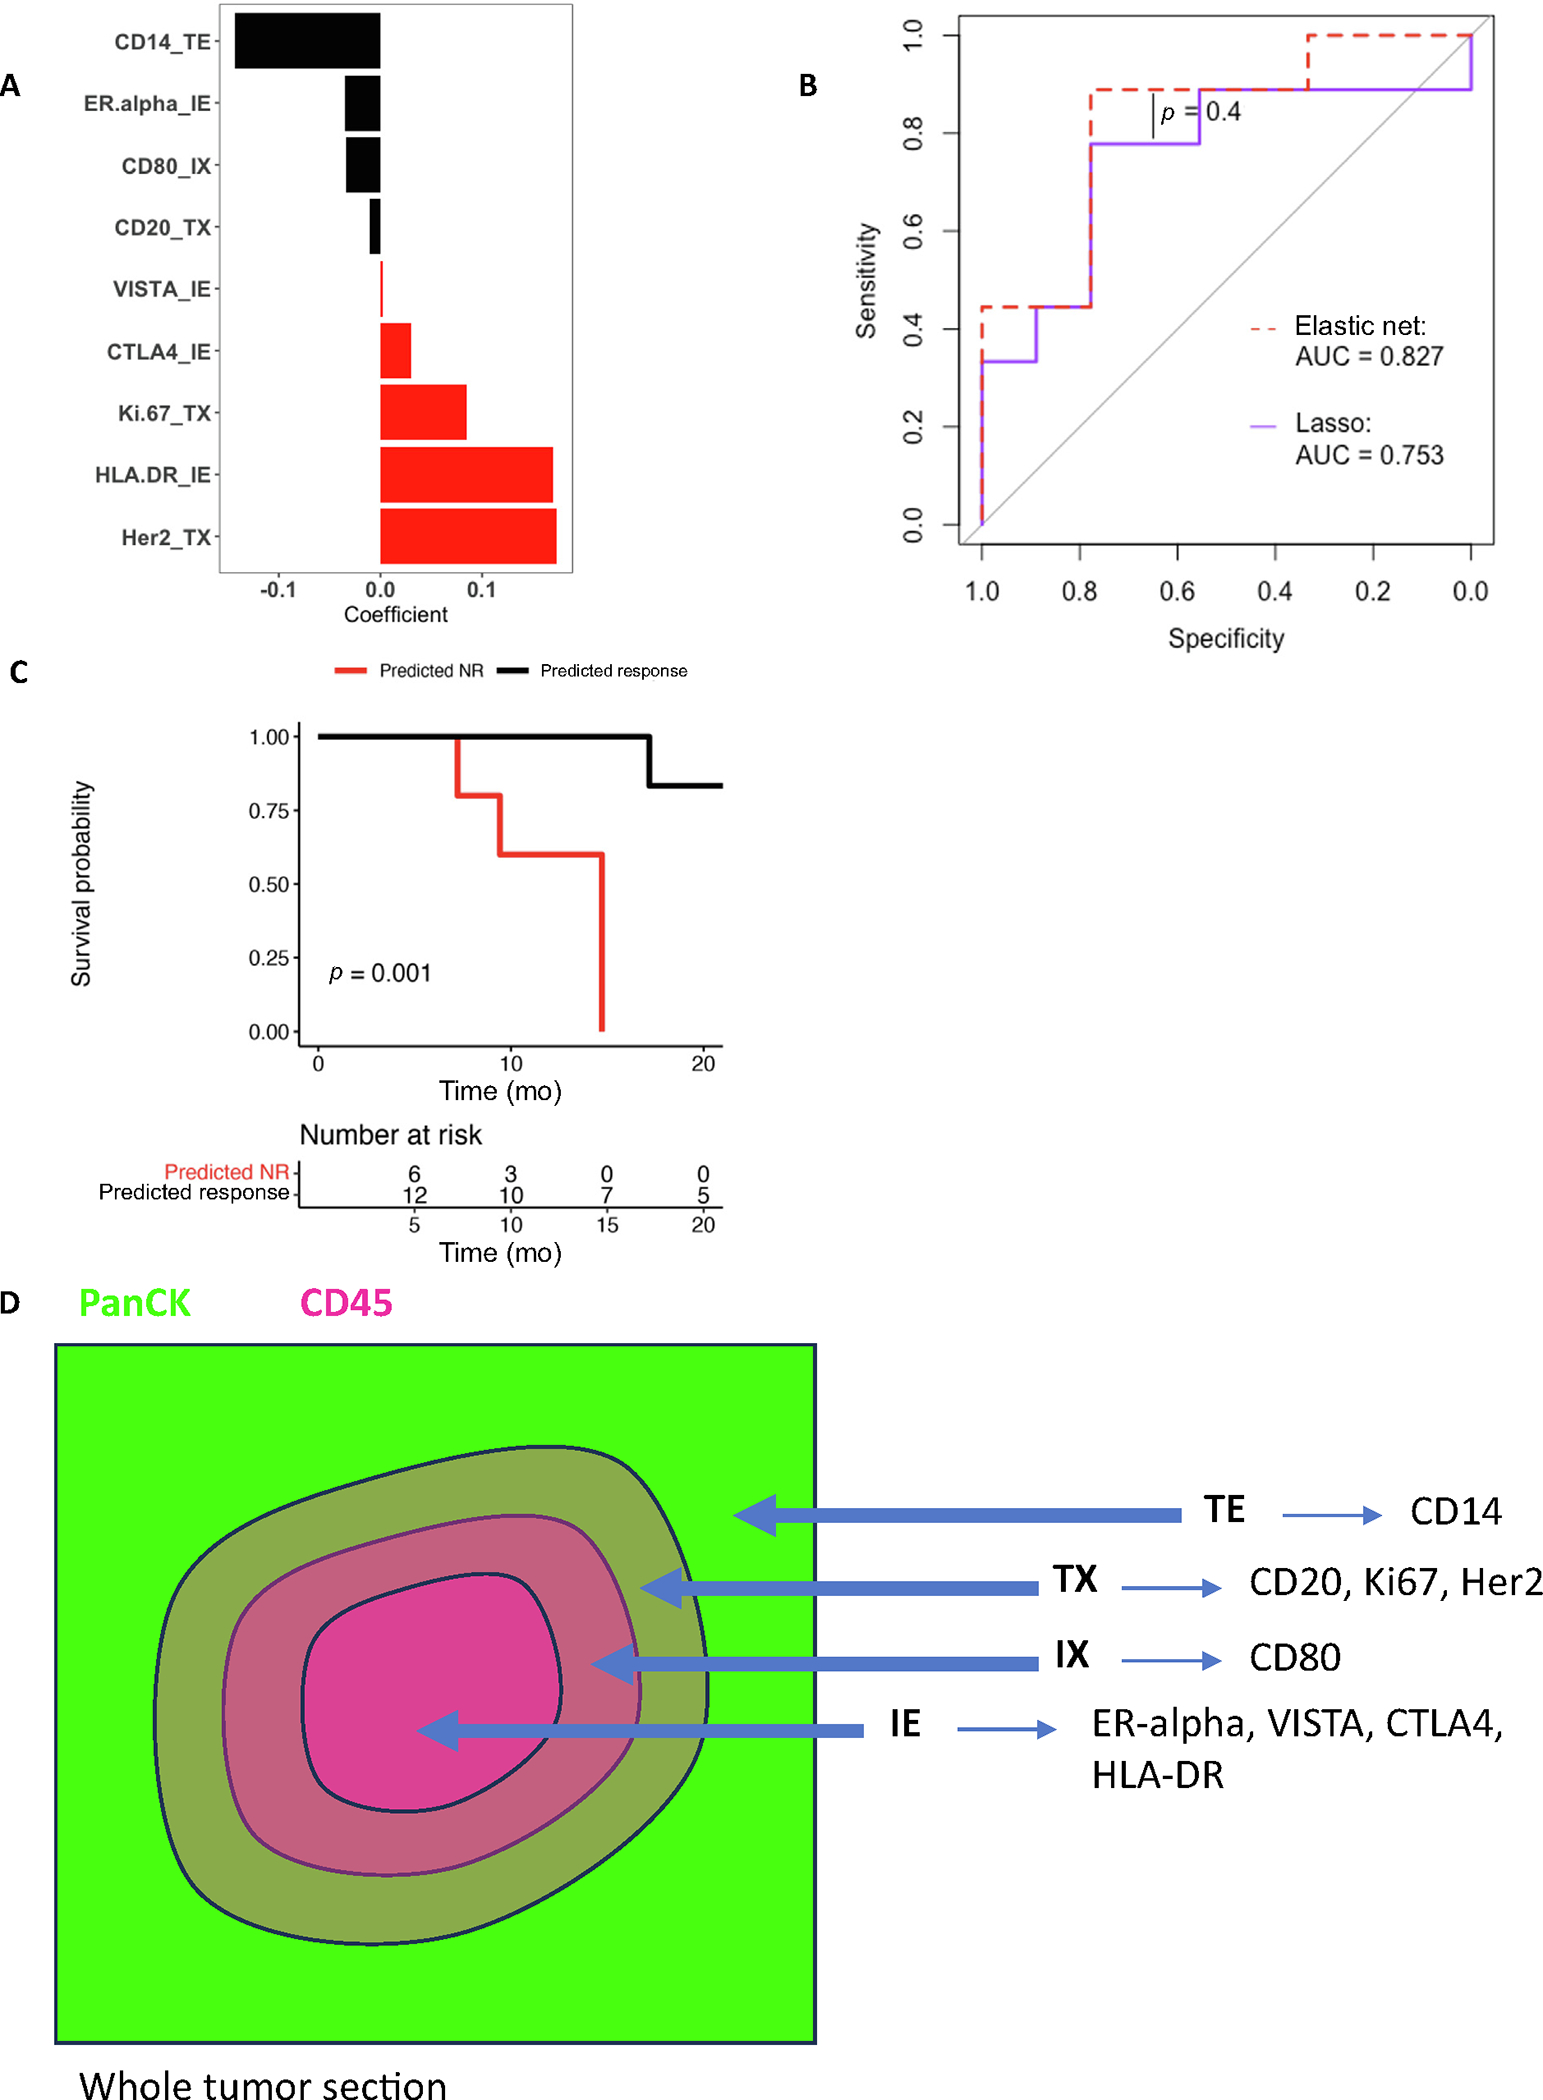
Design, setting, and participants: Pretreatment tumor samples were stained by hematoxylin and eosin and immunofluorescence (panCK and CD45) to select four regions of interest (ROIs): tumor enriched (TE), immune enriched (IE), tumor/immune interface (tumor interface = TX and immune interface = IX).

Outcome measurements and statistical analysis: DSP was performed with 52 protein markers from immune cell profiling, immunotherapy drug target, immune activation status, immune cell typing, and pan-tumor panels.

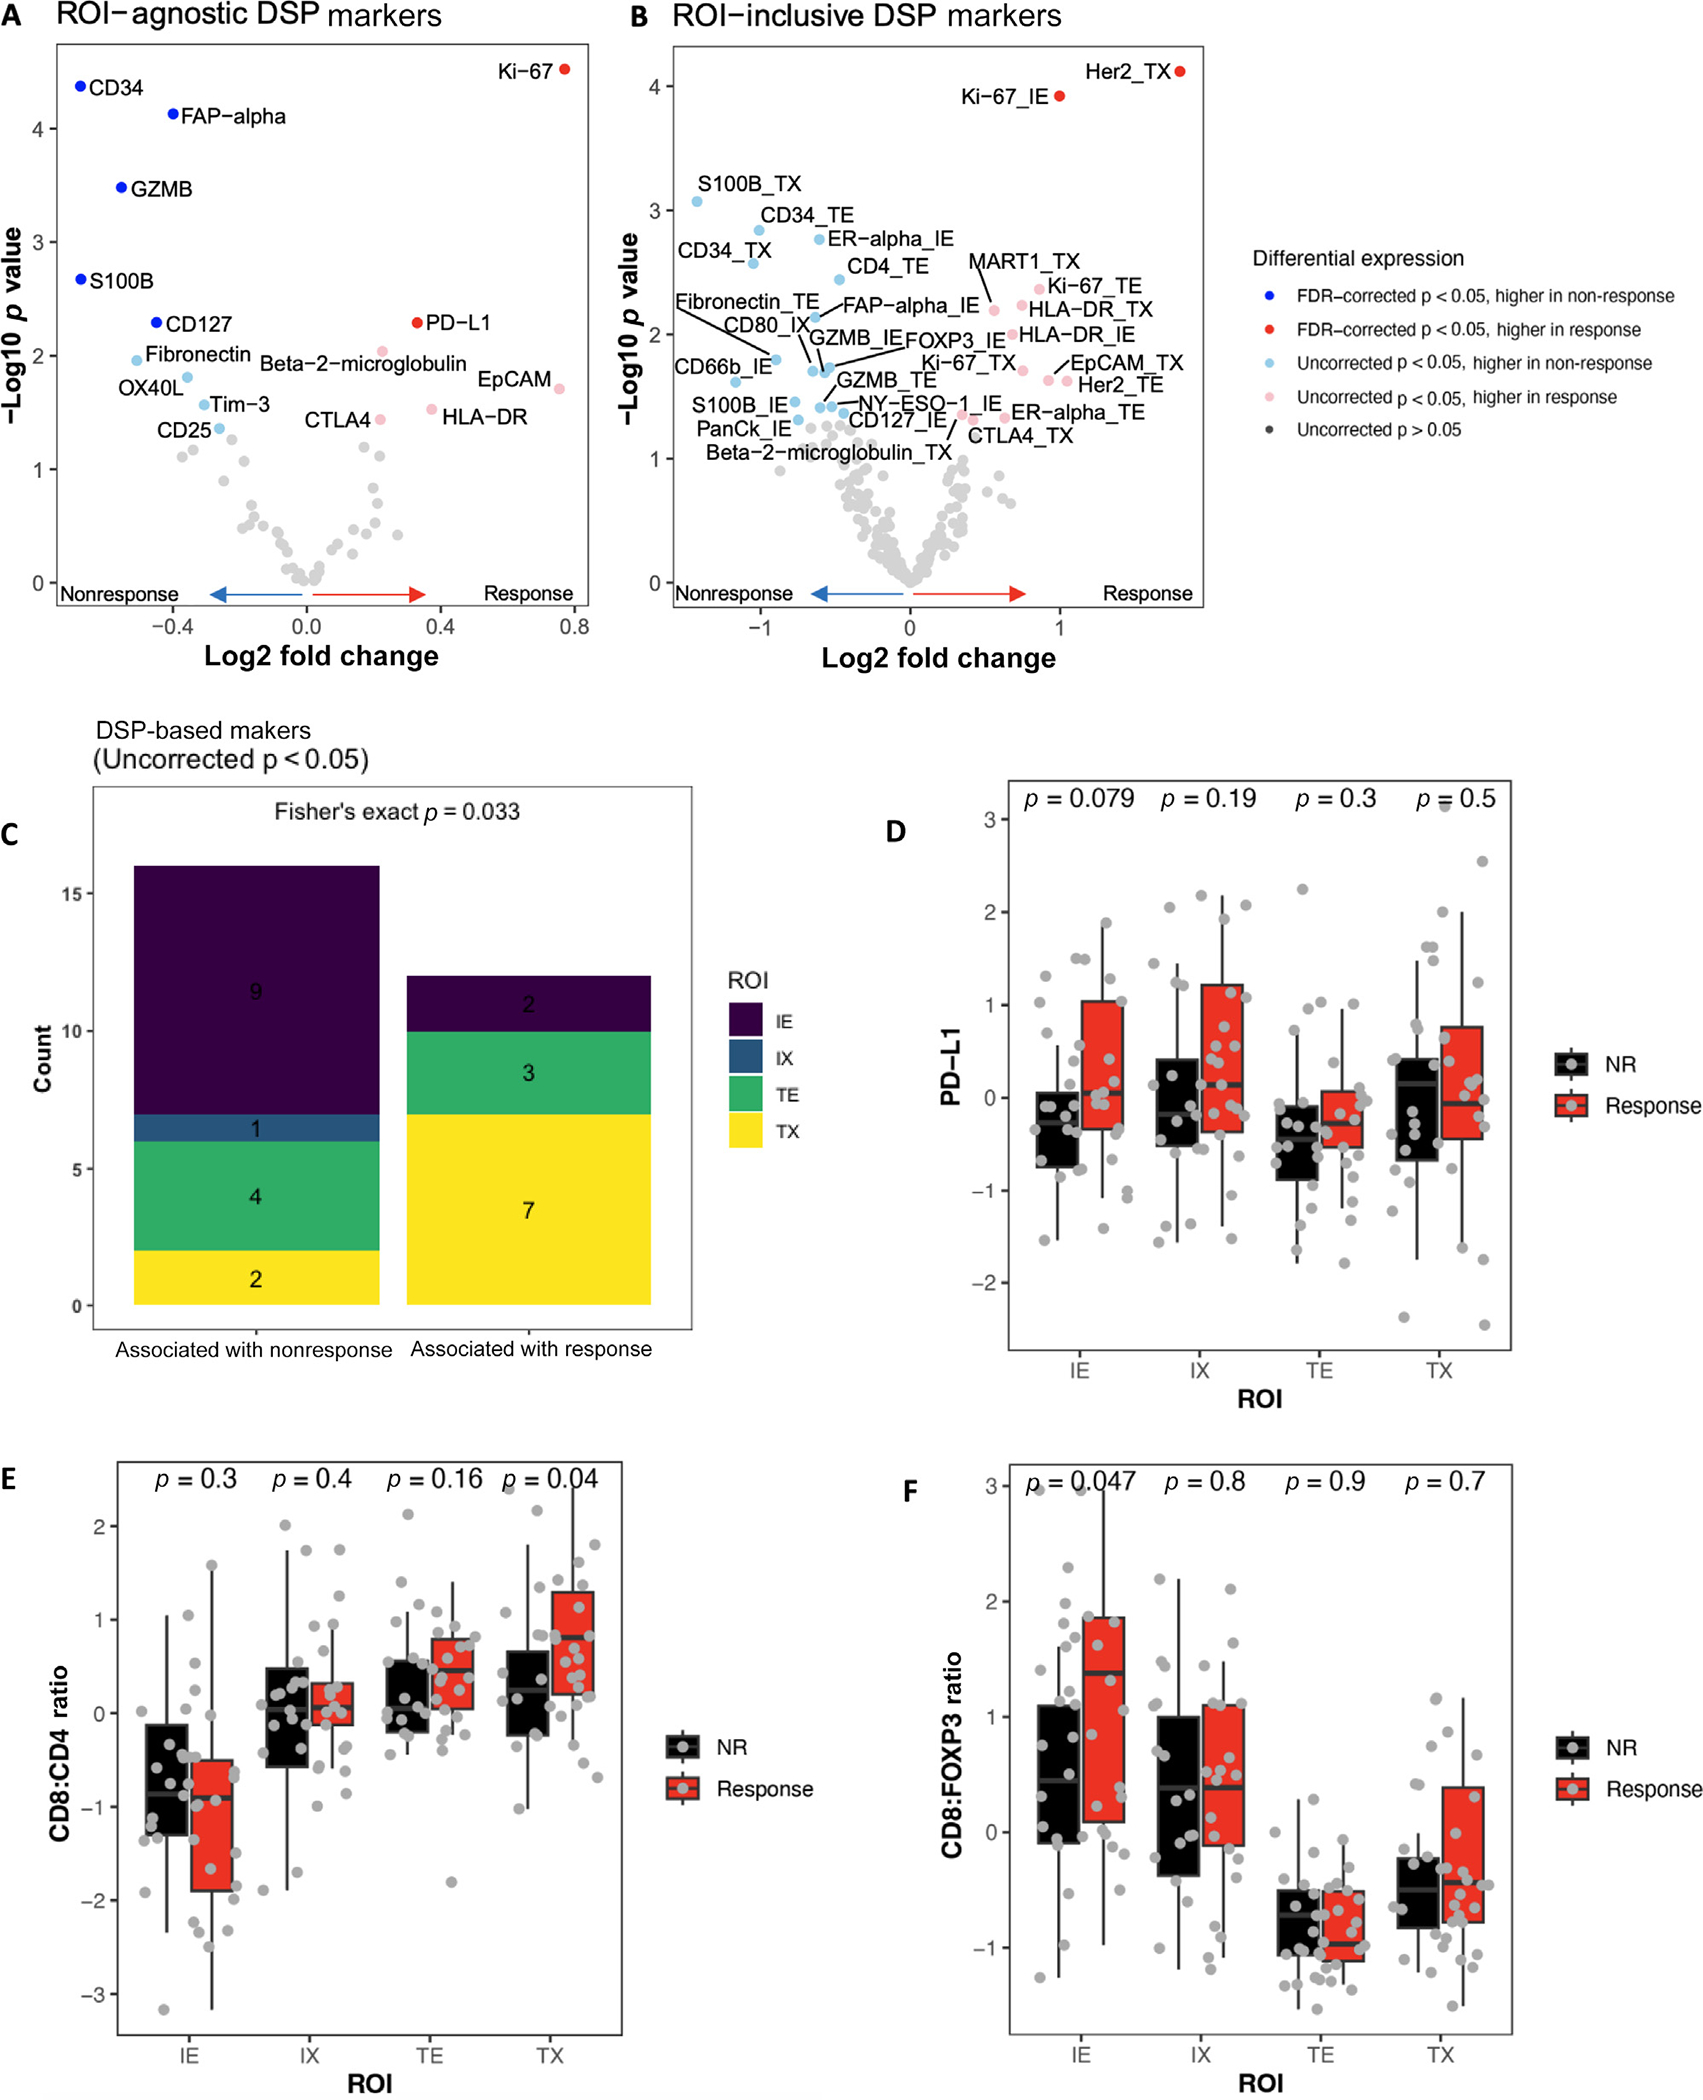
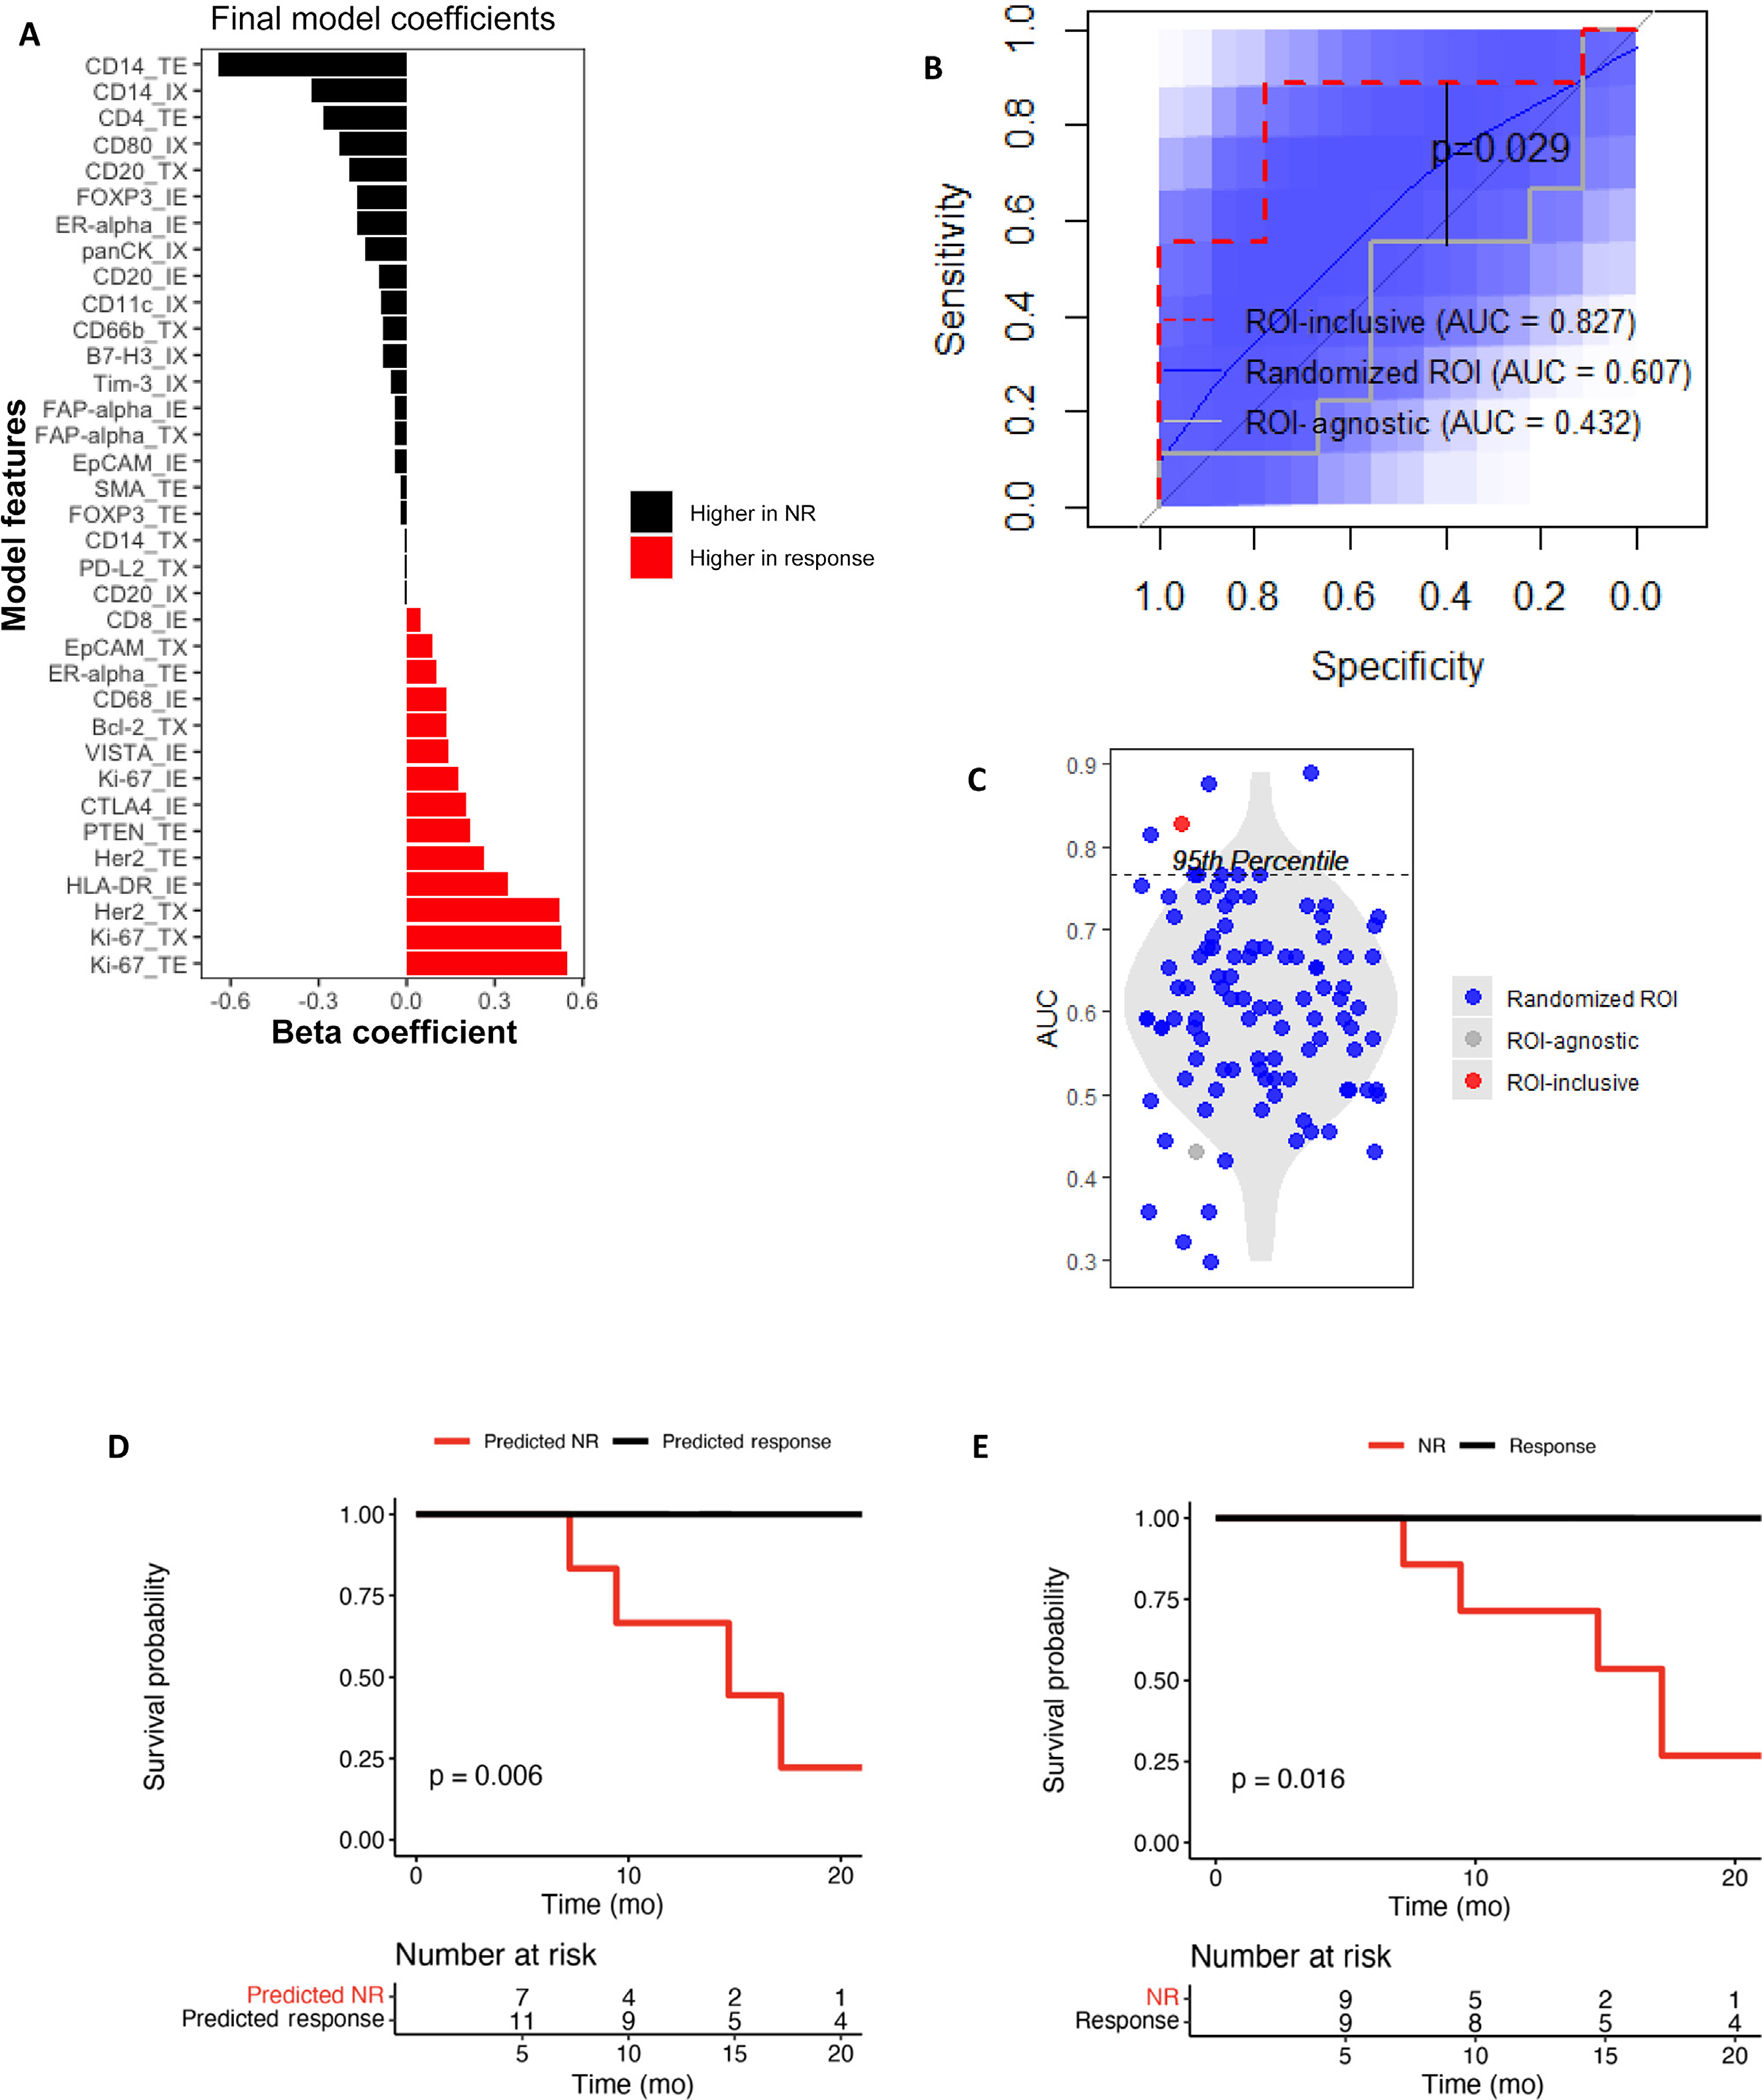
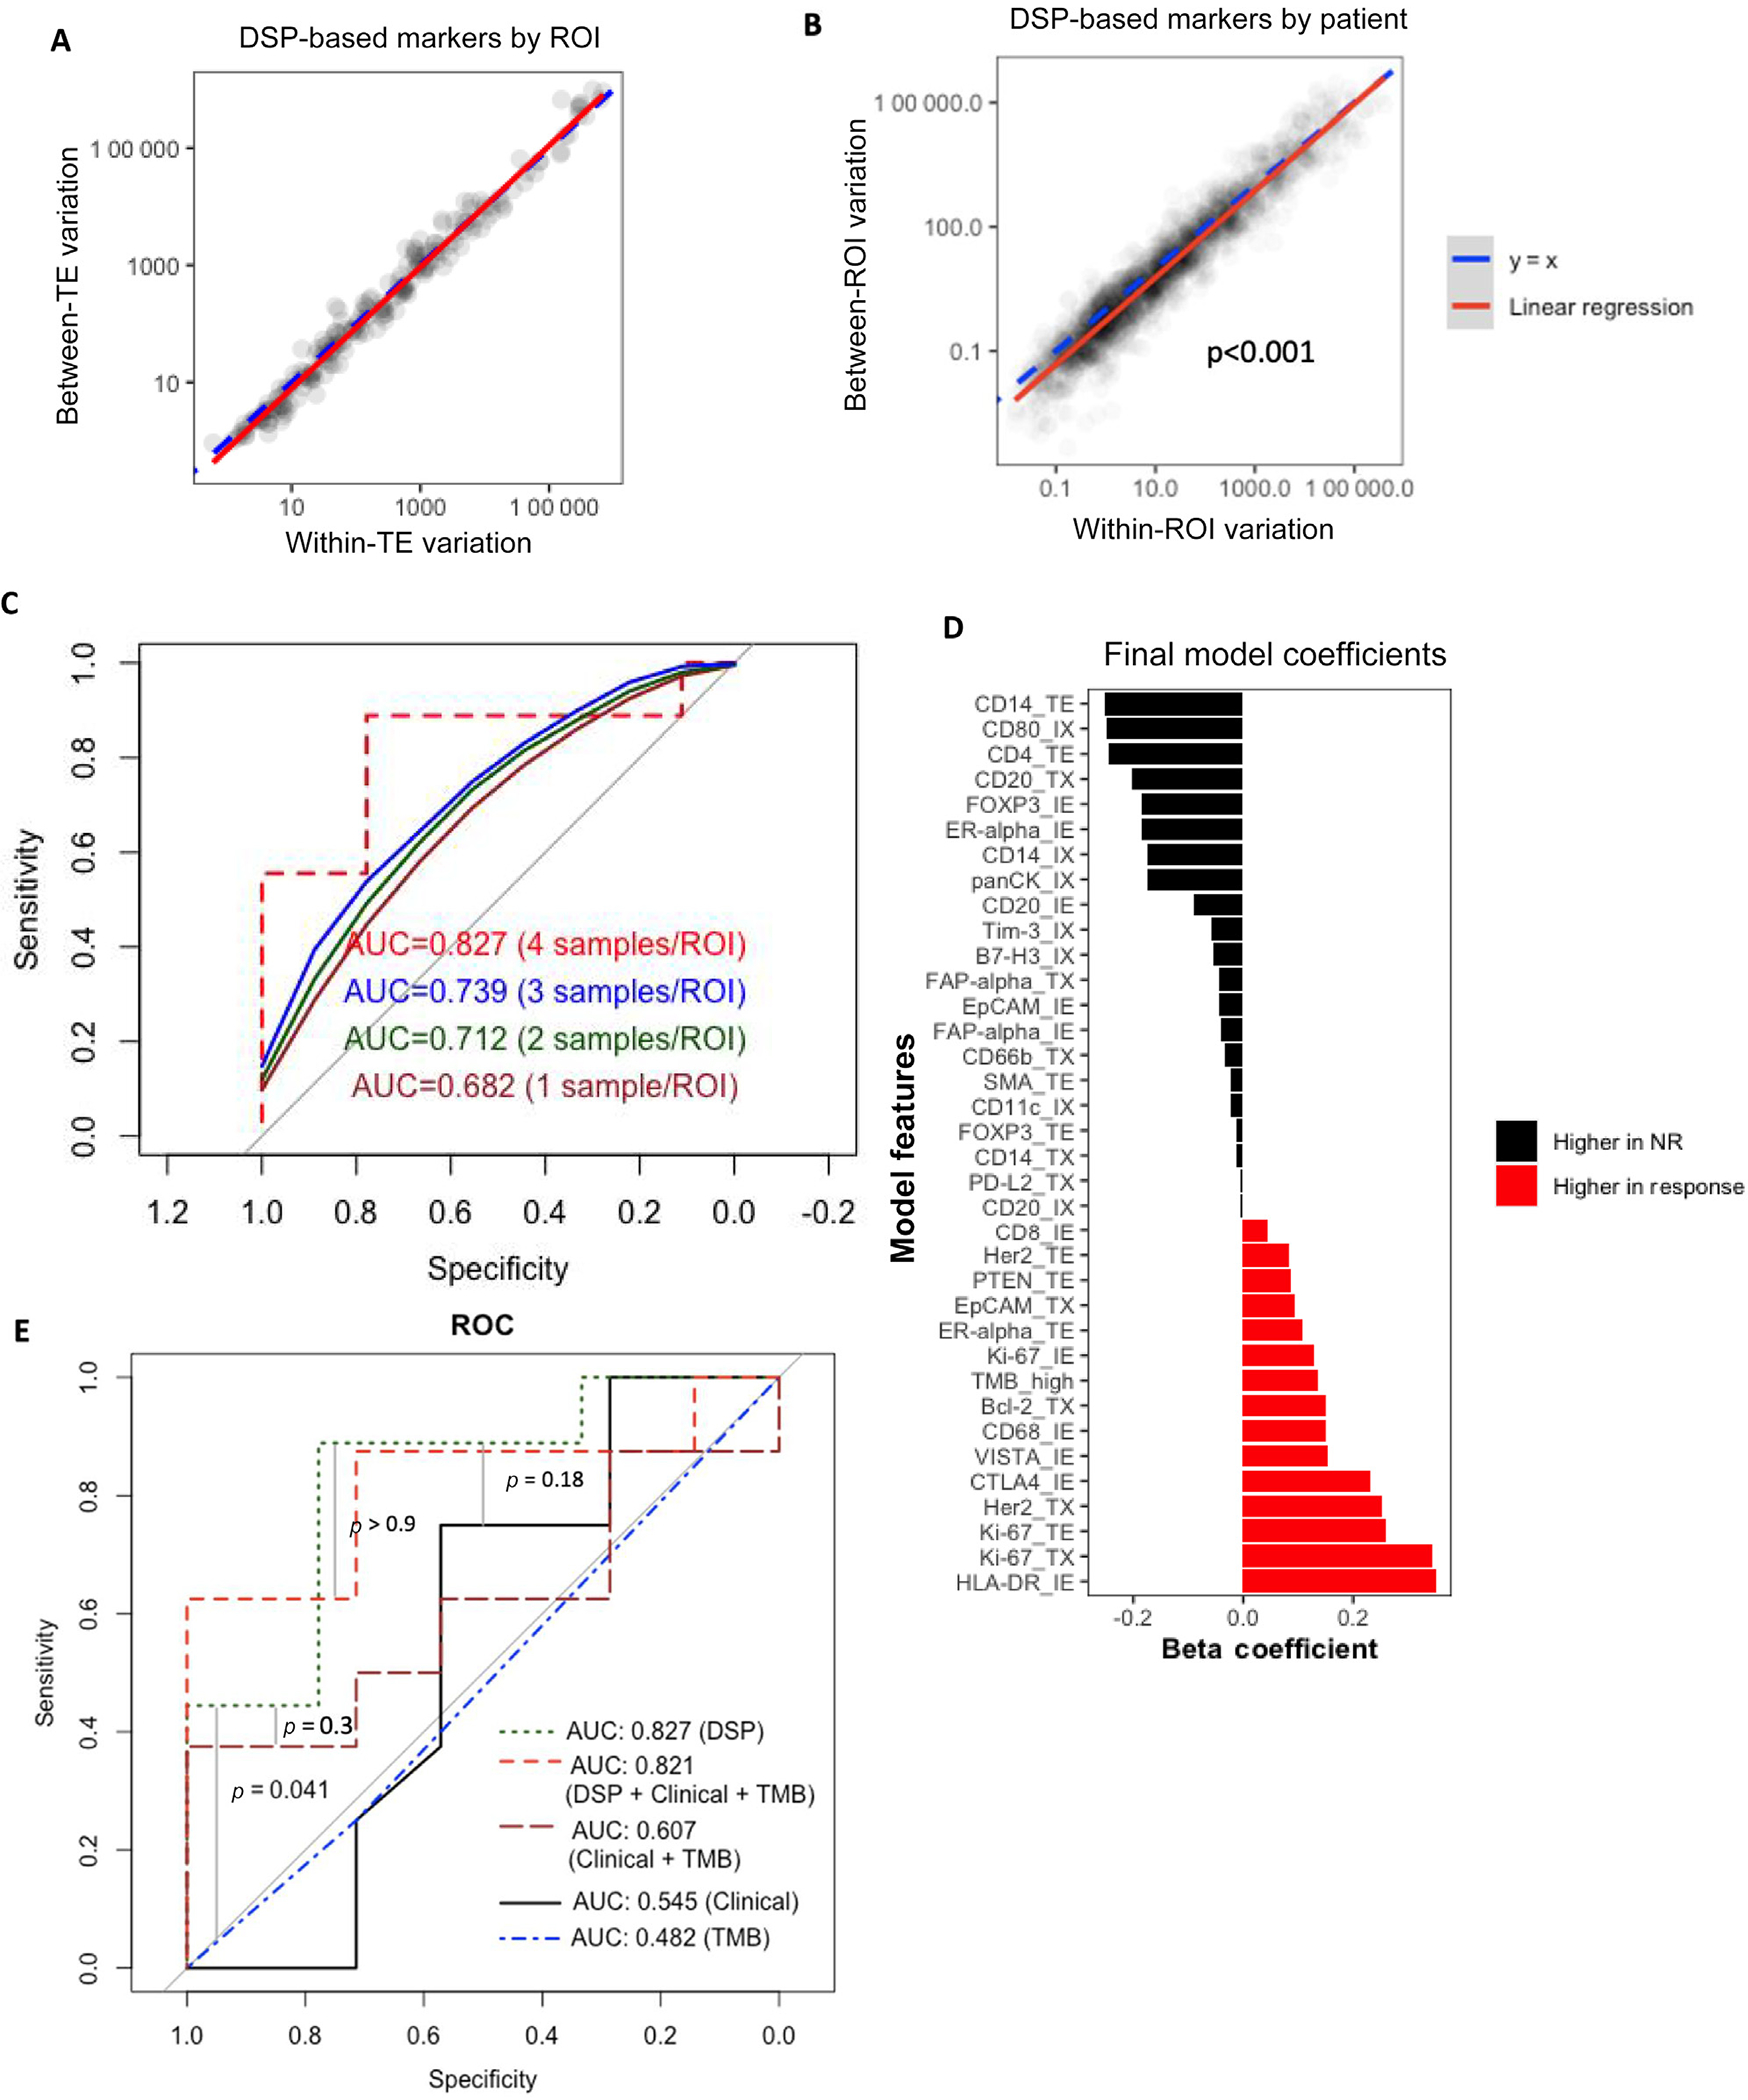
Results and limitations: Protein marker expression patterns were analyzed to determine their association with pathologic response, incorporating or agnostic of their ROI designation (TE/IE/TX/IX). Overall, DSP-based marker expression showed high intratumoral heterogeneity; however, response was associated with markers including PD-L1 (ROI agnostic), Ki-67 (ROI agnostic, TE, IE, and TX), HLA-DR (TX), and HER2 (TE). An elastic net model of response with ROI-inclusive markers demonstrated better validation set performance (area under the curve [AUC] = 0.827) than an ROI-agnostic model (AUC = 0.432). A model including DSP, tumor mutational burden, and clinical data performed no better (AUC = 0.821) than the DSP-only model.

Conclusions: Despite high intratumoral heterogeneity of DSP-based marker expression, we observed associations between pathologic response and specific DSP-based markers in a spatially dependent context. Further exploration of tumor region-specific biomarkers may help predict response to neoadjuvant chemoimmunotherapy in MIBC.

Patient summary: In this study, we used the GeoMx platform to perform proteomic digital spatial profiling on transurethral resections of bladder tumors from 18 responders and 18 nonresponders from two studies of neoadjuvant chemotherapy (gemcitabine and cisplatin) plus immune checkpoint inhibitor therapy (LCCC1520 [pembrolizumab] and BLASST-1 [nivolumab]). We found that assessing protein marker expression in the context of tumor architecture improved response prediction.

Keywords: BLASST-1; Bladder cancer; Digital spatial profiling; Elastic net regression; GeoMx; LCCC1520; Neoadjuvant chemoimmunotherapy.


Figures

Fig. 1 –
Fig. 1 –
DSP processing. (A) ROIs were selected from hematoxylin and eosin (H&E)-stained sections to include 12 independent, randomly sampled ROIs (four each of tumor enriched [TE], immune enriched [IE], and mixed tumor-immune [interface]) for analysis. Following pathologist selection of ROIs, the H&E selections were aligned with immunofluorescence staining (panCK and CD45). Masking was performed in the GeoMx software to select the tumor-predominant component of interface regions (TX) and immune-predominant component (IX). Individual ROIs were then interrogated for 52 DSP-based markers. (B) An H&E slide with selected ROIs is shown along with the panCK and CD45 immunofluorescence masking images. AOI = area of interest; DSP = digital spatial profiling; ROI = region of interest.
Fig. 2 –
Fig. 2 –
DSP-based markers are associated with response. The differential expression in responders versus nonresponders of DSP-based markers from BLASST-1 and LCCC1520 was compared in an (A) ROI-agnostic or (B) ROI-inclusive manner. (C) DSP-based markers with DE by response were compared by ROI type. (D) The levels of PD-L1, and the ratios of (E) CD8 to CD4 and (F) CD8 to FOXP3 were compared by ROI in responders versus nonresponders. DE = differentially expressed; DSP = digital spatial profiling; FDR = false discovery rate; IE = immune enriched; IX = immune interface; NR = nonresponse; ROI = region of interest; TE = tumor enriched; TX = tumor interface.
Fig. 3 –
Fig. 3 –
Including ROI improves outcome prediction. The predictor coefficients are shown for an elastic net model trained on BLASST-1 to predict response from the (A) DSP-based markers by ROI. (B) Performance in predicting response in LCCC1520 is compared for three elastic net models: (1) incorporating the actual ROI associated with each DSP-based marker, (2) incorporating randomized ROIs for each DSP-based marker in LCCC1520 with 100 repeat randomizations, and (3) averaging the DSP-based marker levels across ROIs in BLASST-1 and LCCC1520. 95% confidence intervals of the randomized ROI ROC curves are shown in blue. (C) The AUCs of ROC curves from Figure 3A are compared. The (D) survival curves of the response predictions from the EN model and (E) actual patient responses are shown with log-rank p-values. AUC = area under the curve; DSP = digital spatial profiling; EN = elastic net; NR = nonresponse; ROI = region of interest.
Fig. 4 –
Fig. 4 –
Accurate response prediction requires DSP with multiple samples per ROI but does not require clinical data or TMB. (A) The variations between tumors and within tumors were compared for each DSP-based markerROI pair. (B) The variations between ROIs and within ROIs were compared for each DSP-based marker-patient pair. (C) Samples were randomly selected 100 times for each ROI in each patient in LCCC1520. The performance of the elastic net model generated in BLASST-1 is shown for the LCCC1520 data with only one, two, or three samples per ROI per patient, with the average ROC curves across the 100 selections shown. (D) The predictor coefficients are shown for an elastic net model trained on BLASST-1 to predict response from the DSP-based markers by ROI plus clinical variables. (E) The performance in predicting response in LCCC1520 is shown for five elastic net models: the full model incorporating DSP-based markers by ROI plus the clinical variables and TMB, the model incorporating only DSP-based markers by ROI, a model with only TMB, a model with only the clinical variables, and a model with clinical variables plus TMB. AUC = area under the curve; DSP = digital spatial profiling; NR = nonresponse; ROC = receiver operating characteristics; ROI = region of interest; TE = tumor enriched; TMB = tumor mutational burden.
Fig. 5 –
Fig. 5 –
Lasso regression identifies features for multiplex IHC/IF. (A) The predictor coefficients are shown for a lasso model trained on BLASST-1 to predict response from the DSP-based markers by ROI. (B) Performance in predicting response in LCCC1520 is compared between the DSP-only EN model and the lasso model. (C) Survival is compared between lasso modelpredicted responders and nonresponders in LCCC1520. (D) A schematic for ROI approximation and lasso model prediction using multiplex IF/IHC is shown. AUC = area under the curve; DSP = digital spatial profiling; EN = elastic net; IE = immune enriched; IF = immunofluorescence; IHC = immunohistochemistry; IX = immune interface; NR = nonresponse; ROI = region of interest; TE = tumor enriched; TX = tumor interface.

References

    1. International collaboration of Trialists, Medical Research Council Advanced Bladder Cancer Working Party (now the National Cancer Research Institute Bladder Cancer Clinical Studies Group), European Organisation for Research and Treatment of Cancer Genito-Urinary Tract Cancer Group, et al. International phase III trial assessing neoadjuvant cisplatin, methotrexate, and vinblastine chemotherapy for muscle-invasive bladder cancer: long-term results of the BA06 30894 trial. J Clin Oncol 2011;29:2171–7. - PMC - PubMed
    1. Grossman HB, Natale RB, Tangen CM, et al. Neoadjuvant chemotherapy plus cystectomy compared with cystectomy alone for locally advanced bladder cancer. N Engl J Med 2003;349:859–66. - PubMed
    1. Iyer G, Tully CM, Zabor EC, et al. Neoadjuvant gemcitabine-cisplatin plus radical cystectomy-pelvic lymph node dissection for muscle-invasive bladder cancer: a 12-year experience. Clin Genitourin Cancer 2020;18:387–94. - PMC - PubMed
    1. Balar AV, Kamat AM, Kulkarni GS, et al. Pembrolizumab monotherapy for the treatment of high-risk non-muscle-invasive bladder cancer unresponsive to BCG (KEYNOTE-057): an open-label, single-arm, multicentre, phase 2 study. Lancet Oncol 2021;22:919–30. - PubMed
    1. Bajorin DF, Witjes JA, Gschwend JE, et al. Adjuvant nivolumab versus placebo in muscle-invasive urothelial carcinoma. N Engl J Med 2021;384:2102–14. - PMC - PubMed