. 2023 Dec 13;14(1):8095.
doi: 10.1038/s41467-023-43630-3.

Niacin restriction with NAMPT-inhibition is synthetic lethal to neuroendocrine carcinoma

Affiliations

Niacin restriction with NAMPT-inhibition is synthetic lethal to neuroendocrine carcinoma

Miyuki Nomura et al. Nat Commun. .

Abstract

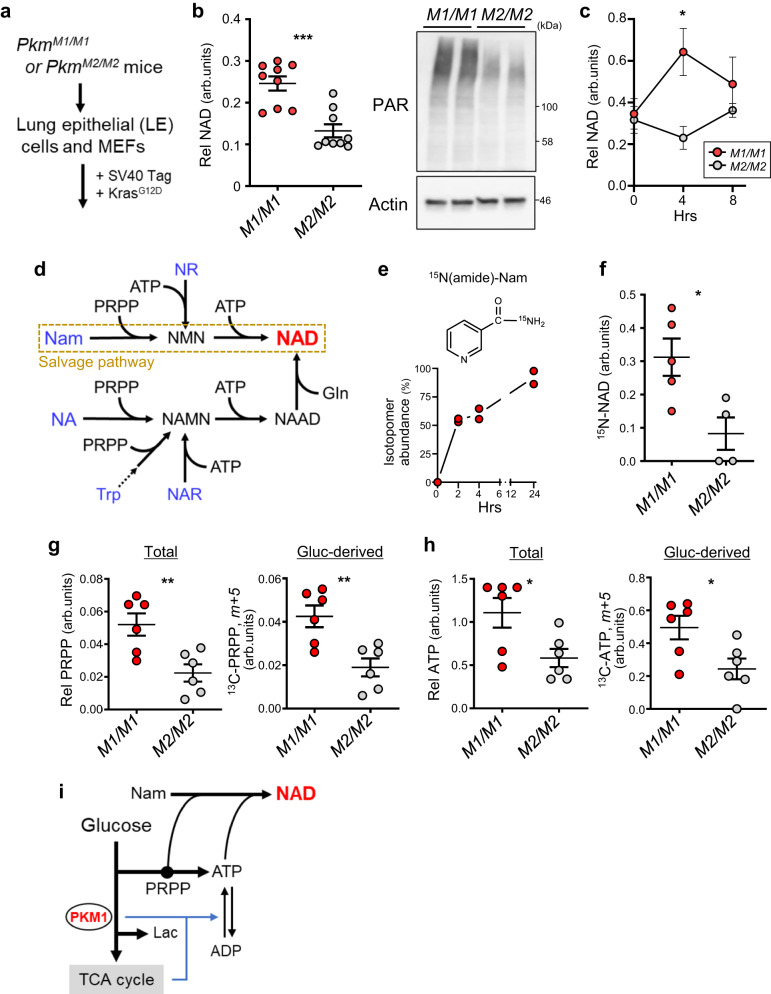
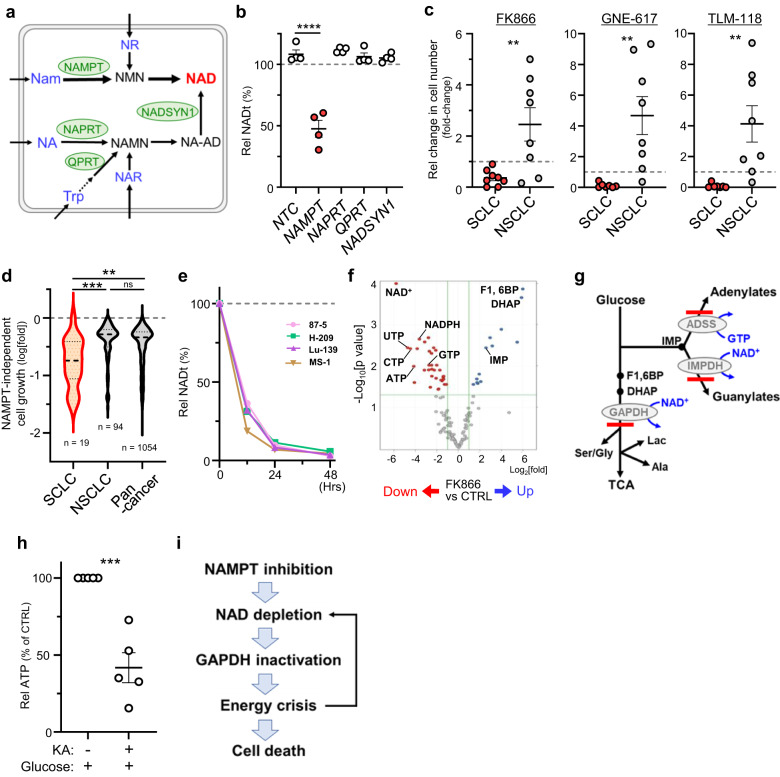
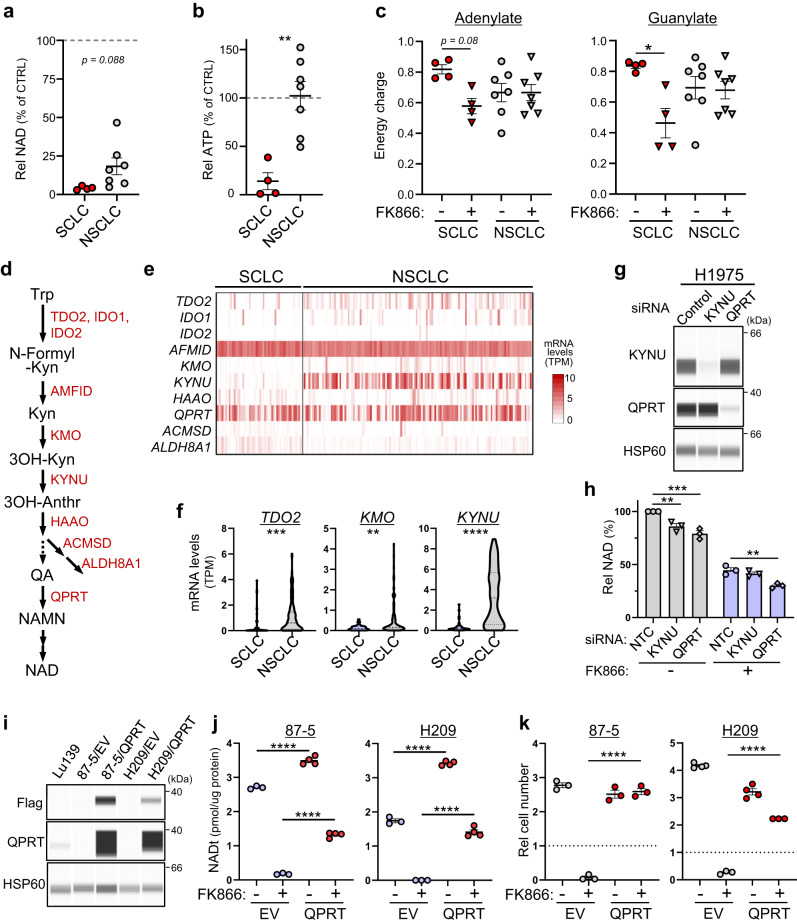
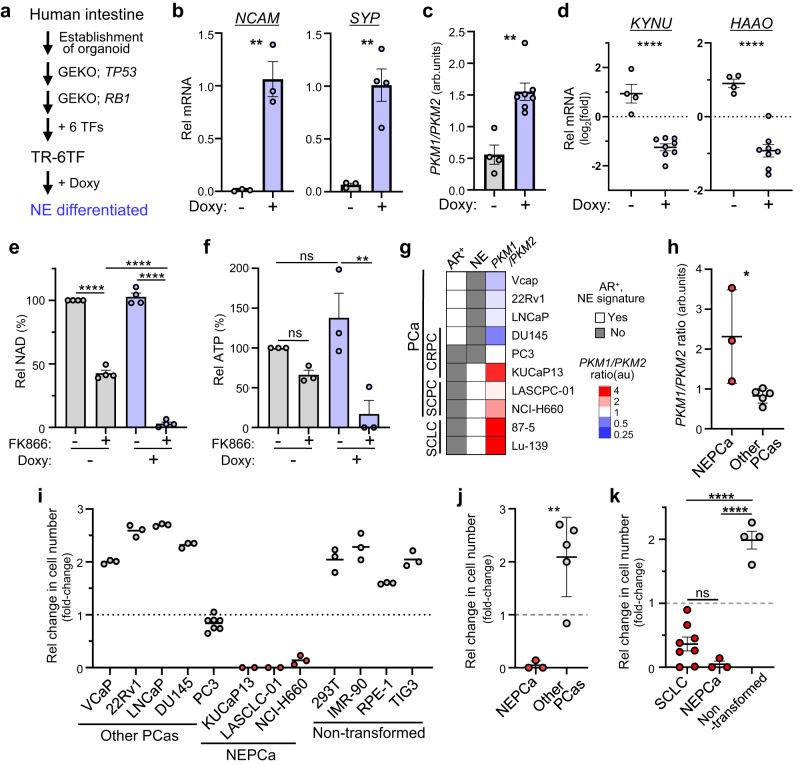
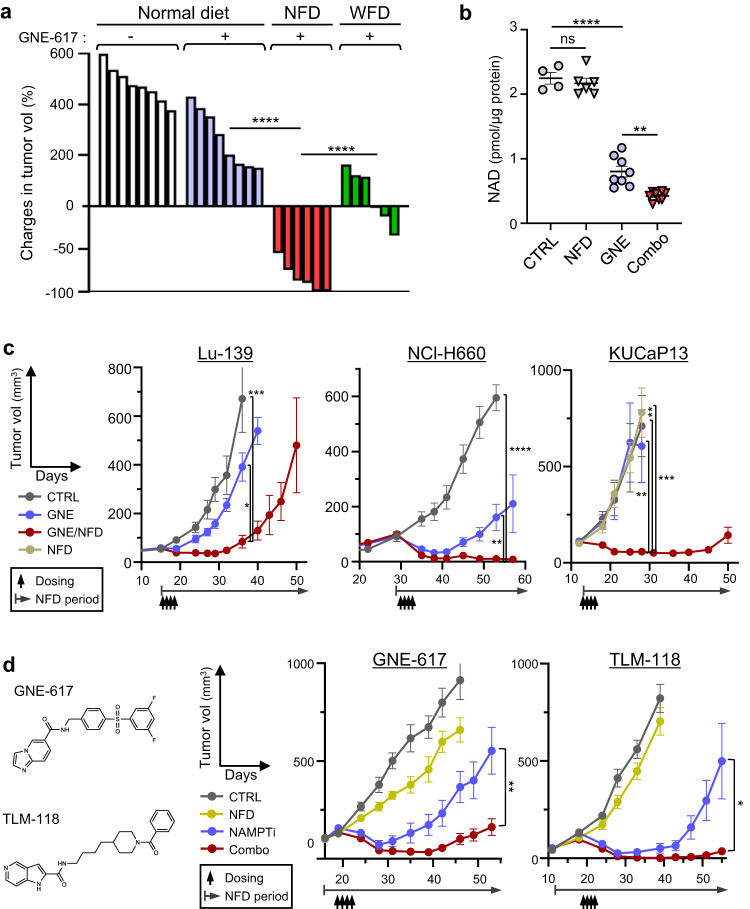
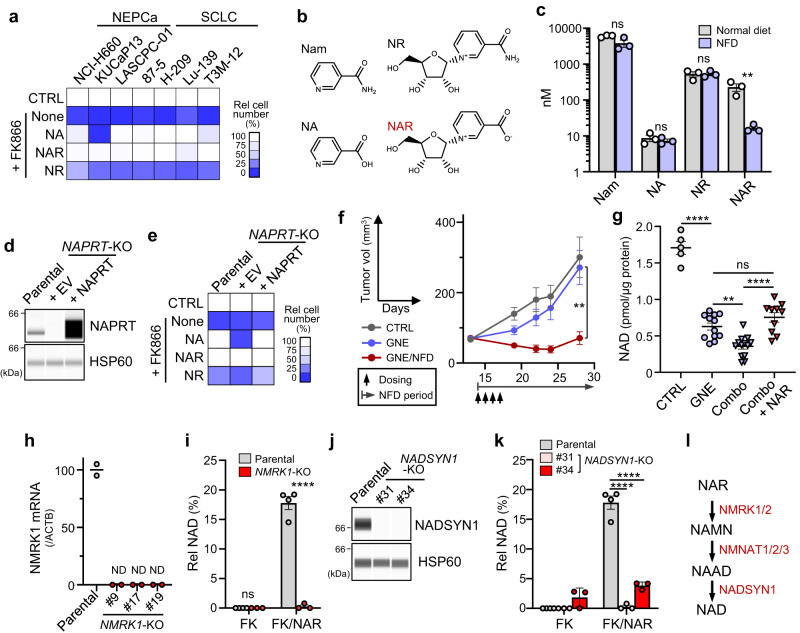
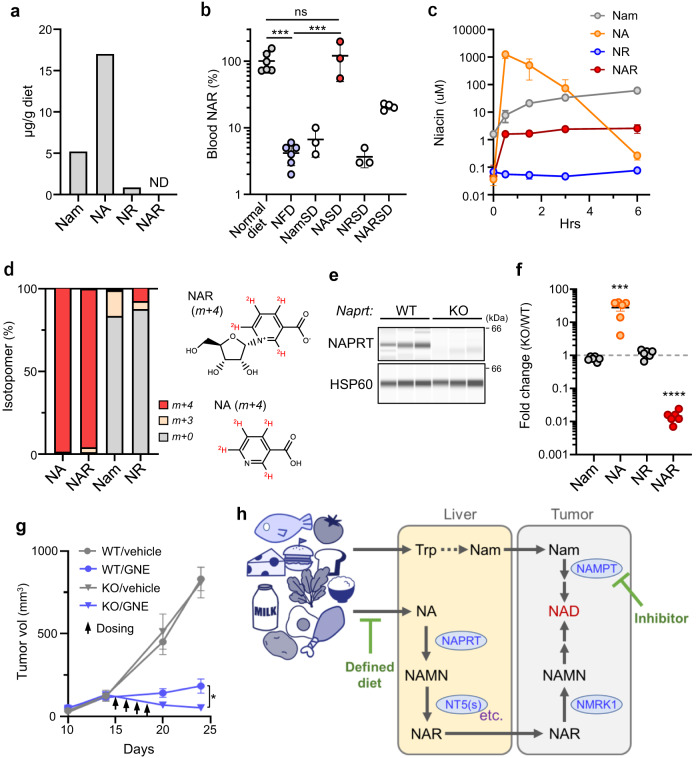
Nicotinamide phosphoribosyltransferase (NAMPT) plays a major role in NAD biosynthesis in many cancers and is an attractive potential cancer target. However, factors dictating therapeutic efficacy of NAMPT inhibitors (NAMPTi) are unclear. We report that neuroendocrine phenotypes predict lung and prostate carcinoma vulnerability to NAMPTi, and that NAMPTi therapy against those cancers is enhanced by dietary modification. Neuroendocrine differentiation of tumor cells is associated with down-regulation of genes relevant to quinolinate phosphoribosyltransferase-dependent de novo NAD synthesis, promoting NAMPTi susceptibility in vitro. We also report that circulating nicotinic acid riboside (NAR), a non-canonical niacin absent in culture media, antagonizes NAMPTi efficacy as it fuels NAMPT-independent but nicotinamide riboside kinase 1-dependent NAD synthesis in tumors. In mouse transplantation models, depleting blood NAR by nutritional or genetic manipulations is synthetic lethal to tumors when combined with NAMPTi. Our findings provide a rationale for simultaneous targeting of NAR metabolism and NAMPT therapeutically in neuroendocrine carcinoma.


Conflict of interest statement

The authors declare no competing interests.

Figures

Fig. 1
Fig. 1. PKM1 activates NAD synthesis in mouse cells more robustly than PKM2.
a Isolation and transformation of PkmM1/M1 or PkmM2/M2 LE cells and MEFs. b Steady state levels of cellular NAD (left) and poly-ADP-ribosylated protein (PAR) (right) in PkmM1/M1 and PkmM2/M2 LE-Kras cells. n = 3 biological replicates from 3 LE lines for each genotype. P = 0.0002. The blot shown is representative of three independent experiments. c NAD levels in PkmM1/M1 and PkmM2/M2 MEF-Kras cells before and after medium change (4 or 8 h). n = 6 (0 h), 4 (4 h, M2/M2) or 5 (others) biological replicates from two MEF lines for each genotype. P = 0.0197 (4 h). d Diagram of NAD synthetic pathways in mammals. Nam nicotinamide, NA nicotinic acid, NAR nicotinic acid riboside, NR nicotinamide riboside, NMN nicotinamide mononucleotide, NAMN nicotinic acid mononucleotide, NAAD nicotinic acid adenine dinucleotide. e Enrichment of labeled NAD (labeled vs total NAD) in PkmM1/M MEF-Kras cells cultured in the presence of [15N (amide)]-Nam for indicated times. Shown are data from two independent MEF lines. f NAD synthesis from Nam in PkmM1/M1 and PkmM2/M2 MEF-Kras cells. Cellular 15N-NAD (NAD, m+1) levels were measured 4 hours after 15N-Nam loading. n = 5 (M1/M1) or 4 (M2/M2) biological replicates from two MEF lines per genotype. P = 0.0202. g Levels of total (left) and glucose-derived (right) PRPP (m+5) in PkmM1/M1 and PkmM2/M2 MEF-Kras cells loaded 4 h in medium containing [U-13C]-glucose. Shown are the average of three independent MEF lines per genotype with duplicates. P = 0.0062 (Total); P = 0.0047 (Gluc-derived). h Levels of total (left) and glucose-derived (right) ATP, determined as in (g). Shown is the average of three independent MEF lines per genotype, with duplicates. P = 0.0269 (Total); P = 0.0248 (Gluc-derived). i Potential crosstalk between glucose-metabolism and NAD synthesis. Data are presented as mean plus the range (e) or SEM (b, c, f, g, h). *P < 0.05, **P < 0.01, ***P < 0.001 as determined by two-tailed t test (b, c, fh). Source data are provided as a Source Data file.
Fig. 2
Fig. 2. Significant vulnerability of SCLC to inhibition of NAD salvage.
a Key metabolic enzymes involved in NAD biosynthesis (shown in green) and potential nutrient sources (blue) taken up by cells. Note that Nam and Trp are the only NAD precursors contained in normal culture medium. See also Fig. 1, which describes substrates required for each reaction. b Effects of siRNA-mediated knockdown of enzymes shown in (a) on NAD levels in 4 SCLC lines. Shown are values relative to those seen in mock-transfected cells, which were defined as 100%. Circles represent individual lines. P<0.0001 (NTC vs NAMPT). c Comparison of relative numbers of cells (relative to the number on day 0) in SCLC and NSCLC lines cultured 4 days with indicated NAMPT-inhibitors (FK866, GNE-617 or TLM-118), each at 20 nM. Each symbol represents an individual cell line. Shown are results of 8 (for FK866) or 7 (GNE-617 and TLM-118) SCLC lines and 8 NSCLC lines. P = 0.0069 (FK866); P = 0.0045 (GNE-617); P = 0.0073 (TLM-118). d Analysis of the DepMap dataset showing effects of NAMPT knock-out on proliferation of cell lines in the CCLE collection. Results were compared in pan-cancer, NSCLC and SCLC categories. P = 0.0001 (SCLC vs NSCLC); P = 0.0017 (SCLC vs Pan-cancer); P = 0.0652 (NSCLC vs Pan-cancer). e Time course analysis of NAD levels in 4 NAMPTi-treated SCLC lines (87-5, H209, Lu-139, and MS-1). Shown is data representative of >2 independent experiments. f Volcano plot of the metabolome of 4 SCLC lines in (e) treated 48 h with or without NAPMTi. Significantly increased or decreased metabolites compared to untreated controls are shown in blue and red, respectively. p values were based on a two-tailed t test. g Summary of 13C-glucose tracer experiments in SCLC cells. FK866 treatment blocked glucose metabolism at steps catalyzed by GAPDH, IMPDH and ADSS (thick red lines). Lac., lactate. TCA TCA cycle. h ATP levels in 5 SCLC lines treated 6 h with Koningic acid (KA) (a GAPDH inhibitor) or control vehicle. P = 0.0003. i Proposed model of NAMPT inhibition-induced death of SCLC cells. Data are presented as the mean of measurement duplicates (e) or the mean of biological replicates plus the SEM (b, c, h). **P < 0.01, ***P < 0.001, ****P < 0.0001 as determined by one-way ANOVA with a post hoc test (b, d) or by two-tailed t test (c, h). Source data are provided as a Source Data file.
Fig. 3
Fig. 3. Absence of QPRT-dependent de novo NAD synthesis promotes NAMPTi susceptibility in SCLC.
a, b Relative NAD (a) and ATP (b) levels in 7 NSCLC and 4 SCLC cell lines treated 48 h with NAMPTi. Results are shown as values relative to those seen in non-treated controls. Each symbol represents an individual cell line. P = 0.0022 (b). c Adenylate and guanylate energy charge of cells treated 48 h with or without NAMPTi. Shown are results of 7 NSCLC and 4 SCLC cell lines. P = 0.0789 (SCLC, adenylate); P = 0.0215 (SCLC, guanylate). d NAD de novo synthesis pathway. Kyn Kynureine, 3OH-Anthr 3-OH-anthranilic acid, QA quinolinic acid. e Expression of genes encoding enzymes shown in (d) in 50 SCLC and 135 NSCLC cell lines collected in the DepMap dataset. f mRNA levels of three indicated genes whose expression significantly differs between SCLC and NSCLC groups. P = 0.0006 (TDO2); P = 0.0012 (KMO); P <0.0001 (KYNU). g Immunoassays showing knock-down efficiency of indicated siRNAs in H1975 NSCLC cells. The blot shown is representative of three independent experiments. h Effects of knockdown of either KYNU or QPRT on NAD levels in H1975 cells. n = 3 biological replicates. P = 0.0044 (NTC vs KYNU, wo FK866); P = 0.0001 (NTC vs QPRT, wo FK866); P = 0.0036 (NTC vs QPRT, w/ FK866). i, j Immunoassays (i) and NAD levels (j) of SCLC cells transduced with Flag-QPRT or empty vector (EV). The blot shown is representative of two independent experiments (i). n = 3 (87-5/EV and H209/EV cells) or 4 (87-5/QPRT and H209/QPRT cells) biological replicates in (j). P <0.0001 (EV vs QPRT, wo FK866, 87-5); P <0.0001 (EV vs QPRT, w/ FK866, 87-5); P <0.0001 (EV vs QPRT, wo FK866, H209); P <0.0001 (EV vs QPRT, w/ FK866, H209). k SCLC cells in i were treated 4 days with 20 nM FK866 and viable cells were scored. Dashed lines represent cell number at day 0. n = 3 (87-5/EV, 87-5/QPRT and FK866-treated H209/EV or H209/QPRT cells) or 4 (untreated H209/EV or H209/QPRT cells) biological replicates. P <0.0001 (EV vs QPRT, w/ FK866, 87-5); P < 0.0001 (EV vs QPRT, w/ FK866, H209). Data are presented as mean plus SEM. *P < 0.05, **P < 0.01, ***P < 0.001, ****P < 0.0001 as determined by one-way ANOVA with a post hoc test (c, h, j, k) or by two-tailed t test (a, b, f). Source data are provided as a Source Data file.
Fig. 4
Fig. 4. High NAMPT-dependence is associated with NE phenotypes.
a Schematic showing establishment of TR-6TF, a human organoid that can be differentiated into a NE lineage following doxycycline (Doxy)-dependent induction of 6 transcription factors (TF). 6TF: ASCL1, NEUROD1, NKX2-5, POU3F2, SOX2 and TP73. GEKO, gene knock-out. b, c qRT-PCR analyses of TR-6TF organoids. Shown are levels of transcripts encoding NE markers (b) and the PKM1/PKM2 mRNA ratio (c). n = 4 (Doxy-treated group for SYP) or 3 (all others) biological replicates in (b). n = 4 (untreated) or 7 (Doxy-treated) biological replicates in (c). P = 0.0032 (NCAM); P = 0.0036 (SYP) (b). P = 0.0012 (c). d qRT-PCR analyses of TR-6TF organoids. Shown are KYNU and HAAO transcript levels. n = 4 (untreated) or 8 (Doxy-treated) biological replicates. P <0.0001 (KYNU); P <0.0001 (HAAO). e, f NAD (e) and ATP (f) levels in TR-6TF organoids cultured in the presence or absence of Doxy and then treated or untreated 48 h with FK866. n = 3 or 4 biological replicates. P < 0.0001 (w/ vs wo FK866, wo Doxy); P <0.0001 (wo vs w/ Doxy, w/ FK866); P <0.0001 (wo vs w/ FK866, w/ Doxy) (e). P = 0.5724 (wo vs w/ FK866, wo Doxy); P = 0.4892 (wo vs w/ Doxy, wo FK866); P = 0.0064 (wo vs w/ FK866, w/ Doxy) (f). g Classification of prostate cancer (PCa) lines divided into groups based on histopathological types (SCPC, CRPC, or not), androgen receptor (AR) expression and a neuroendocrine (NE) signature. The PKM1/PKM2 ratio was determined by qRT-PCR analysis. Scores are averages of at least two duplicates. Two SCLC lines at the bottom (87-5 and Lu-139) are shown for comparison. h Calculation of the PKM1/PKM2 ratio in NE-type (NEPCa) versus other PCas. Shown are results of 3 NEPCa and 5 other PCa cell lines. P = 0.0265. i Fold-change in the number of cells in PCa and non-transformed lines cultured 4 days with 20 nM FK866. Dashed line represents cell number at day 0. n = 2 (KUCaP13 and LASCLC-01), 7 (PC-3) or 3 (all others) biological replicates. j Comparison of results shown in (i) between NEPCa and other PCas. Shown are results of 3 NEPCa and 5 other PCa cell lines. P = 0.0038. k Comparison of changes in cell number after 4 days of FK866 treatment in SCLC (results shown in Fig. 2c), NEPCa and non-transformed lines (i). Shown are results from 8 SCLC, 3 NEPCa and 4 non-transformed cell lines. P = 0.2459 (SCLC vs NEPCa); P <0.0001 (SCLC vs non-transformed); P <0.0001 (NEPCa vs non-transformed). Data are presented as mean plus the SEM. *P<0.05, **P<0.01, ****P<0.0001 as determined by one-way ANOVA with a post hoc test (e, f, k) or by two-tailed t test (b, c, d, h, j). ns., not significant. Source data are provided as a Source Data file.
Fig. 5
Fig. 5. Restriction of dietary niacin enhances NAMPT-targeting therapy in mice.
a Effects of either NFD or WFD on GNE-617 (GNE) therapeutic effects. Volumes of Lu-139 tumors at day 12 are shown relative to baseline (day 0) volumes. Each bar represents a tumor. n = 8 (Normal diet groups) or 6 (NFD and WFD) tumors. P<0.0001 (Normal diet vs NFD, GNE-617); P<0.0001 (NFD vs WFD). b NAD levels in Lu-139 tumors from mice treated with NFD, NAMPTi (GNE) or both (Combo). Each symbol represents one tumor. n = 4 (CTRL), 6 (NFD) or 8 (all others) tumors. P = 0.9034 (CTRL vs NFD); P<0.0001 (CTRL vs GNE); P = 0.0016 (GNE vs Combo). c Growth curves of SCLC (Lu-139), SCPC (NCI-H660) and NEPCa (KUCaP13) xenograft tumors in mice treated with vehicle (CTRL), GNE-617 alone (GNE) or GNE-617 plus NFD (Combo). KUCaP13 graph also includes results from mice treated only with NFD. n = 6 (CTRL and GNE) or 8 (GNE/NFD) Lu-139 tumors; n = 6 (CTRL), 5 (GNE) or 9 (GNE/NFD) NCI-H660 tumors; n = 4 (CTRL), 6 (GNE and NFD) or 10 (GNE/NFD) KUCaP13 tumors. P = 0.0002 (CTRL vs GNE/NFD, day 36, Lu-139); P = 0.0335 (GNE vs GNE/NFD, day 36, Lu-139); P <0.0001 (CTRL vs GNE/NFD, day 53, NCI-H660); P = 0.0065 (GNE vs GNE/NFD, day 53, NCI-H660); P = 0.0053 (CTRL vs GNE/NFD, day 28, KUCaP13); P = 0.0005 (NFD vs GNE/NFD, day 28, KUCaP13); P = 0.0074 (GNE vs GNE/NFD, day 28, KUCaP13). d Analyses using two structurally dissimilar NAMPT inhibitors (GNE-617 and TLM-118). (left) Compound structures. (right panels) Growth curves of 87-5 SCLC tumors in mice treated with NFD, a NAMPTi (GNE-617 or TLM-118) or a combination of NFD + the indicated NAMPTi. n = 10 (CTRL, NAMPTi), 7 (NFD) or 12 (Combo) tumors in GNE-617 experiments; n = 8 tumors in TLN-118 experiments. P = 0.0029 (NAMPTi vs Combo, day 53, GNE-617); P = 0.0364 (NAMPTi vs Combo, day 56, TLM-118). Data are presented as mean plus the SEM. *P<0.05, **P<0.01, ***P<0.001, ****P<0.0001 as determined by one-way ANOVA with a post hoc test (ac) or by two-tailed t test (d). ns. not significant. Source data are provided as a Source Data file.
Fig. 6
Fig. 6. Niacin restriction lowers blood NAR and restricts NAMPT-independent NAD synthesis in tumor cells.
a Effects of 10 μM exogenous niacin (NA, NAR or NR) on growth suppression by FK866 in indicated cultured cells. b Structures of niacin molecules found in mouse serum. c Serum levels of niacin molecules shown in (b) in mice fed a normal diet or NFD for 3 days. n = 3 mice (both groups). P = 0.0721 (Nam); P = 0.5360 (NA); P = 0.9509 (NR); P = 0.0180 (NAR). d NAPRT knock-out and rescue. NAPRT was knocked out in 87-5 cells, and one KO clone was transduced with either an NAPRT expression vector or empty vector (EV). The blot shown is representative of >2 independent experiments. e Effects of exogenous niacin on growth suppression by FK866 in cells or the clone in (d). f Growth curves of NAPRT-KO 87-5 xenograft tumors treated as in Fig. 5. n = 6 (CTRL) or 8 (GNE and GNE/NFD) tumors. P = 0.0067 (GNE vs GNE/NFD, day 28). g NAD levels of Lu-139 tumors in mice treated either as in Fig. 5 or with Combo + NAR. Combo: “GNE + NFD”. Each symbol represents one tumor. n = 5 (CTRL), 12 (GNE), 13 (Combo) or 10 (Combo + NAR) tumors. P < 0.0001 (CTRL vs GNE); P = 0.0022 (GNE vs combo); P = 0.3450 (GNE vs Combo + NAR); P <0.0001 (Combo vs Combo + NAR). h qRT-PCR analyses of NMRK1 in parental and NMRK1 knock-out 87-5 clones. Shown are mean values from two duplicate measures. ND not detectable. i NAD levels in parental and NMRK1-KO cells. Parental cells were assessed as four biological replicates. KO clones, each represented by a symbol, are the three independent clones shown in (h). FK, FK866. P<0.0001 (Parental vs NMRK1-KO, FK/NAR). j Immunoassays of NADSYN1-KO 87-5 clones. Shown is representative analysis of two assays. k NAD levels in NADSYN1-KO cells. Parental cell levels are the same as those shown in (i). Also shown are results of two independent KO clones, each with three biological replicates. P <0.0001 (Parental vs #31, FK/NAR); P<0.0001 (Parental vs #34, FK/NAR). l NAD synthesis pathway from NAR. Data are presented as the mean plus SEM (c, f, g, i, k). **P<0.01, ****P<0.0001 as determined by one-way ANOVA with a post hoc test (g, k) or by two-tailed t test (c, f, i). ns not significant. Source data are provided as a Source Data file.
Fig. 7
Fig. 7. Blood NAR is derived from dietary NA, NAPRT-dependently.
a Amounts of indicated niacin molecules found in the normal diet used for mice experiments. ND not detectable. Shown are averages of >2 technical replicates. b Effects of niacin supplementation of NFD on mouse serum NAR levels. n = 6 (normal diet and NFD), 4 (NARSD) or 3 (all others) mice. P = 0.0002 (Normal diet vs NFD); P = 0.9188 (Normal diet vs NASD); P = 0.0002 (NFD vs NASD). c Effects of NA administration (by gavage) on serum niacin levels. n = 3 (0, 1.5 and 6 h) or 4 (0.5 and 3 h) mice per time point. d Levels of labeled and unlabeled niacin molecules in serum of mice administered deuterium-labeled NA ([D4]-NA). Data is from an average of five mice. NAR (m+4) structure derived from [D4]-NA (m+4) is also shown. e NAPRT expression in liver of WT and Naprt-KO mice. n = 3 mice for each genotype. f Effects of Naprt-deficiency on serum levels of niacin molecules. n = 6 mice per genotype. P = 0.0003 (NA); P <0.0001 (NAR). g Effects of host Naprt-deficiency on NAMPTi therapeutic efficacy. NaprtWT;Rag1-/- or Naprt-/-;Rag1-/- mice were inoculated with A2780 cells and treated with GNE-617. n = 6 (WT/vehicle KO/vehicle), 7 (KO/GNE) or 8 (WT/GNE) tumors. P = 0.0136 (WT/GNE vs KO/GNE, day 24). h Proposed model of how systemic niacin metabolism modulates efficacy of NAMPT-targeted therapy. Data are presented as mean (d) or the mean plus SEM (b, c, f, g). *P <0.05, ***P < 0.001, ****P <0.0001 as determined by one-way ANOVA with a post hoc test (b) or by two-tailed t test (f, g). ns not significant. Source data are provided as a Source Data file.

References

    1. Chalishazar MD, et al. Myc-driven small-cell lung cancer is metabolically distinct and vulnerable to arginine depletion. Clin. Cancer Res. 2019;25:5107–5121. doi: 10.1158/1078-0432.CCR-18-4140. - DOI - PMC - PubMed
    1. Huang F, et al. Inosine monophosphate dehydrogenase dependence in a subset of small cell lung cancers. Cell Metab. 2018;28:369–382. doi: 10.1016/j.cmet.2018.06.005. - DOI - PMC - PubMed
    1. Pavlova NN, Zhu J, Thompson CB. The hallmarks of cancer metabolism: still emerging. Cell Metab. 2022;34:355–377. doi: 10.1016/j.cmet.2022.01.007. - DOI - PMC - PubMed
    1. Morita M, et al. PKM1 confers metabolic advantages and promotes cell-autonomous tumor cell growth. Cancer Cell. 2018;33:355–367. doi: 10.1016/j.ccell.2018.02.004. - DOI - PubMed
    1. Jones CL, et al. Nicotinamide metabolism mediates resistance to venetoclax in relapsed acute myeloid leukemia stem cells. Cell Stem Cell. 2020;27:748–764. doi: 10.1016/j.stem.2020.07.021. - DOI - PMC - PubMed

Publication types