. 2023 Dec 13;14(12):821.
doi: 10.1038/s41419-023-06353-3.

Chlorpromazine affects glioblastoma bioenergetics by interfering with pyruvate kinase M2

Affiliations

Chlorpromazine affects glioblastoma bioenergetics by interfering with pyruvate kinase M2

Claudia Abbruzzese et al. Cell Death Dis. .

Abstract

Glioblastoma (GBM) is the most frequent and lethal brain tumor, whose therapeutic outcome - only partially effective with current schemes - places this disease among the unmet medical needs, and effective therapeutic approaches are urgently required. In our attempts to identify repositionable drugs in glioblastoma therapy, we identified the neuroleptic drug chlorpromazine (CPZ) as a very promising compound. Here we aimed to further unveil the mode of action of this drug. We performed a supervised recognition of the signal transduction pathways potentially influenced by CPZ via Reverse-Phase Protein microArrays (RPPA) and carried out an Activity-Based Protein Profiling (ABPP) followed by Mass Spectrometry (MS) analysis to possibly identify cellular factors targeted by the drug. Indeed, the glycolytic enzyme PKM2 was identified as one of the major targets of CPZ. Furthermore, using the Seahorse platform, we analyzed the bioenergetics changes induced by the drug. Consistent with the ability of CPZ to target PKM2, we detected relevant changes in GBM energy metabolism, possibly attributable to the drug's ability to inhibit the oncogenic properties of PKM2. RPE-1 non-cancer neuroepithelial cells appeared less responsive to the drug. PKM2 silencing reduced the effects of CPZ. 3D modeling showed that CPZ interacts with PKM2 tetramer in the same region involved in binding other known activators. The effect of CPZ can be epitomized as an inhibition of the Warburg effect and thus malignancy in GBM cells, while sparing RPE-1 cells. These preclinical data enforce the rationale that allowed us to investigate the role of CPZ in GBM treatment in a recent multicenter Phase II clinical trial.


Conflict of interest statement

The authors declare no competing interests.

Figures

Fig. 1
Fig. 1. RPPA analysis of anchorage-dependent GBM cells and neurospheres challenged with CPZ.
The panels include selected plots of normalized RPPA levels (Arbitrary Units, AU) for (A) endpoints implicated in autophagy and (B) PI3K-mTOR metabolic network, as measured over a three-point dose response of CPZ (Control, IC30 and IC50, from left to right) at either 2 or 8 h. N = 3.
Fig. 2
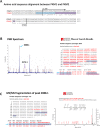
Fig. 2. ABPP + MS output allowing the identification of PKM2 as a CPZ target.
A Sequence alignment of PKM1 and PKM2 between aa 350 and 480. The differences between the isoforms lies within aa 388 and 433. B Left: a representative Peptide Mass Fingerprinting (PMF) spectrum obtained after MS analysis of the PK lane. Blue and violet arrows indicate peptides with m/z values of 2088.1 and 2175.1, corresponding to the aa sequence interval 384–400 and 401–422, respectively, distinctive of the M2 isoform. Right: the relative MASCOT PMF database identification results. C MS/MS fragmentation spectrum of peak 2088.1, confirming the PKM2 aa sequence.
Fig. 3
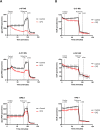
Fig. 3. Interference of CPZ with glucose metabolism in GBM cells.
Cells were incubated using the Seahorse XFp platform. Dashed vertical lines indicate, from left to right, the time of addition of CPZ or solvent for control, rotenone plus AA and 2-DG, respectively. Red lines represent CPZ-treated cells and black lines control (solvent-treated) cells. A GlycoPER plots related to U-87 MG, U-251 MG GBM cell lines and RPE-1 non-cancer cells. B OCR plots related to U-87 MG, U-251 MG GBM cell lines and RPE-1 non-cancer cells. All experiments were performed three times in triplicate. Representative graphs are shown here; dots and vertical bars indicate mean ± SD. Raw data from all experiments are available in Supplementary Material.
Fig. 4
Fig. 4. CPZ increases intracellular pyruvate amount in GBM cells.
Anchorage-dependent U-87 MG and U-251 MG GBM cells and RPE-1 non-cancer cells were exposed to CPZ or solvent (CTL) for 10 min, while neurospheres TS#1 and TS#163 were exposed for 20 min. As a reference, all cell lines were exposed, under the same conditions, to 30 μM DASA-58, a known PKM2 activator. Histograms show the amount of intracellular pyruvate expressed in arbitrary units (a.u.). Asterisks denote statistical significance (*p < 0.05; **p < 0.01). N ≥ 3.
Fig. 5
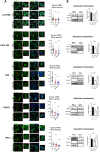
Fig. 5. CPZ produces a decrease in nuclear PKM2 concentration in GBM cells.
A Representative confocal microscopy images of U-87 MG, U-251 MG, TS#1, and TS#163 GBM cell lines and RPE-1 non-cancer cells untreated, CPZ-treated or DASA-58-treated. Green fluorescence shows PKM2, while merging with DAPI (blue) highlights the nuclear structures. The smaller pictures at the right of each image (zoom) reproduce at higher magnification the contents of the red square in each bigger microphotography. Histograms on the right quantify the reduction in nuclear PKM2 mean intensity in CPZ-treated cells (red) or in DASA-58-treated cells (light blue) when compared with controls (black), as evaluated via the microscope software. N ≥ 150 nuclei for CTL and CPZ and ≥80 for DASA-58-treated cells. Scale bars are shown in each microphotography. Asterisks denote statistical significance (*p < 0.05; **p < 0.01; ***p < 0.001). B The protein levels of PKM2 were assessed using western blotting after subcellular fractionation in all of the cell lines mentioned above. To normalize the results, GAPDH and H3-Histone were used for enriched cytoplasmic and nuclear protein lysates, respectively. Representative western blots on the left show a significant decrease in nuclear PKM2 levels after exposure to CPZ for GBM cells and neurospheres. Histograms on the right quantify the expression levels of PKM2 protein, determined by western blotting, in CPZ-treated GBM cells and in the non-cancer RPE-1 cell line compared to their untreated counterparts (*p < 0.05; **p < 0.01;***p < 0.001). N=3.
Fig. 6
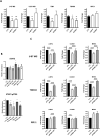
Fig. 6. CPZ hinders the function of nuclear PKM2.
A Expression of c-MYC and CCND1 target genes, as assessed by RT-qPCR, in all the GBM cells and in the RPE-1 cell line. c-MYC and CCND1 expression in untreated cells is normalized to 1.0 (black bars), while their expression under the effect of CPZ are reported as percent variations (white bars). N ≥ 10. B STAT3 total protein amount and STAT3 pY705 amount as assessed via western blot in all the GBM cells and in the RPE-1 cell line. N = 3. C U-87 MG, TS#163 GBM cells, and RPE-1 non-cancer cells were treated with siRNA Control or siRNA-PKM2 and exposed to CPZ or solvent for control. Histograms indicate the levels of CCND1, c-MYC, and MEK5 mRNA expression, as assessed by RT-qPCR when PKM2 expression was downregulated. The histogram bars related to the control (CTL) values, normalized to 1.0 (solid black), refer to the untreated siRNA Control and PKM2 silenced cells. In all the panels, asterisks denote statistical significance (*p < 0.05; **p < 0.01; ***p < 0.001). N ≥ 10.
Fig. 7
Fig. 7. CPZ binds PKM2 tetramer in the same binding pocket of other known activators.
A Molecular structure of the PKM2/CPZ complex. Chain A is shown in blue, chain B in cyan, chain C in magenta, and chain D in yellow. Four FBP and two CPZ molecules are reported as red and green spheres, respectively. B Snapshot of the interaction between chlorpromazine molecule and the chains A and B evidencing stacking and hydrophobic interactions, hydrogen and halogen bonds by dashed black, grey, red, and green lines, respectively.

References

    1. McNeill KA. Epidemiology of brain tumors. Neurol Clin. 2016;34:981–98. doi: 10.1016/j.ncl.2016.06.014. - DOI - PubMed
    1. Stupp R, Mason WP, van den Bent MJ, Weller M, Fisher B, Taphoorn MJ, et al. Radiotherapy plus concomitant and adjuvant temozolomide for glioblastoma. N. Engl J Med. 2005;352:987–96. doi: 10.1056/NEJMoa043330. - DOI - PubMed
    1. Rao JS. Molecular mechanisms of glioma invasiveness: the role of proteases. Nat Rev Cancer. 2003;3:489–501. doi: 10.1038/nrc1121. - DOI - PubMed
    1. Glas M, Rath BH, Simon M, Reinartz R, Schramme A, Trageser D, et al. Residual tumor cells are unique cellular targets in glioblastoma. Ann Neurol. 2010;68:264–9. doi: 10.1002/ana.22036. - DOI - PMC - PubMed
    1. Lan X, Jorg DJ, Cavalli FMG, Richards LM, Nguyen LV, Vanner RJ, et al. Fate mapping of human glioblastoma reveals an invariant stem cell hierarchy. Nature. 2017;549:227–32. doi: 10.1038/nature23666. - DOI - PMC - PubMed

Publication types