. 2023 Dec 13;14(1):8270.
doi: 10.1038/s41467-023-44080-7.

Topological structures and syntenic conservation in sea anemone genomes

Affiliations

Topological structures and syntenic conservation in sea anemone genomes

Bob Zimmermann et al. Nat Commun. .

Abstract

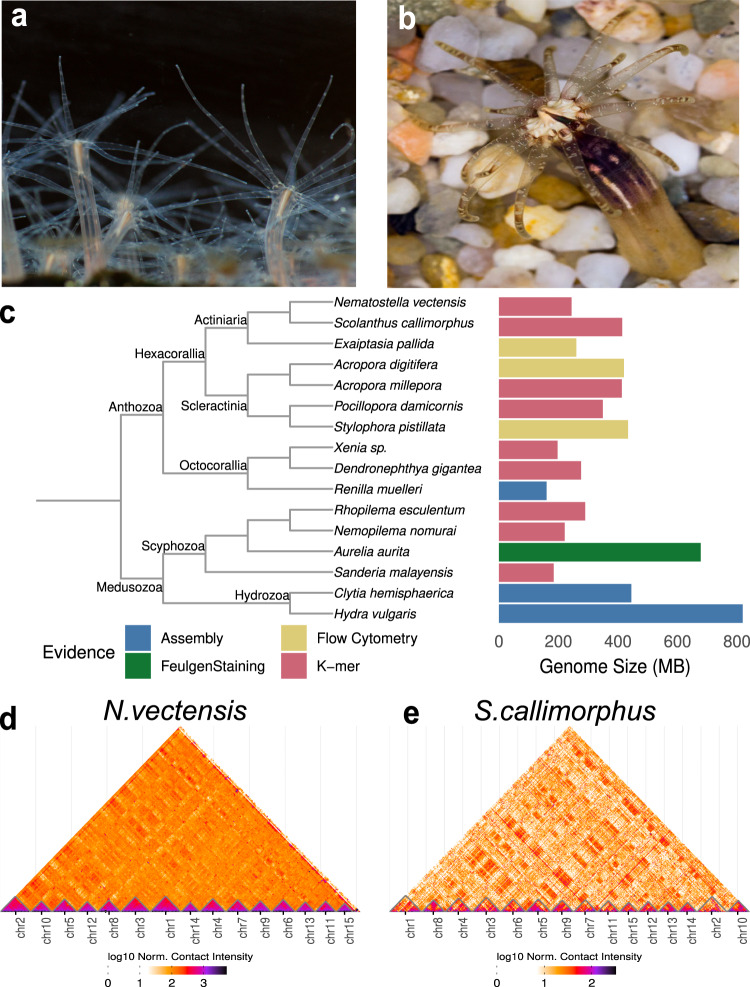
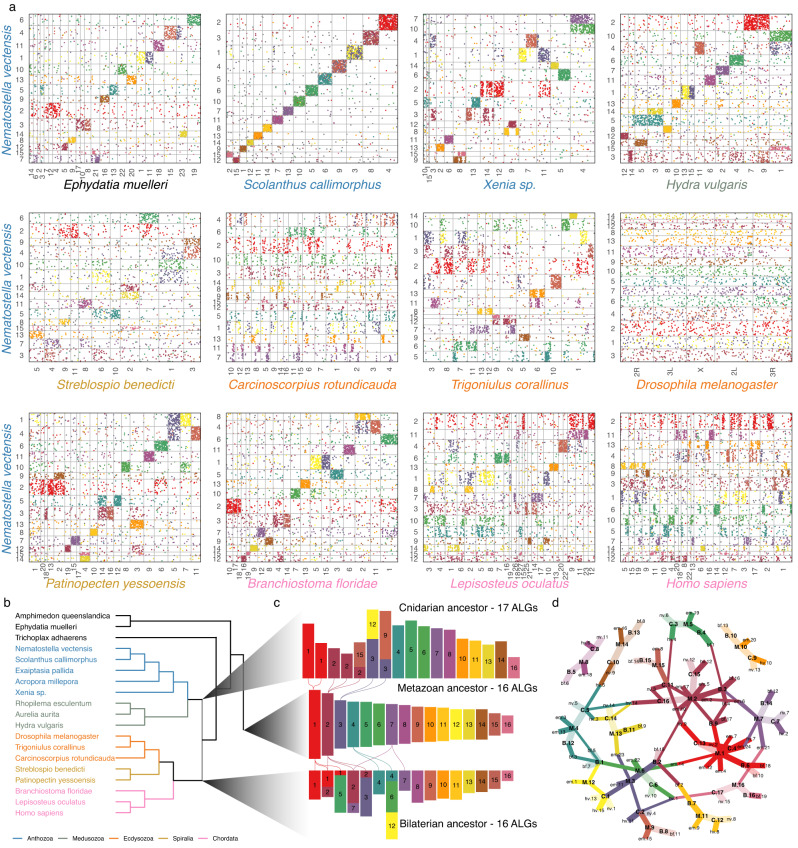
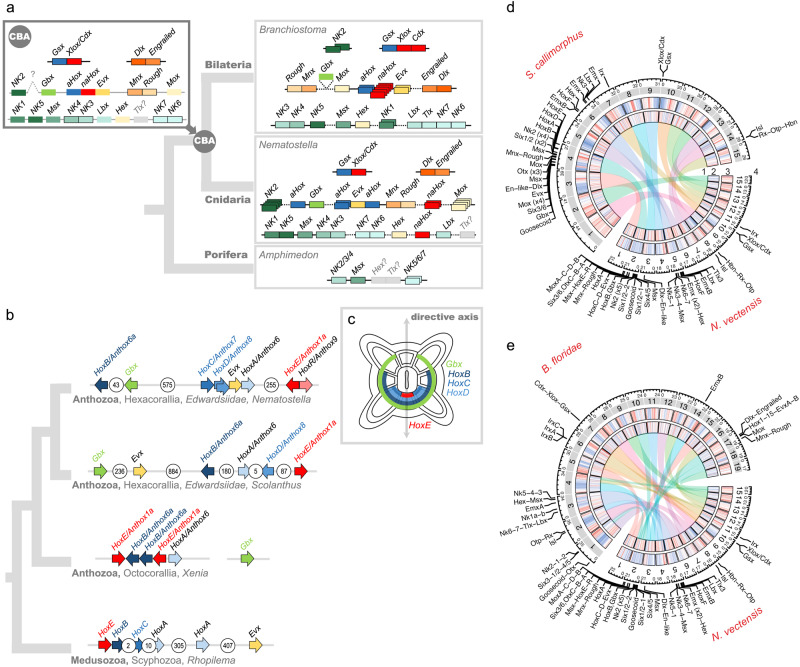
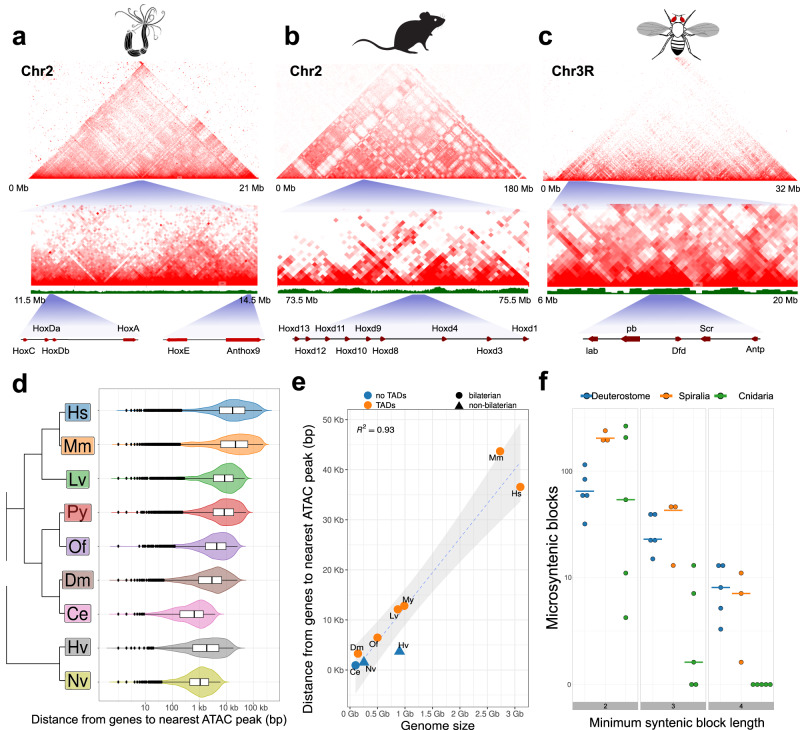
There is currently little information about the evolution of gene clusters, genome architectures and karyotypes in early branching animals. Slowly evolving anthozoan cnidarians can be particularly informative about the evolution of these genome features. Here we report chromosome-level genome assemblies of two related anthozoans, the sea anemones Nematostella vectensis and Scolanthus callimorphus. We find a robust set of 15 chromosomes with a clear one-to-one correspondence between the two species. Both genomes show chromosomal conservation, allowing us to reconstruct ancestral cnidarian and metazoan chromosomal blocks, consisting of at least 19 and 16 ancestral linkage groups, respectively. We show that, in contrast to Bilateria, the Hox and NK clusters of investigated cnidarians are largely disintegrated, despite the presence of staggered hox/gbx expression in Nematostella. This loss of microsynteny conservation may be facilitated by shorter distances between cis-regulatory sequences and their cognate transcriptional start sites. We find no clear evidence for topologically associated domains, suggesting fundamental differences in long-range gene regulation compared to vertebrates. These data suggest that large sets of ancestral metazoan genes have been retained in ancestral linkage groups of some extant lineages; yet, higher order gene regulation with associated 3D architecture may have evolved only after the cnidarian-bilaterian split.


Conflict of interest statement

The authors declare no competing interests.

Figures

Fig. 1
Fig. 1. Chromosomal assembly of edwardsiid sea anemones Nematostella vectensis and Scolanthus callimorphus.
a Nematostella vectensis. photo credit: Patrick RH Steinmetz. b Scolanthus callimorphus. photo credit: Robert Reischl. c Genome size estimates of cnidarian genomes taken from refs. ,,,–,,,,–. Contact maps of N. vectensis scaffolds (d) and S. callimorphus contigs (e).
Fig. 2
Fig. 2. Macrosynteny conservation of edwardsiid genomes and reconstruction of ancestral linkage groups.
a Oxford plots of the macrosyntenic relationships of Nematostella vectensis (y-axis) to genomes of various metazoans (x-axis). Pairwise orthologous are ordered by their position on the chromosome labeled on the axis. Dots (genes) are colored according to their membership to the metazoan ancestral linkage groups (ALGs) shown in (c). Species names are colored according to clade shown in (b). b Genomes represented in this figure and Supplementary Figs. 5–7. c Relationships between the ALGs colored according to the metazoan ALG. Lines are drawn between ALGs to represent fissions. d Graph representing the relationships of metazoan (M), bilaterian (B), and cnidarian (C) ALGs to each other and extant genomes of Ephydatia (em), Nematostella (nv), Rhopilema (re) and Branchiostoma (bf). Edges are colored by the metazoan ALG in (b) from which its path has a source. Line width represents the fraction of the extant genome or derived ALG (bilaterian or cnidarian) content of the ancestral genome. Faded edges represent near one-to-one relationships (>0.8).
Fig. 3
Fig. 3. Evolution of a selection of Antennapedia class homeobox gene clusters.
a Composition of the extended Hox, ParaHox, and NK clusters in the sponge Amphimedon, the sea anemone Nematostella, in a chordate Branchiostoma, and the deduced cluster composition of the cnidarian-bilaterian ancestor (CBA). Grayed-out genes with question marks have uncertain orthology. Genes shown as borderless boxes have an uncertain position relative to neighboring cluster members. Stacked boxes represent clusters of paralogs of the indicated ancestral gene. Genes in immediate proximity are indicated by abutting boxes. Linked genes of the same class separated by 1 to 50 intervening genes are connected with solid lines, over 50, with dashed lines. Gray intergenic connectors in the CBA indicate that the distances and the number of the intervening genes between the cluster members cannot be estimated. NK2 of the CBA may be linked to the extended Hox cluster. Since Branchiostoma Gbx remained unplaced in the chromosome-level assembly, its position was taken from the scaffold-level assembly of Branchiostoma lanceolatum. A two-gene ParaHox CBA scenario is shown although a three-gene ParaHox CBA scenario is possible based on evidence from Scyphozoa. b Organization of the Nematostella Hox cluster in comparison to the Hox clusters of Scolanthus, the octocoral Xenia and a scyphozoan jellyfish Rhopilema indicates loss of microsynteny. c Staggered expression of Gbx and Hox genes along the directive axis of Nematostella (oral view) partially reflects the position of the genes on the chromosome. Arrows show the direction of transcription for each of the genes. The number of intervening genes is indicated in white circles. d, e Chromosomal relationships, genomic content and locations of NK and extended Hox cluster and other landmark homeobox genes of (d) Nematostella and Scolanthus and (e) Nematostella and Branchiostoma. 1) Chord diagram of macrosyntenic relationships of chromosomes based on the inferred ancestral linkage groups. 2) Scaled and centered gene density relative to the respective genome (red=high, blue=low). 3) Scaled and centered density of interspersed repeat elements relative to the respective genome (red=high, blue=low). 4) Locations of the landmark homeobox genes.
Fig. 4
Fig. 4. Hi-C contact maps.
Contact maps (a) Nematostella Hox clusters, (b) Mouse HoxD cluster and (c) Fly Hox cluster show striking differences in the patterns of intrachromosomal interactions; d distribution of the distance from ATAC-seq peaks to their closest peak for human (Hs; n = 2069; SEM = 708.23), mouse (Mm; n = 73,834; SEM = 192.78), Sea urchin (Lytechinus variegatus, Lv; n = 6441; SEM = 139.49), mussel (Patinopecten yessoensis, Py; n = 8831; SEM = 132.51), polychete (Owenia fisuformis, Of; n = 3245; SEM = 107.08), fly (Dm; n = 2811; SEM = 77.38), Caenorhabditis (Ce; n = 4043; SEM = 14.55), Hydra vulgaris (Hv; n = 2069; SEM = 94.12) and Nematostella vectensis (Nv; n = 1611; SEM = 35.3) Vertical bars represent the median, boxes represent the interquartile range and whiskers represent 1.5× the interquartile range. Outliers are represented by dots; e correlation of mean gene-ATAC-seq peak distance and genome size for the same species (regression confidence interval 95%).; f Number of microsyntenic blocks of 2, 3, and 4 genes in cnidarians, deuterostomes and spiralians. The number of syntenic blocks falls rapidly in cnidarians compared to deuterostomes and spiralians as the synteny length increases. Horizontal bars represent the distribution median of within-clade comparisons. Mouse silhouette is from PhyloPic (https://www.phylopic.org/; Daniel Jaron, 2018).

References

    1. Putnam NH, et al. Sea anemone genome reveals ancestral eumetazoan gene repertoire and genomic organization. Science. 2007;317:86–94. doi: 10.1126/science.1139158. - DOI - PubMed
    1. Chapman JA, et al. The dynamic genome of Hydra. Nature. 2010;464:592–596. doi: 10.1038/nature08830. - DOI - PMC - PubMed
    1. Srivastava M, et al. The Amphimedon queenslandica genome and the evolution of animal complexity. Nature. 2010;466:720–726. doi: 10.1038/nature09201. - DOI - PMC - PubMed
    1. Schwaiger M, et al. Evolutionary conservation of the eumetazoan gene regulatory landscape. Genome Res. 2014;24:639–650. doi: 10.1101/gr.162529.113. - DOI - PMC - PubMed
    1. Gaiti F, et al. Landscape of histone modifications in a sponge reveals the origin of animal cis-regulatory complexity. Elife. 2017;6:e22194. doi: 10.7554/eLife.22194. - DOI - PMC - PubMed

Publication types