. 2023 Dec 13;6(1):1265.
doi: 10.1038/s42003-023-05626-z.

COVID-19 and influenza infections mediate distinct pulmonary cellular and transcriptomic changes

Affiliations

COVID-19 and influenza infections mediate distinct pulmonary cellular and transcriptomic changes

Chenxiao Wang et al. Commun Biol. .

Abstract

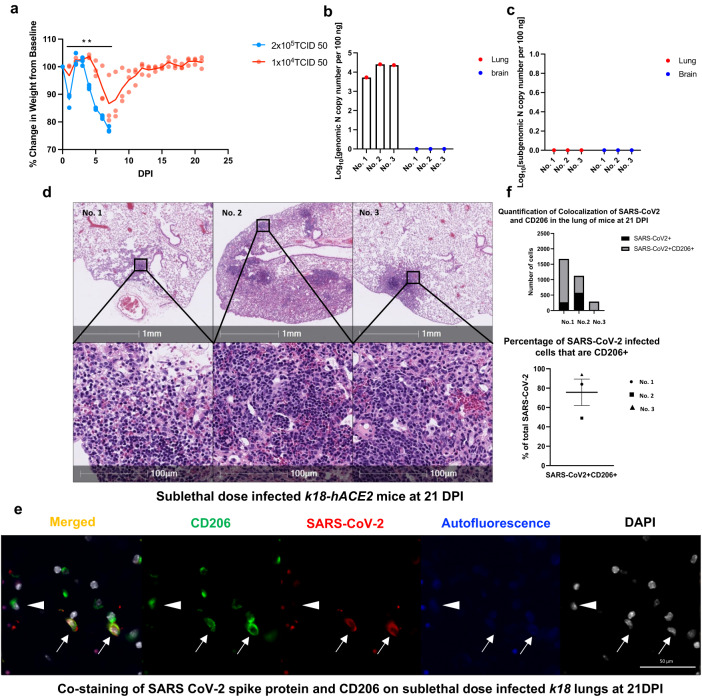
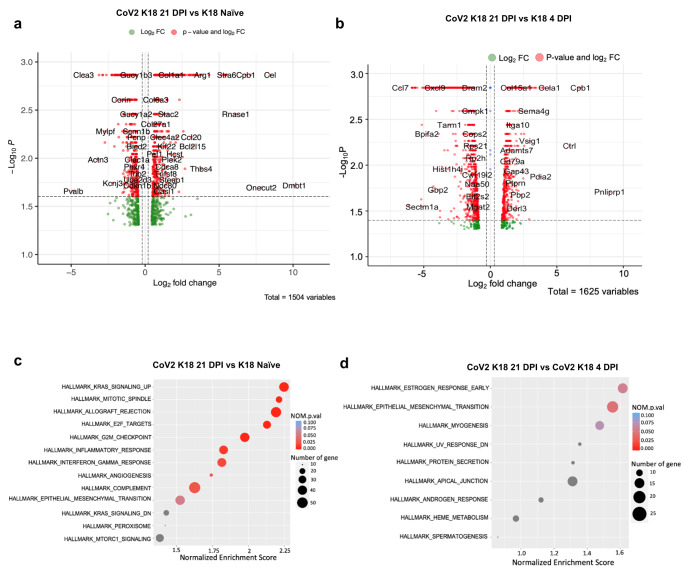
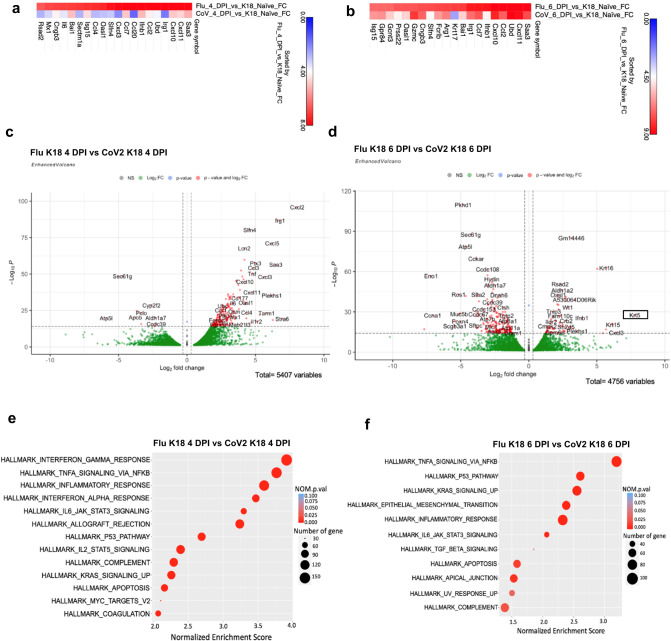
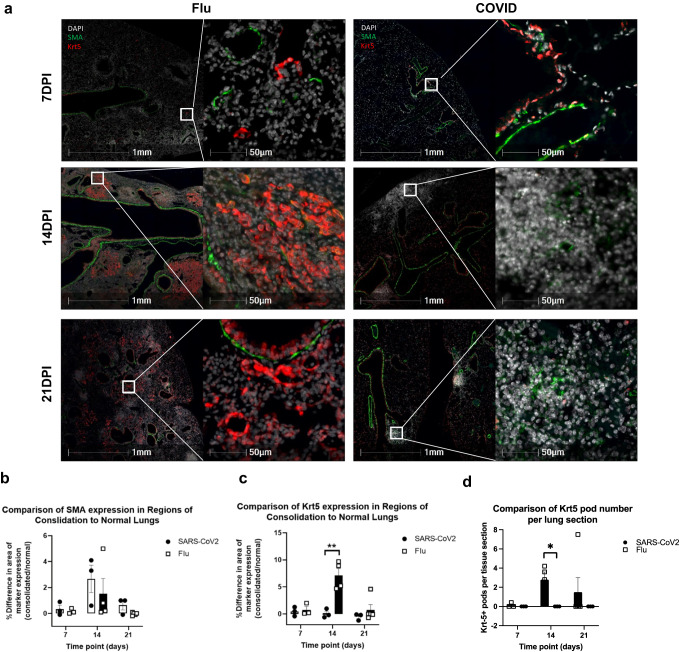
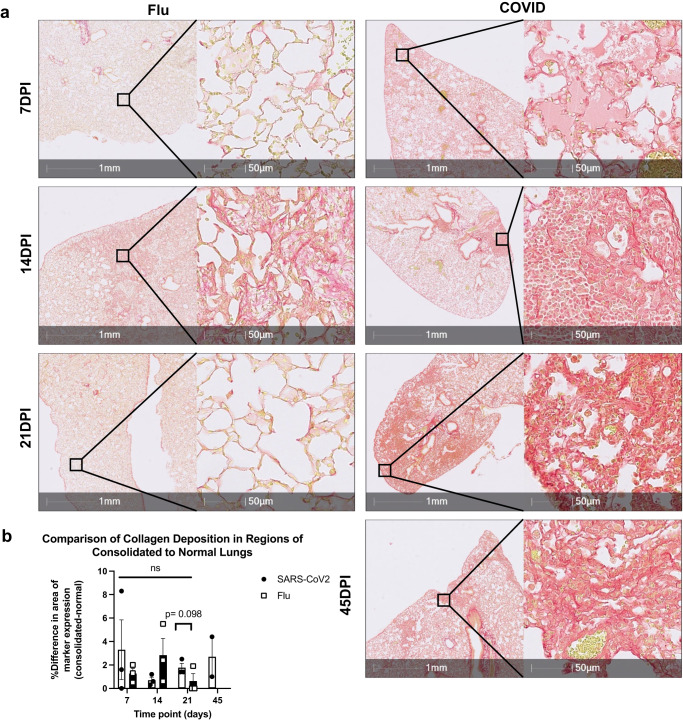
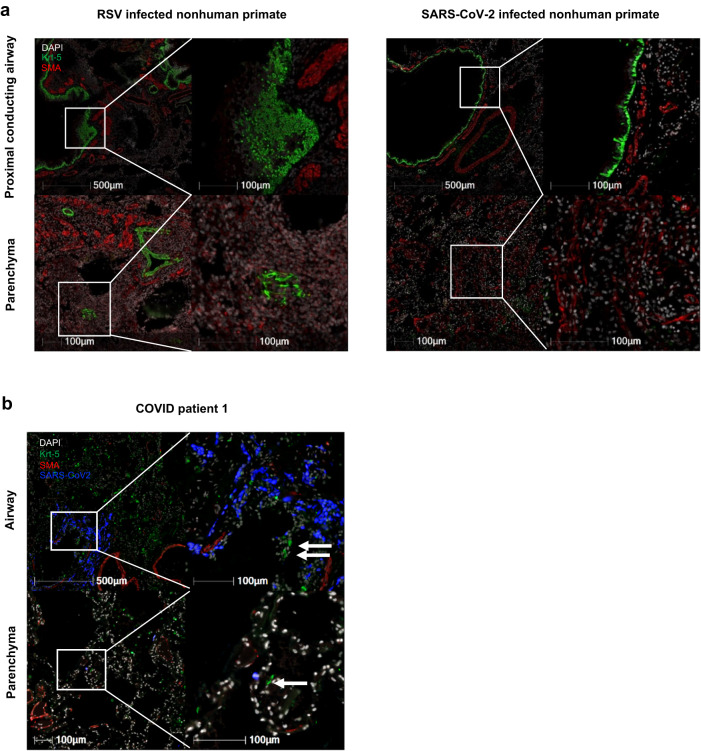
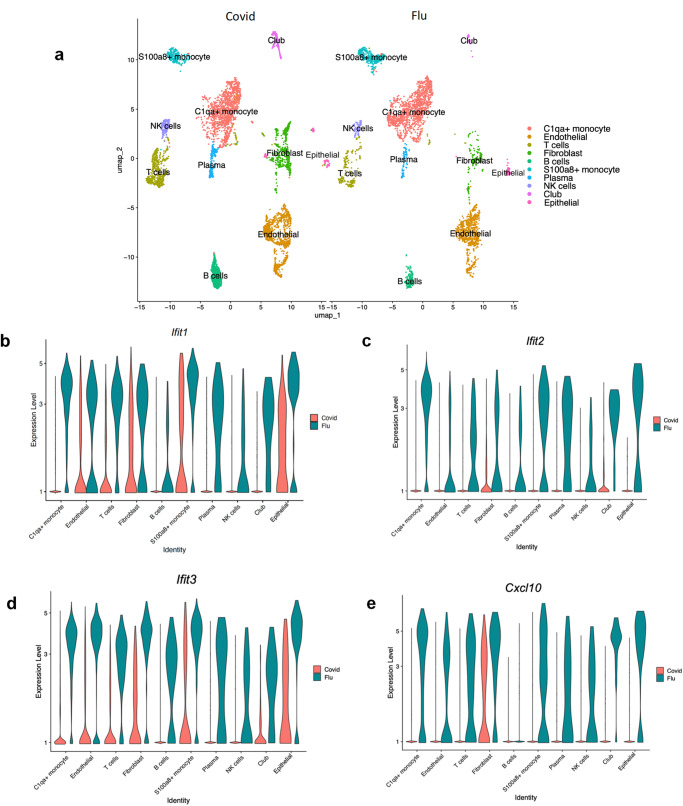
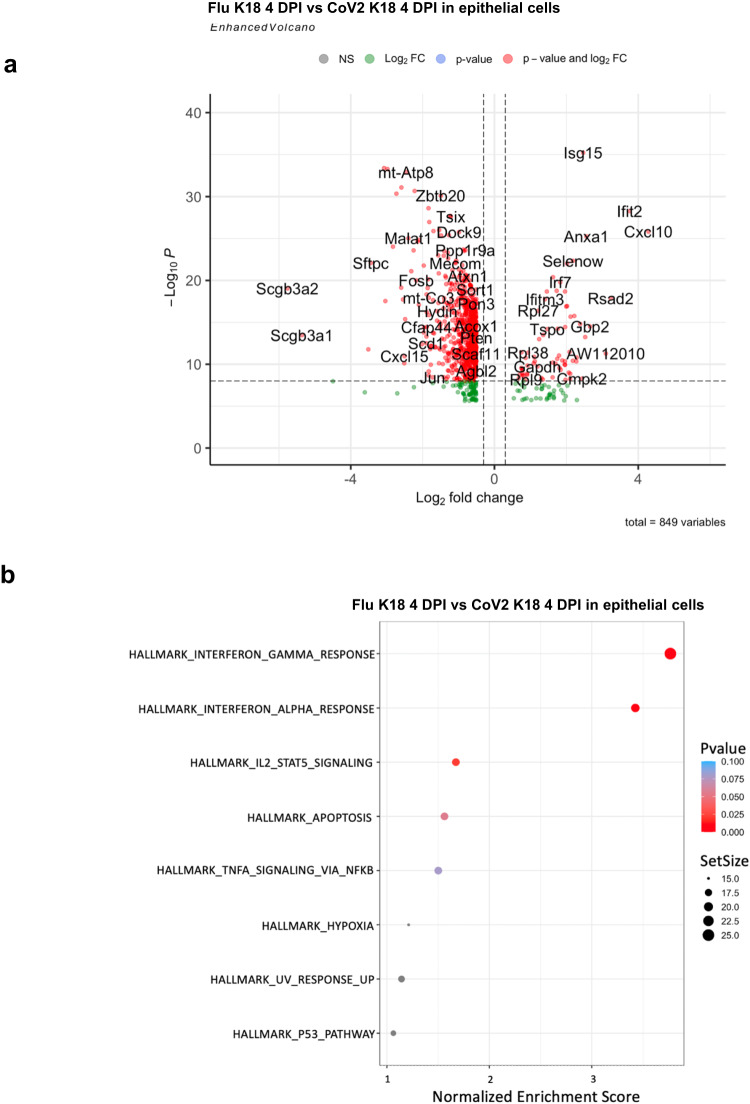
SARS-CoV-2 infection can cause persistent respiratory sequelae. However, the underlying mechanisms remain unclear. Here we report that sub-lethally infected K18-human ACE2 mice show patchy pneumonia associated with histiocytic inflammation and collagen deposition at 21 and 45 days post infection (DPI). Transcriptomic analyses revealed that compared to influenza-infected mice, SARS-CoV-2-infected mice had reduced interferon-gamma/alpha responses at 4 DPI and failed to induce keratin 5 (Krt5) at 6 DPI in lung, a marker of nascent pulmonary progenitor cells. Histologically, influenza- but not SARS-CoV-2-infected mice showed extensive Krt5+ "pods" structure co-stained with stem cell markers Trp63/NGFR proliferated in the pulmonary consolidation area at both 7 and 14 DPI, with regression at 21 DPI. These Krt5+ "pods" structures were not observed in the lungs of SARS-CoV-2-infected humans or nonhuman primates. These results suggest that SARS-CoV-2 infection fails to induce nascent Krt5+ cell proliferation in consolidated regions, leading to incomplete repair of the injured lung.


Conflict of interest statement

The authors declare no competing interests.

Figures

Fig. 1
Fig. 1. K18 mice infected with a sub-lethal dose of SARS-CoV-2 sustain chronic lung injury (n = 3).
a Male and female K18 mice were infected with 1 × 104 TCID50 (n = 3) or 2 × 105 TCID50 (n = 3) of SARS-CoV-2 intranasally and body weight changes were monitored. P < 0.01 vs 2 × 105 TCID50 by two-way ANOVA. Data are presented as mean and individual values. Total viral genomic N mRNA (b) and subgenomic N mRNA (sgmRNA) levels (c) in the lungs and brains of the K18 mice infected with a sub-lethal dose of SARS-CoV-2 (1 × 104 TCID50) and euthanized at 21 days post infection. The level of sgmRNA in the various organs were measured by qRT-PCR. d H&E images of lung sections show persistent, patchy pneumonia in the sub-lethal dose-infected K18 mice at 21 DPI. e, f Representative immunofluorescence staining of CD206 (green) and SARS-CoV-2 spike protein(red) in lungs from sub-lethal SARS-CoV-2 dose-infected K18 mice at 21 DPI. Nuclei are stained with DAPI (white). Staining demonstrates CD206 expression with (arrows) and without (arrowhead) SARS-CoV-2 spike protein. f Quantitative analysis of co-localization of CD206 macrophages and spike protein in the lungs shows the majority of SARS-CoV-2 positive cells in all three animals are CD206+ macrophages based on absolute number and percentage of total SARS-CoV-2 positive cells.
Fig. 2
Fig. 2. Transcriptomic analysis of the lungs of K18 mice infected with SARS-CoV-2 at 21 DPI and without infection, and of K18 mice infected with SARS-CoV-2 at 4 DPI.
Enhanced volcano plot of differentially expressed genes (DEGs) (a) and pathways (c) between sublethal SARS-CoV-2 dose-infected hACE2-K18 (1 × 104 TCID50) lungs (CoV K18 21 DPI) at 21DPI (n = 3) and K18 Naïve mice. Enhanced volcano plot of DEGs (b) and pathways (d) between sublethal dose SARS-CoV-2 infected K18 lungs at 21DPI (CoV K18 21 DPI) and lethal dose SARS-CoV-2-infected K18 lungs (2 × 105 TCID50) at 4DPI (CoV K18 4 DPI).
Fig. 3
Fig. 3. Comparison of gene expressions between Flu and SARS-CoV-2 infected lungs at day 4 and day 6 post infection.
Pulmonary RNA of 2 × 10^5 TCID50 dose-SARS-CoV-2 infected K18-hACE2 mice and Influenza virus (50 PFU) infected B6 mice were collected and sequenced at 4 DPI (n = 3) and 6 DPI (n = 3). Heatmap shows the comparison of (a) Flu day 4 versus K18 naïve and SARS COV2 day 4 versus K18 naïve, gene sorted by Flu day 4 versus K18 naïve b Flu day 6 versus K18 naïve and SARS COV2 day 6 versus naïve K18, gene sorted by SARS COV2 day 6 versus naïve K18. The fold change threshold was 0–9. The top 20 genes were considered to generate all heatmaps. FC; fold change. c, e Enhanced volcano plot of DEGs (a) and pathways (c) between Flu (Flu K18 4 DPI) and SARS-CoV-2 (CoV2 K18 4 DPI) infected lungs at day 4 post infection. d, f Enhanced volcano plot of DEGs (b) and pathways (d) between Flu (Flu K18 6 DPI) and SARS-CoV-2 (CoV2 K18 6 DPI) infected lungs at day 6 post infection.
Fig. 4
Fig. 4. Krt5+ progenitor cell proliferation was induced in Flu infected K18 mice but not in SARS-CoV-2-infected K18 mice at 7, 14, and 21 DPI.
a SMA-Krt5 double staining shows proliferation of Krt5+ cells in consolidated regions of Flu-infected lungs at 7 (n = 3), 14 (n = 4) and 21 DPI (n = 5). In SARS-CoV-2 infected lungs, consolidated pulmonary regions do not exhibit proliferation of Krt5+ cells (red) at 7 (n = 3), 14 (n = 3), or 21 DPI (n = 3). Comparison of the expression of SMA (b) and Krt5 (c) in regions of consolidated and normal lungs from the same animal as detailed in Supplementary Fig. 9. d Number of pulmonary regions with proliferation of Krt5+ cells (“pods”) per lung section. Data are shown as mean ± SEM. To compare values obtained from two groups, two-tailed unpaired Student’s t test was performed. ** indicates p < 0.01. * indicates p < 0.05.
Fig. 5
Fig. 5. Collagen deposited in Flu mouse model and COVID mouse model.
a Representative image of PSR stainings showing collagen deposition in lungs of SARS-CoV-2-infected K18 mice (IN, 1 × 104 TCID50) at 7 (n = 3), 14 (n = 3), 21 (n = 3) and 45 DPI (n = 2) and Flu infected mice at 7 (n = 3), 14 (n = 4) and 21 DPI (n = 3) (50 PFU). b Quantification of collagen deposition in regions of consolidated and normal SARS-CoV-2-infected and Flu-infected lungs as detailed in Supplementary Fig. 7. Data are shown as mean ± SEM. Two-way analysis of variance (ANOVA) was used to compare collagen deposition level changes from 7 DPI to 21–45 DPI. One-tailed unpaired Student’s t test was performed to test the difference between two groups at one time point.
Fig. 6
Fig. 6. No Krt5+ progenitor cells proliferate in CoV2-infected nonhuman primates or human patients.
a Krt5+ progenitor cells (green) are normally identified in the basal layer of proximal conducting airways as seen in the SARS-CoV-2 infected NHP (top right). Following RSV infection in nonhuman primate (n = 1), there is proliferation of Krt5+ cells within airways and the adjacent pulmonary parenchyma which is not observed in SARS-CoV-2-infected nonhuman primates (n = 4). b Adult human COVID patient (patient 1) exhibits a similar reaction pattern to SARS-CoV-2 infected nonhuman primates with Krt5+ cells largely restricted to airways and rarely found within the pulmonary parenchyma.
Fig. 7
Fig. 7. scRNA-seq analysis of Flu-infected and SARS-CoV-2-infected lungs.
a Major clusters and respective cell types for Flu and SARS-CoV-2 tissues at 4 DPI by scRNA-seq data. Uniform manifold approximation and projection (UMAP) for dimension reduction plot with major cell types of scRNA-seq. Single-cell suspensions from whole infected lungs at 4 DPI for both SARS-CoV-2 and Flu were processed and sequenced. The 8146 cells identified after being combined and processed, we identified ten major clusters including C1qa+ monocyte (n = 2,482), Endothelial (n = 1637), T cells (n = 892), Fibroblast (n = 804), S100a8+ monocyte (n = 633), Plasma (n = 280), NK cells (n = 258), Club (n = 220), and Epithelial (n = 207). be Expression of Ifit1, Ifit2, Ifit3, and Cxcl10 in the Fu-infected and SARS-CoV-2-infected lungs.
Fig. 8
Fig. 8. scRNA-seq analysis of Flu-infected and SARS-CoV-2-infected pulmonary epithelial cells.
a Enhanced volcano plot for 4 DPI epithelial cells cluster DE genes. b Significant pathway for 4 DPI Flu-infected versus SARS-CoV-2-infected lungs (epithelial cells cluster).

References

    1. Stewart I, et al. Residual lung abnormalities after COVID-19 hospitalization: interim analysis of the UKILD post–COVID-19 study. Am. J. Respir. Crit. Care Med. 2023;207:693–703. doi: 10.1164/rccm.202203-0564OC. - DOI - PMC - PubMed
    1. George PM, Wells AU, Jenkins RG. Pulmonary fibrosis and COVID-19: the potential role for antifibrotic therapy. Lancet Respir. Med. 2020;8:807–815. doi: 10.1016/S2213-2600(20)30225-3. - DOI - PMC - PubMed
    1. Lerum, T. V. et al. Dyspnoea, lung function and CT findings 3 months after hospital admission for COVID-19. Eur. Respir. J.57, 10.1183/13993003.03448-2020 (2021). - PMC - PubMed
    1. Kashif A, et al. Follow-up of COVID-19 recovered patients with mild disease. Sci. Rep. 2021;11:13414. doi: 10.1038/s41598-021-92717-8. - DOI - PMC - PubMed
    1. Townsend L, et al. Persistent poor health after COVID-19 is not associated with respiratory complications or initial disease severity. Ann. Am. Thorac. Soc. 2021;18:997–1003. doi: 10.1513/AnnalsATS.202009-1175OC. - DOI - PMC - PubMed

Publication types