. 2023 Dec;624(7991):317-332.
doi: 10.1038/s41586-023-06812-z. Epub 2023 Dec 13.

A high-resolution transcriptomic and spatial atlas of cell types in the whole mouse brain

Zizhen Yao  1 Cindy T J van Velthoven  2 Michael Kunst  2 Meng Zhang  3 Delissa McMillen  2 Changkyu Lee  2 Won Jung  3 Jeff Goldy  2 Aliya Abdelhak  2 Matthew Aitken  2 Katherine Baker  2 Pamela Baker  2 Eliza Barkan  2 Darren Bertagnolli  2 Ashwin Bhandiwad  2 Cameron Bielstein  2 Prajal Bishwakarma  2 Jazmin Campos  2 Daniel Carey  2 Tamara Casper  2 Anish Bhaswanth Chakka  2 Rushil Chakrabarty  2 Sakshi Chavan  2 Min Chen  4 Michael Clark  2 Jennie Close  2 Kirsten Crichton  2 Scott Daniel  2 Peter DiValentin  2 Tim Dolbeare  2 Lauren Ellingwood  2 Elysha Fiabane  2 Timothy Fliss  2 James Gee  4 James Gerstenberger  2 Alexandra Glandon  2 Jessica Gloe  2 Joshua Gould  5 James Gray  2 Nathan Guilford  2 Junitta Guzman  2 Daniel Hirschstein  2 Windy Ho  2 Marcus Hooper  2 Mike Huang  2 Madie Hupp  2 Kelly Jin  2 Matthew Kroll  2 Kanan Lathia  2 Arielle Leon  2 Su Li  2 Brian Long  2 Zach Madigan  2 Jessica Malloy  2 Jocelin Malone  2 Zoe Maltzer  2 Naomi Martin  2 Rachel McCue  2 Ryan McGinty  2 Nicholas Mei  2 Jose Melchor  2 Emma Meyerdierks  2 Tyler Mollenkopf  2 Skyler Moonsman  2 Thuc Nghi Nguyen  2 Sven Otto  2 Trangthanh Pham  2 Christine Rimorin  2 Augustin Ruiz  2 Raymond Sanchez  2 Lane Sawyer  2 Nadiya Shapovalova  2 Noah Shepard  2 Cliff Slaughterbeck  2 Josef Sulc  2 Michael Tieu  2 Amy Torkelson  2 Herman Tung  2 Nasmil Valera Cuevas  2 Shane Vance  2 Katherine Wadhwani  2 Katelyn Ward  2 Boaz Levi  2 Colin Farrell  2 Rob Young  2 Brian Staats  2 Ming-Qiang Michael Wang  2 Carol L Thompson  2 Shoaib Mufti  2 Chelsea M Pagan  2 Lauren Kruse  2 Nick Dee  2 Susan M Sunkin  2 Luke Esposito  2 Michael J Hawrylycz  2 Jack Waters  2 Lydia Ng  2 Kimberly Smith  2 Bosiljka Tasic  2 Xiaowei Zhuang  3 Hongkui Zeng  6
Affiliations

A high-resolution transcriptomic and spatial atlas of cell types in the whole mouse brain

Zizhen Yao et al. Nature. 2023 Dec.

Abstract

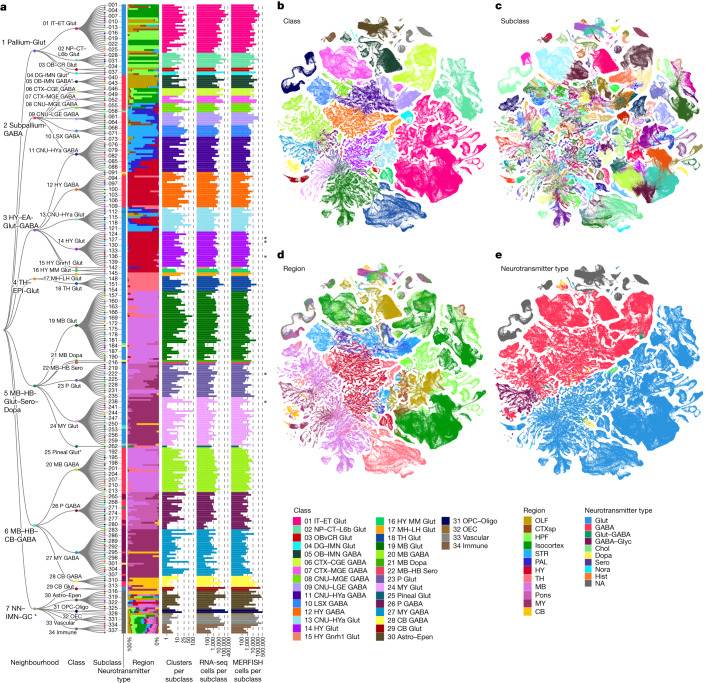
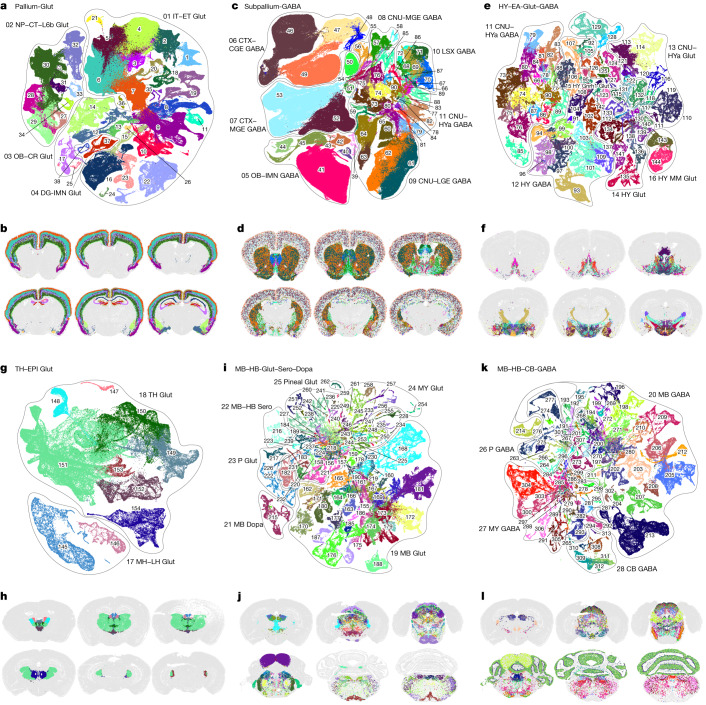
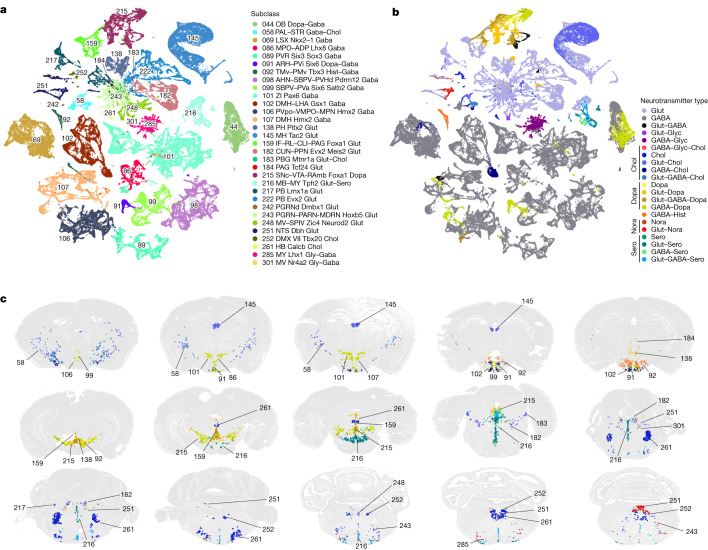
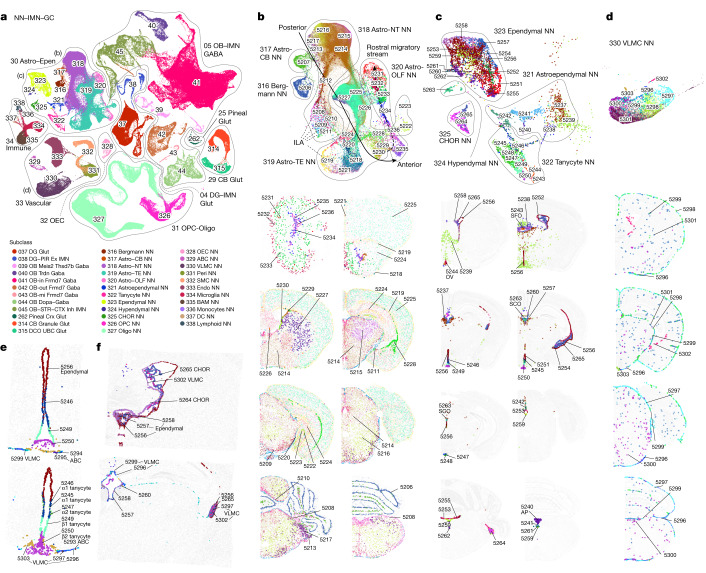
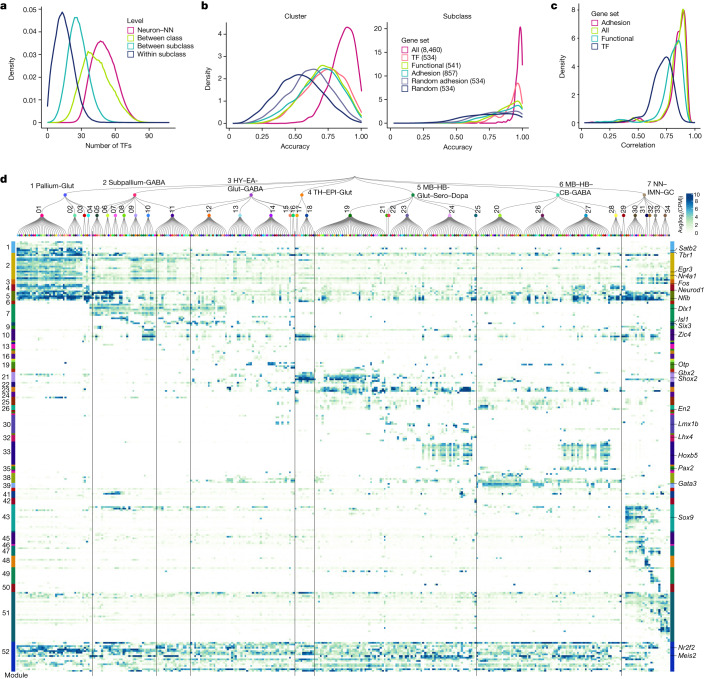
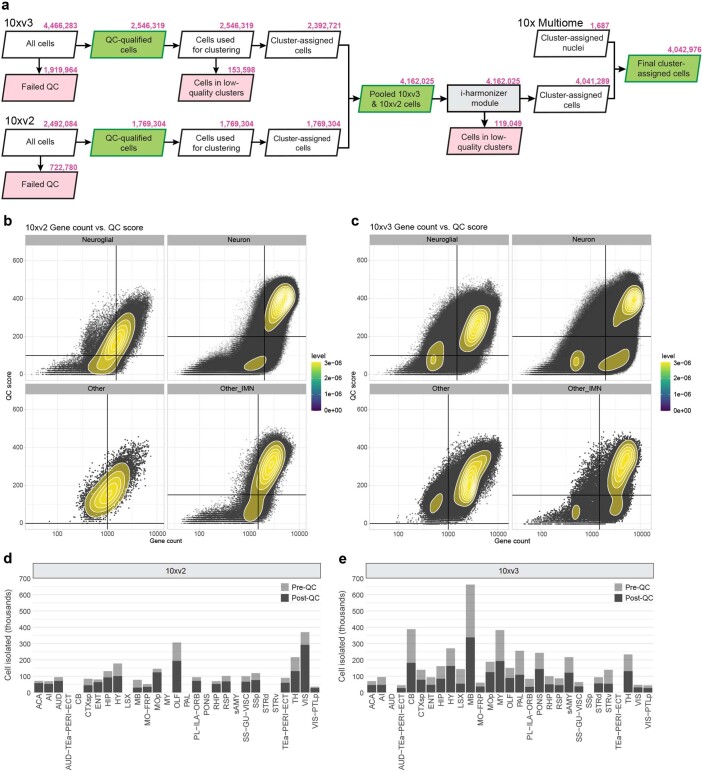
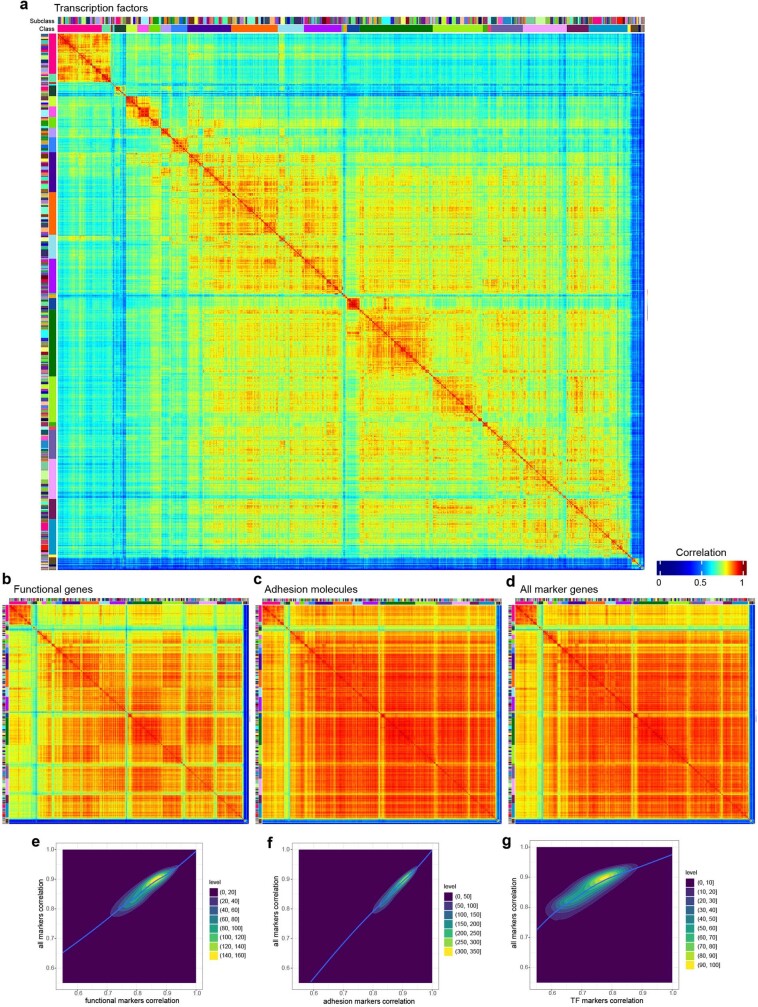
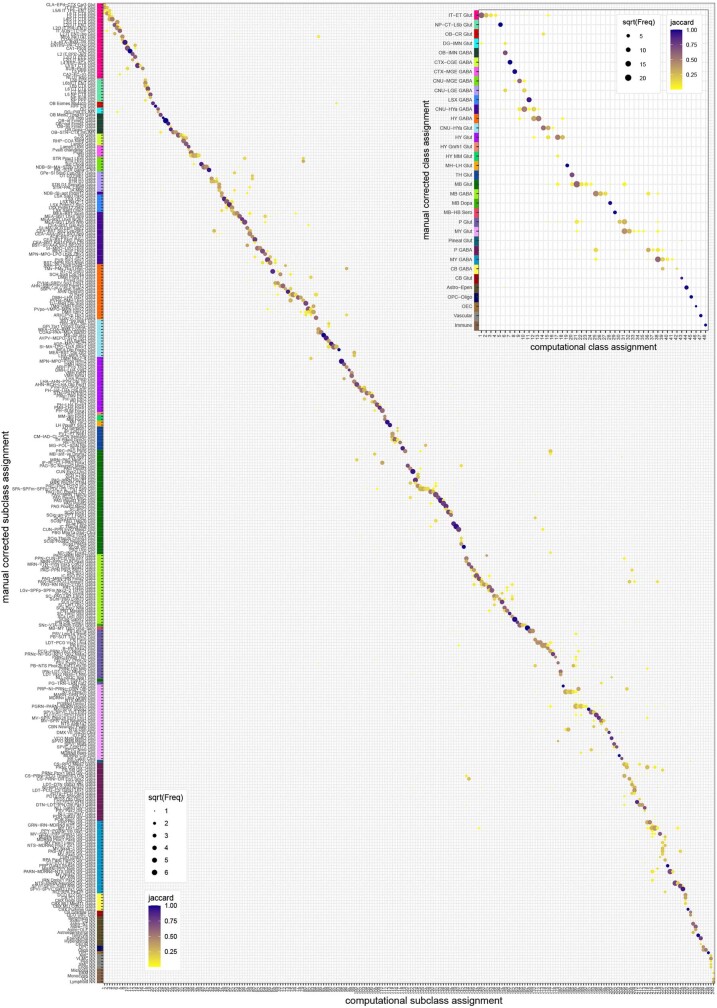
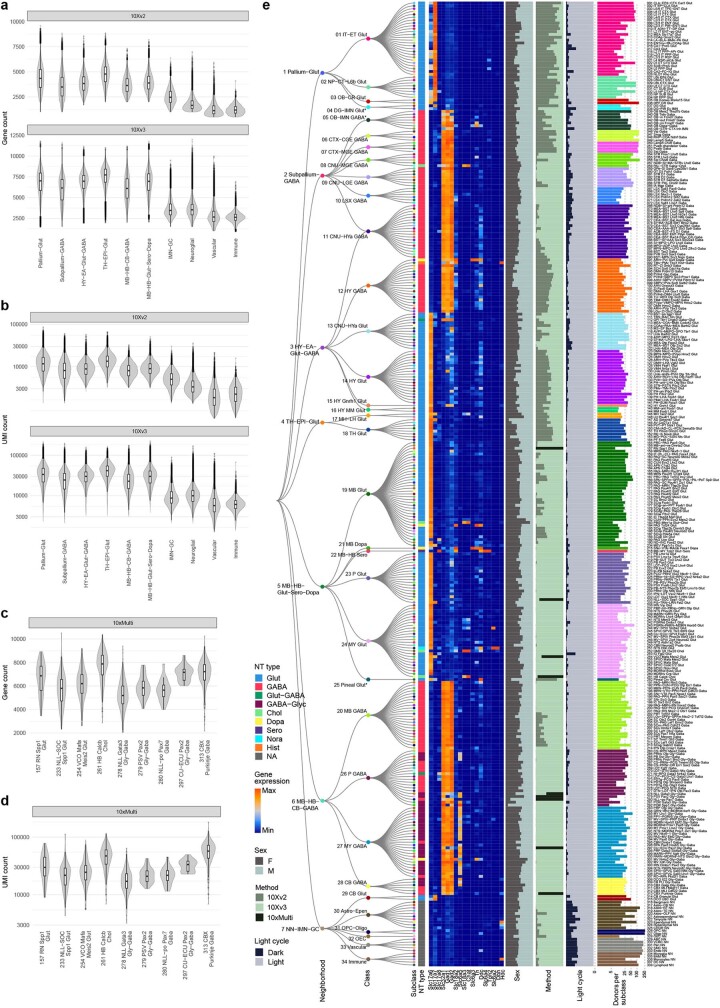
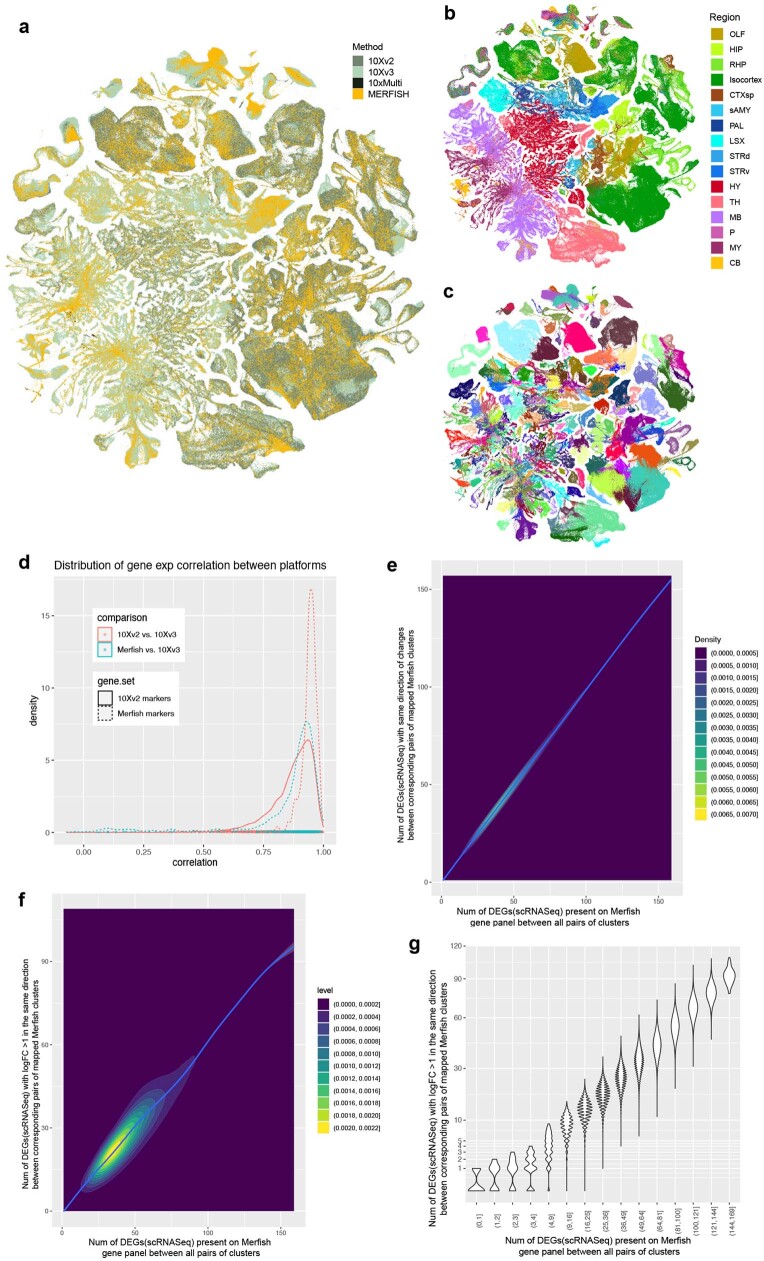
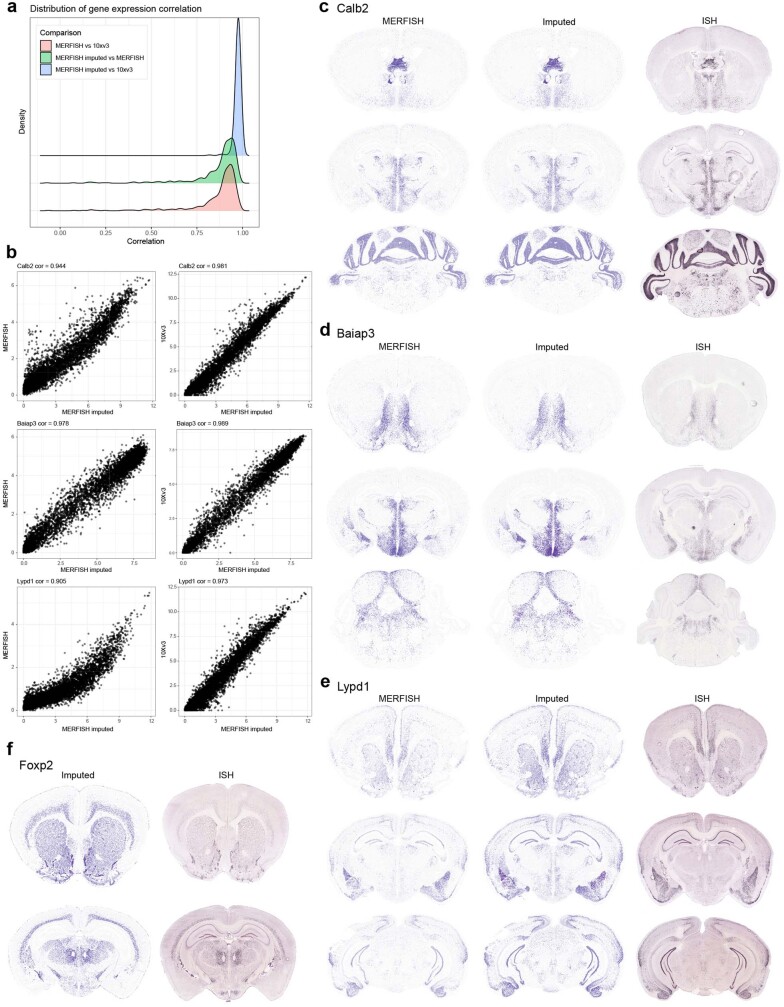
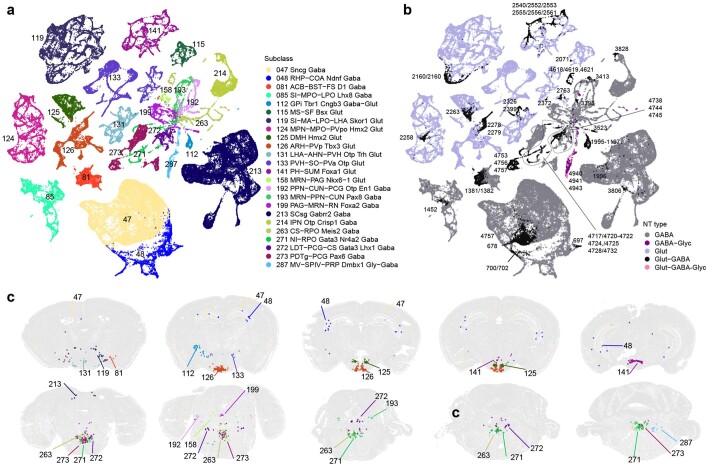
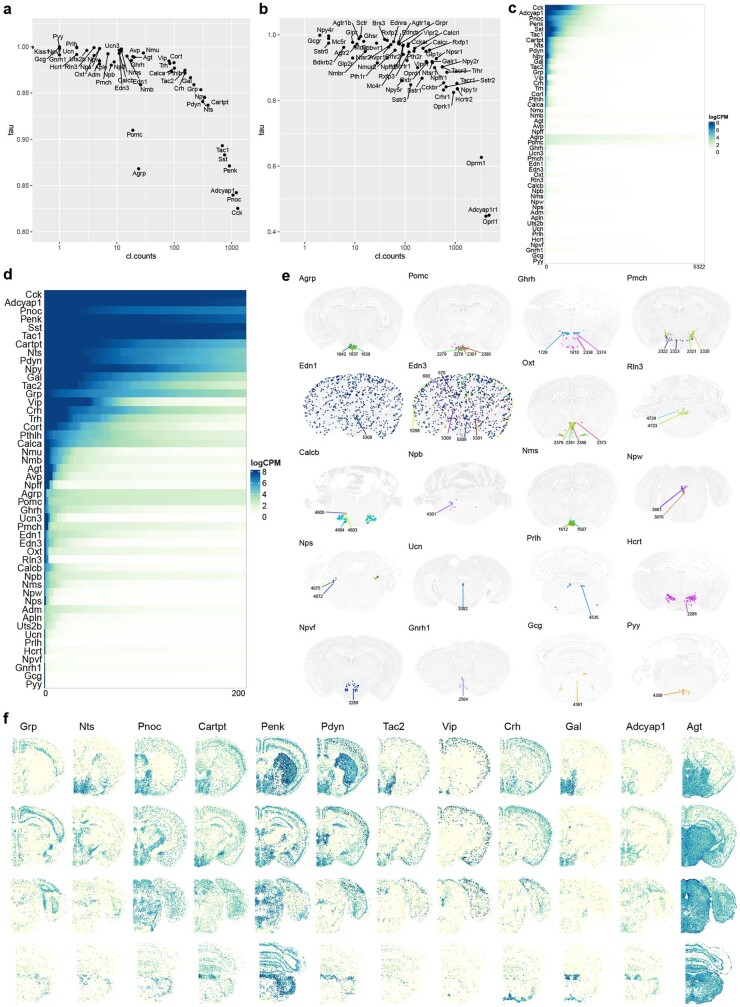
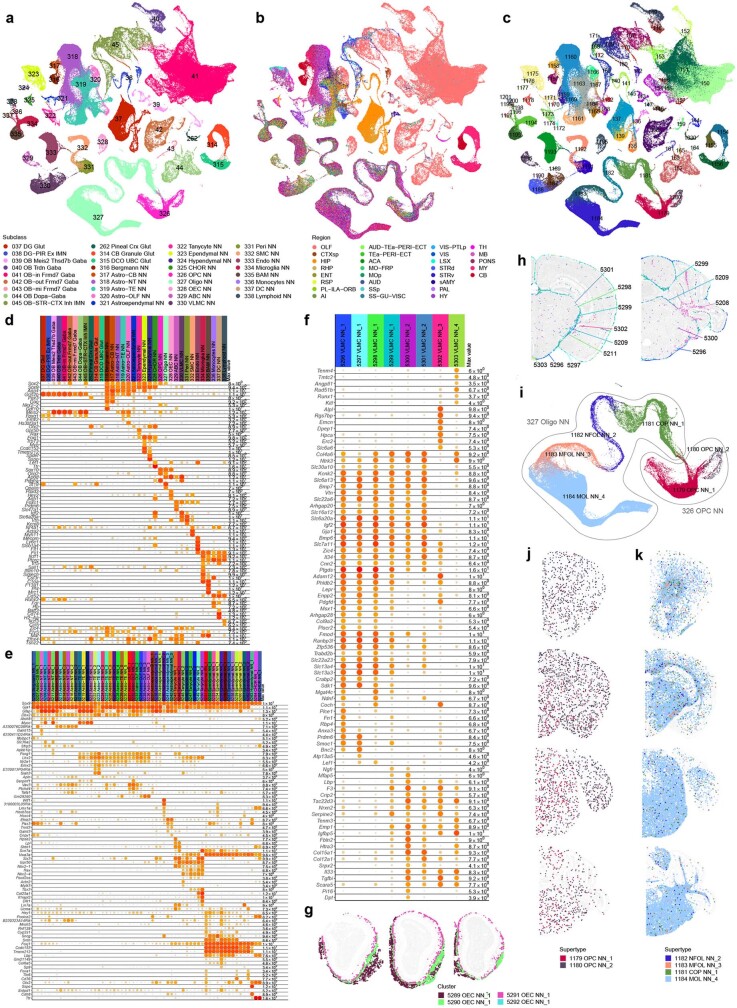
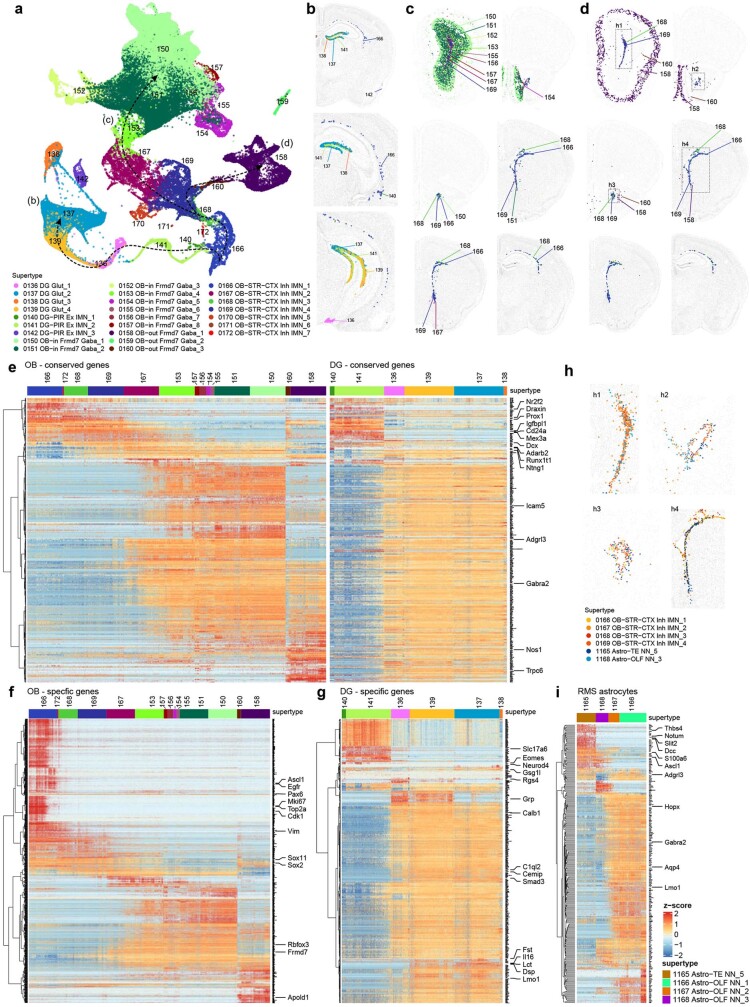
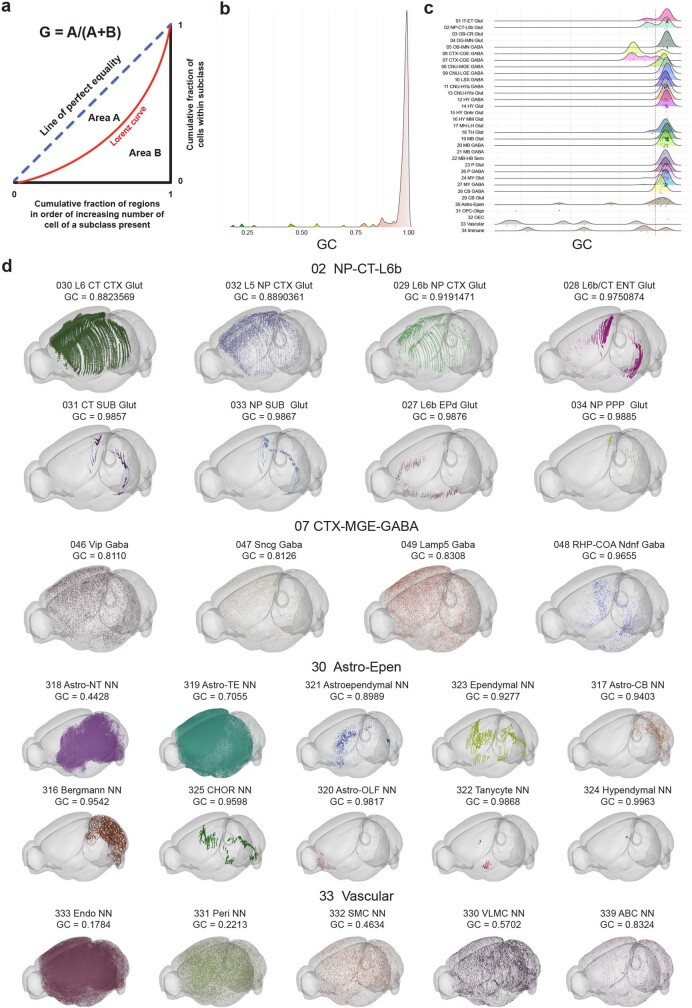
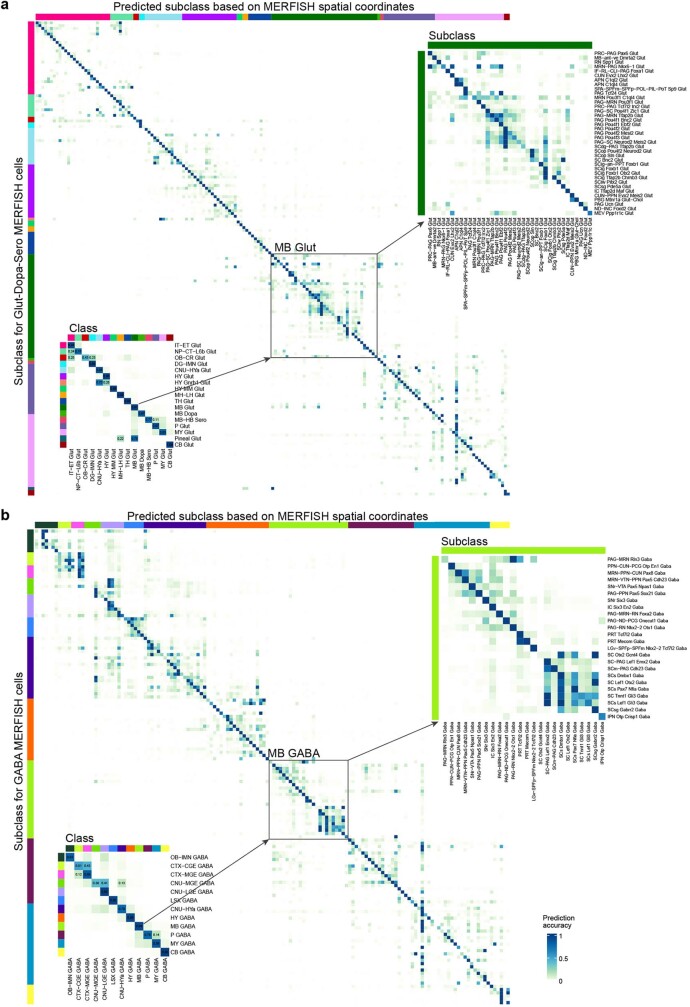
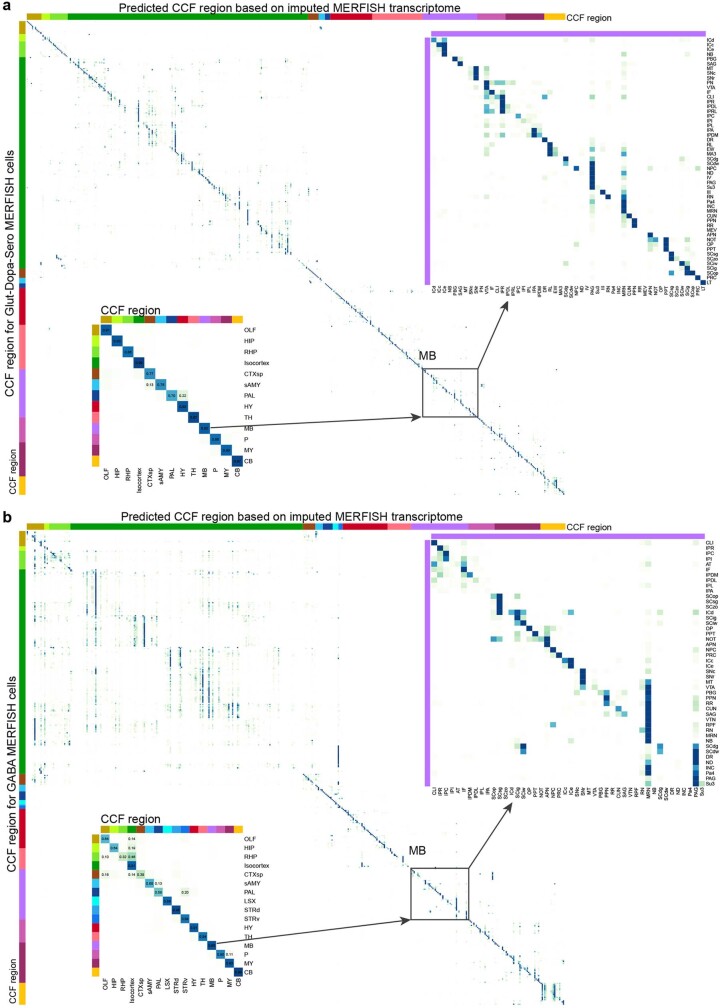
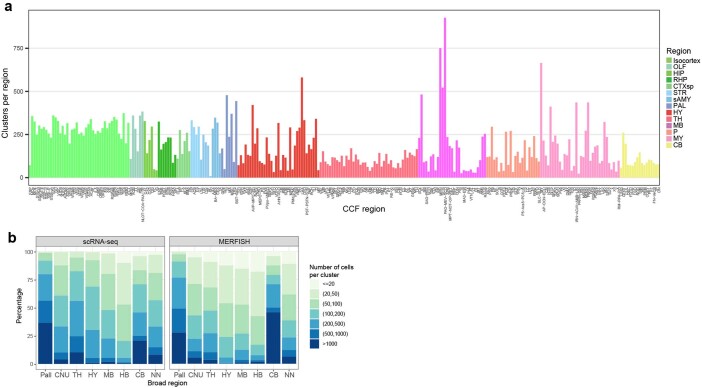
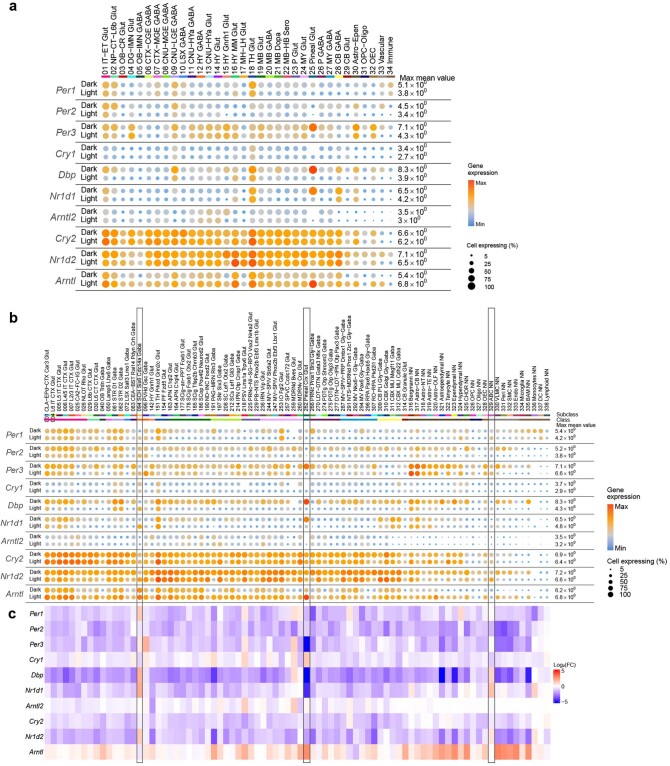
The mammalian brain consists of millions to billions of cells that are organized into many cell types with specific spatial distribution patterns and structural and functional properties1-3. Here we report a comprehensive and high-resolution transcriptomic and spatial cell-type atlas for the whole adult mouse brain. The cell-type atlas was created by combining a single-cell RNA-sequencing (scRNA-seq) dataset of around 7 million cells profiled (approximately 4.0 million cells passing quality control), and a spatial transcriptomic dataset of approximately 4.3 million cells using multiplexed error-robust fluorescence in situ hybridization (MERFISH). The atlas is hierarchically organized into 4 nested levels of classification: 34 classes, 338 subclasses, 1,201 supertypes and 5,322 clusters. We present an online platform, Allen Brain Cell Atlas, to visualize the mouse whole-brain cell-type atlas along with the single-cell RNA-sequencing and MERFISH datasets. We systematically analysed the neuronal and non-neuronal cell types across the brain and identified a high degree of correspondence between transcriptomic identity and spatial specificity for each cell type. The results reveal unique features of cell-type organization in different brain regions-in particular, a dichotomy between the dorsal and ventral parts of the brain. The dorsal part contains relatively fewer yet highly divergent neuronal types, whereas the ventral part contains more numerous neuronal types that are more closely related to each other. Our study also uncovered extraordinary diversity and heterogeneity in neurotransmitter and neuropeptide expression and co-expression patterns in different cell types. Finally, we found that transcription factors are major determinants of cell-type classification and identified a combinatorial transcription factor code that defines cell types across all parts of the brain. The whole mouse brain transcriptomic and spatial cell-type atlas establishes a benchmark reference atlas and a foundational resource for integrative investigations of cellular and circuit function, development and evolution of the mammalian brain.


Conflict of interest statement

H.Z. is on the scientific advisory board of MapLight Therapeutics, Inc. X.Z. is a co-founder of and consultant for Vizgen.

Figures

Fig. 1
Fig. 1. Transcriptomic cell-type taxonomy of the whole mouse brain.
a, Left, the transcriptomic taxonomy tree of 338 subclasses organized in a dendrogram (10xv2: n = 1,699,939 cells; 10xv3: n = 2,341,350 cells; 10x Multiome: n = 1,687 nuclei). The neighbourhood and class levels are marked on the taxonomy tree. Classes marked with asterisks are included in the NN–IMN-GC neighbourhood. The IDs of every third subclass are shown to the right of the dendrogram. Full subclass names are provided in Supplementary Table 7. Following subclass IDs, bar plots represent (left to right): major neurotransmitter type, region distribution of profiled cells, number of clusters per subclass, number of RNA-seq cells analysed per subclass, and number of cells analysed by MERFISH per subclass. Subclasses marked with grey dots contain sex-dominant clusters. Sex-dominant clusters within a subclass are identified by calculating the odds and log P value for male/female distribution per cluster. Clusters with odds < 0.2 and log10(P value) < −10 are considered to be sex-dominant. be, UMAP representation of all cell types coloured by class (b), subclass (c), brain region (d) and major neurotransmitter type (e). Colour schemes for ae are shown in the key at the bottom right of the figure. Astro, astrocyte; CB, cerebellum; CGE, caudal ganglionic eminence; CNU, cerebral nuclei; CR, Cajal–Retzius; CT, corticothalamic; CTX, cerebral cortex; CTXsp, cortical subplate; DG, dentate gyrus; EA, extended amygdala; Epen, ependymal; EPI, epithalamus; ET, extratelencephalic; GC, granule cell; HB, hindbrain; HPF, hippocampal formation; HY, hypothalamus; HYa, anterior hypothalamic; IMN, immature neurons; IT, intratelencephalic; L6b, layer 6b; LGE, lateral ganglionic eminence; LH, lateral habenula; LSX, lateral septal complex; MB, midbrain; MGE, medial ganglionic eminence; MH, medial habenula; MM, medial mammillary nucleus; MY, medulla; NN, non-neuronal; NP, near-projecting; OB, olfactory bulb; OEC, olfactory ensheathing cells; OLF, olfactory areas; Oligo, oligodendrocytes; OPC, oligodendrocyte precursor cells; P, pons; PAL, pallidum; STR, striatum; TH, thalamus. Neurotransmitter types: Chol, cholinergic; Dopa, dopaminergic; GABA, GABAergic; Glut, glutamatergic; Glyc, glycinergic; Hist, histaminergic; Nora, noradrenergic; Sero, serotonergic; NA, not applicable (no neurotransmitter detected).
Fig. 2
Fig. 2. Neuronal cell-type classification and distribution across the brain.
al, UMAP representation (a,c,e,g,i,k) and representative MERFISH sections (b,d,f,h,j,l) of Pallium-Glut (a,b), Subpallium-GABA (c,d), HY–EA-Glut–GABA (e,f), TH–EPI-Glut (g,h), MB–HB-Glut–Sero–Dopa (i,j) and MB–HB–CB-GABA (k,l) neighbourhoods coloured by subclass. Each subclass is labelled with its ID and shown in the same colour in UMAP representations and MERFISH sections. a,c,e,g,i,k, Outlines in UMAP representations show cell classes. For full subclass names, see Supplementary Table 7.
Fig. 3
Fig. 3. Modulatory neurotransmitter types and their distribution throughout the brain.
a,b, Neuronal subclasses containing clusters that release modulatory neurotransmitters and their various co-release combinations with glutamate and/or GABA. UMAPs are coloured by subclass (a) and neurotransmitter type (b). c, Representative MERFISH sections showing the location of neuronal types expressing modulatory neurotransmitters. Cells are coloured by neurotransmitter type and labelled by subclass ID. See Supplementary Table 7 for detailed neurotransmitter assignment for each cluster. ADP, anterodorsal preoptic nucleus; AHN, anterior hypothalamic nucleus; ARH, arcuate hypothalamic nucleus; CLI, central linear nucleus raphe; CUN, cuneiform nucleus; DMH, dorsomedial nucleus of the hypothalamus; DMX, dorsal motor nucleus of the vagus nerve; IF, interfascicular nucleus raphe; LHA, lateral hypothalamic area; MDRN, medullary reticular nucleus; MPN, medial preoptic nucleus; MPO, medial preoptic area; MV, medial vestibular nucleus; NTS, nucleus of the solitary tract; PAG, periaqueductal grey; PARN, parvicellular reticular nucleus; PB, parabrachial nucleus; PBG, parabigeminal nucleus; PGRN, paragigantocellular reticular nucleus; PGRNd, paragigantocellular reticular nucleus, dorsal part; PH, posterior hypothalamic nucleus; PMv, ventral premammillary nucleus; PPN, pedunculopontine nucleus; PVa, periventricular hypothalamic nucleus, anterior part; PVHd, paraventricular hypothalamic nucleus, descending division; PVi, periventricular hypothalamic nucleus, intermediate part; PVpo, periventricular hypothalamic nucleus, preoptic part; PVR, periventricular region; RAmb, midbrain raphe nuclei; RL, rostral linear nucleus raphe; SBPV, subparaventricular zone; SNc, substantia nigra, compact part; SPIV, spinal vestibular nucleus; TMv, tuberomammillary nucleus, ventral part; VII, facial motor nucleus; VMPO, ventromedial preoptic nucleus; VTA, ventral tegmental area; ZI, zona incerta.
Fig. 4
Fig. 4. Non-neuronal cell types and immature neuronal types.
a, UMAP representation of the NN–IMN–GC neighbourhood coloured by subclass. Outlines show cell classes. bd, Three subpopulations indicated in a are highlighted and further investigated: astrocytes (b), ependymal cells (c) and VLMCs (d). UMAP representation and representative MERFISH sections of astrocytes (b), ependymal cells (c) and VLMCs (d) are coloured and numbered by cluster. b,c, Outlines in UMAPs show subclasses. e, Colocalization of tanycyte, ependymal cell and VLMC clusters around V3 and ME, as shown in selected MERFISH sections. f, Colocalization of VLMC, CHOR and ependymal cell clusters in various ventricles, as shown in selected MERFISH sections. ABC, arachnoid barrier cells; BAM, border-associated macrophages; CHOR, choroid plexus; DC, dendritic cells; DCO, dorsal cochlear nucleus; Endo, endothelial cells; NT, non-telencephalon; Peri, pericytes; PIR, piriform cortex; SMC, smooth muscle cells; TE, telencephalon; UBC, unipolar brush cells; VLMC, vascular leptomeningeal cells.
Fig. 5
Fig. 5. Transcription factor modules across the whole mouse brain.
a, Distribution of the number of differentially expressed transcription factors (TFs) between neuronal and non-neuronal classes, between classes, between subclasses, and within subclasses. b, Cross-validation accuracy for each cluster (left) or subclass (right) using classifiers built based on all 8,460 marker genes (all), 534 transcription factor marker genes (TF), 541 functional marker genes, 857 marker genes encoding adhesion molecules (adhesion), 534 randomly selected adhesion marker genes (random adhesion), or 534 randomly selected marker genes (random). c, Density plot showing distribution of correlation of marker gene expression between clusters using all markers, adhesion marker genes, functional genes and transcription factors. Correlation values are derived from full correlation matrices shown in Extended Data Fig. 3. d, Expression of key transcription factors for each subclass in the taxonomy tree, organized in transcription factor co-expression modules shown as colour bars on both sides of the heat map. Module IDs are shown on the left, exemplary transcription factor genes are shown on the right. For a full list of transcription factor genes in each module (in the same order as in this heat map), see Supplementary Table 8. Avg, mean. Source Data
Fig. 6
Fig. 6. Brain region-specific features of cell types.
a, Heat map showing the CCFv3 region distribution (y axis) in each subclass (x axis) for MERFISH cells. Bar graphs on the left show the broad CCFv3 regions, proportion of neuronal versus glial cells per region of interest (ROI), and proportion of neurotransmitter types per ROI. Bar graphs on the right show broad CCFv3 regions, Shannon diversity per subclass and supertype, and number of cells per ROI. Bar graphs on the top show number of cells per subclass, Gini coefficient and class assignment. Bar graphs on the bottom show subclass and class annotations. b, Scatter plot showing the number of neuronal clusters identified per major brain region versus the number of neuronal cells profiled by scRNA-seq in the corresponding region. Each neuronal cluster is assigned to the most dominant region. c, As in b, except numbers of clusters and profiled cells are normalized by the region volume. d, Distribution of the number of DEGs (identified in scRNA-seq data) between every pair of neuronal clusters within each major brain region, split into indicated quantiles. The curves show the spread of the number of DEGs between more similar types at 0.1 quantile versus the more distinct types at 0.9 quantile. e, Scatter plot showing the number of cells mapped to a given neuronal cluster versus the span (as measured by IQR) of their 3D coordinates along the anteroposterior, dorsoventral and mediolateral axes based on the MERFISH dataset, stratified by the major brain regions. Note that both axes are in log scales. The plot shows how localized the clusters are within each region along each spatial axis. IQR, inter-quantile range (the difference between 75% quantile and 25% quantile). Pall, pallium. Source Data
Extended Data Fig. 1
Extended Data Fig. 1. scRNA-seq data analysis workflow.
(a) Number of cells at each step in the scRNA-seq data analysis pipeline. The identification of doublets and low-quality clusters is described in more detail in Methods. The 10xv2 and 10xv3 data were first QC-ed and analyzed separately. After initial clustering the datasets were combined and QC-ed again before and after joint clustering. 10x Multiome snRNA-seq data was added to fill in gaps that were identified after joint clustering of 10xv2 and 10xv3 scRNA-seq data. (b-c) Gene count and qc score thresholds used for each of the four major cell populations (neuroglial cells, neurons, immature neurons and granule cells, and other) on the 10xv2 (b) and 10xv3 (c) datasets. (d-e) Number of cells isolated from dissection ROIs (pre-QC) and number of cells passing QC (post-QC) for 10xv2 (d) and 10xv3 (e) datasets. We didn’t profile LSX, STR, sAMY, PAL, Pons, MY, and CB by 10xv2. Some regions were collected using different dissections between 10xv2 and 10xv3, but all regions were covered by 10xv3.
Extended Data Fig. 2
Extended Data Fig. 2. MERFISH data generation, data processing and summary of results.
(a) Workflow for generating and processing MERFISH data. (b) Correlation of gene detection between MERFISH and bulk RNA-sequencing for four different brain regions. (c) Histogram displaying the distribution of gene detection correlation between adjacent MERFISH sections. (d-f) Violin plots displaying distribution of cell volumes (d), gene detection (e), and mRNA molecule detection (f) for individual sections ordered from anterior to posterior (left panel) or cumulative distribution for the whole brain (right panel). Red dashed lines indicate cutoff for filtering. (g) Cumulative histogram showing the relative contribution of each subclass to each section ordered from anterior to posterior. (h) Heatmap showing the proportion of cells per region for each subclass in the MERFISH data (left) and scRNA-seq data (right). The heatmap in the middle shows the correlation between region distribution of MERFISH and scRNA-seq data.
Extended Data Fig. 3
Extended Data Fig. 3. Marker gene expression correlation matrices showing relatedness among cell types.
(a-d) Heatmaps showing pairwise Pearson correlation of gene expression levels for each pair of clusters using marker gene sets of 534 transcription factors (a), 541 functional genes (including neuropeptides, GPCRs, ion channels, transporters, etc.) (b), 857 adhesion molecules (c), and all 8,460 marker genes (d). Correlations were computed using 10xv3 scRNA-seq data only except for the 31 nuclei-dominated clusters where 10xMulti snRNA-seq data were used. (e-g) All marker gene expression correlation between clusters compared to correlation between clusters of expression of functional marker genes (e), adhesion marker genes (f), and transcription factor (TF) marker genes (g). Correlation values are derived from a-d.
Extended Data Fig. 4
Extended Data Fig. 4. Comparison of the initial automated computational assignment of classes and subclasses with the manually revised, final assignment of classes and subclasses.
Size of the dot corresponds to the number of overlapping cells (frequency) in corresponding classes or subclasses, and color represents the Jaccard similarity between corresponding classes or subclasses.
Extended Data Fig. 5
Extended Data Fig. 5. Transcriptomic cell type taxonomy of the whole mouse brain with additional metadata information.
(a-b) Number of genes (a) or number of UMIs (b) detected per cell in 10xv2 (top) or 10xv3 (bottom) datasets for each cell type neighborhood. The data shown is post-QC. Numbers of cells for 10xv2: Pallium-Glut n = 1,128,664, Subpallium-GABA n = 269,307, HY-EA-Glut-GABA n = 107,706, TH-EPI-Glut n = 73,702, MB-HB-CB-GABA n = 18,590, MB-HB-Glut-Sero-Dopa n = 20,089, IMN-GC n = 123,650, Neuroglial n = 80,959, Vascular n = 6,894, Immune n = 4,941. Numbers of cells for 10xv3: Pallium-Glut n = 366,137, Subpallium-GABA n = 342,116, HY-EA-Glut-GABA n = 187,742, TH-EPI-Glut n = 52,469, MB-HB-CB-GABA n = 167,425, MB-HB-Glut-Sero-Dopa n = 159,653, IMN-GC n = 209,310, Neuroglial n = 774,537, Vascular n = 130,599, Immune n = 87,639. (c-d) Number of genes (c) or number of UMIs (d) detected per nucleus in the 10xMulti dataset (post-QC) for each subclass where 10xMulti nuclei were added. Numbers of nuclei: 157 RN Spp1 Glut n = 48, 233 NLL-SOC Spp1 Glut n = 115, 254 VCO Mafa Meis2 Glut n = 490, 261 HB Calcb Chol n = 274, 278 NLL Gata3 Gly-Gaba n = 339, 279 PSV Pax2 Gly-Gaba n = 43, 280 NLL-po Pax7 Gaba n = 17, 297 CU-ECU Pax2 Gly-Gaba n = 15, 313 CBX Purkinje Gaba n = 346. All box plots include the median line, the box denotes the interquartile range (IQR), whiskers denote the rest of the data distribution, and outliers are denoted by points greater than ± 1.5× IQR. (e) The transcriptomic taxonomy tree of 338 subclasses organized in a dendrogram (same as Fig. 1a). From left to right, the bar plots represent neurotransmitter (NT) type assignment, heat map showing expression of major neurotransmitter marker genes, sex distribution, platform distribution, light-dark distribution of profiled cells, and number of donors that contributed to each subclass.
Extended Data Fig. 6
Extended Data Fig. 6. Constellation plot of the global relatedness between subclasses.
Each subclass is represented by a disk, labeled by the subclass ID and positioned at the subclass centroid in UMAP coordinates shown in Fig. 1c. The size of the disk corresponds to the number of cells within each subclass, and the edge weights correspond to the fraction of shared neighbors (see Methods) between subclasses. Each subclass is colored by the class it belongs to. Curved outlines drawn around subclasses show the major neighborhoods. Source Data
Extended Data Fig. 7
Extended Data Fig. 7. Validation of data integration across 10xv2, 10xv3, and MERFISH datasets.
(a-c) UMAP representation of all cell types colored by profiling platform (a), region (b), and subclass (c). Other than the regions only profiled by 10xv3 (LSX, STR, sAMY, PAL, Pons, MY), the cells from both 10xv2 and 10xv3 platforms integrate very well. Cell types in isocortex and HPF have a lot more 10xv2 cells, consistent with our sampling plan. For cell types/clusters containing many cells, we observed separation of 10xv2 and 10xv3 data in the UMAP space, but not at the cluster level. (d) Correlation of gene expression between 10xv2 and 10xv3 and between 10xv3 and MERFISH. For each gene, we computed the Pearson correlation of its average expression in each cluster across clusters between 10xv2 and 10xv3, and the correlation between 10xv3 and MERFISH. For 10xv3 and MERFISH comparison, distribution of the correlation values of all 500 genes in the MERFISH panel is shown. For 10xv3 and 10xv2 comparison, we show the correlation of 5383 marker genes based on 10xv2, and 466 10xv2 marker genes that are also present on the MERFISH gene panel (the other 34 MERFISH genes not shown have low expression in 10xv2 clusters). We manually inspected several genes with poor correlation and found them to have poor gene annotation or show relatively small variations across clusters. Most genes with low correlations between 10xv3 and MERFISH data are *Rik genes that are more likely to be poorly annotated, and the MERFISH probes selected for them might not work well. (e) 2D density plot showing on the X-axis the number of DEGs (based on 10xv3 dataset) present on the MERFISH gene panel between all pairs of clusters, and on the Y-axis the number of such DEGs showing the same direction of changes between corresponding pairs of mapped MERFISH clusters. Almost all the DEGs between all pairs of clusters show the same direction of changes between 10xv3 and MERFISH. (f) 2D density plot showing on the X-axis the number of DEGs (based on 10xv3 dataset) present on the MERFISH gene panel between all pairs of clusters, and on the Y-axis the number of such DEGs showing the same direction of changes, and |log2(FC)| > 1 between corresponding pairs of mapped MERFISH clusters. About 60% of DEGs between all pairs of clusters based on 10xv3 show significant fold change (FC) in MERFISH. (g) Similar analysis as in (f) but shown as violin plot by binning the number of 10xv3 DEGs present on the MERFISH gene panel on the X-axis, with better resolution on closely related pairs with four or fewer DEGs present on MERFISH gene panels. The MERFISH dataset can resolve the vast majority of clusters due to strong correlation of DEG expression between 10xv3 and MERFISH clusters. On the other hand, a few hundred pairs of clusters with fewer than two DEGs on the MERFISH gene panel remain unresolvable in the MERFISH data, and they are usually sibling clusters with indistinguishable spatial distribution. Source Data
Extended Data Fig. 8
Extended Data Fig. 8. Validation of gene expression patterns of scRNA-seq transcriptomes imputed into MERFISH space.
(a) Correlation of expression for all 500 genes in the MERFISH panel between MERFISH and 10xv3 (red), imputed MERFISH and MERFISH (green), and imputed MERFISH and 10xv3 (blue). To test the accuracy of MERFISH imputation, one gene is excluded from the gene panel at a time from KNN computation at all levels and its imputed gene expression is compared with its original gene expression. The distribution of correlations between imputed expression and the original MERFISH expression or the reference 10xv3 expression is shown for each gene at the cluster level. (b) Scatterplots showing the correlation between imputed MERFISH gene expression vs. MERFISH gene expression (left panels) and imputed MERFISH gene expression vs. 10xv3 gene expression (right panels) for selected genes, Calb2 (top row), Baiap3 (middle row), and Lypd1 (bottom row). (c-e) Examples of spatial gene expression patterns from MERFISH data (left panels), imputed MERFISH data (middle panels), and images from the Allen in situ hybridization (ISH) atlas (right panels) for select genes, Calb2 (c), Baiap3 (d), and Lypd1 (e). (f) Representative MERFISH sections showing imputed expression of Foxp2 (which was not directly profiled by MERFISH) and Allen ISH images. ISH image credit: Allen Institute for Brain Science, https://mouse.brain-map.org/. Source Data
Extended Data Fig. 9
Extended Data Fig. 9. Distribution of glutamate-GABA dual transmitting cell types throughout the brain.
(a-b) Neuronal subclasses containing clusters releasing glutamate-GABA dual transmitters. UMAPs are colored by subclass (a) and neurotransmitter type (b). Glutamate-GABA co-releasing clusters are labeled by cluster ID in panel (b). (c) MERFISH sections showing glutamate-GABA co-releasing clusters colored by the subclass to which they belong. See Supplementary Table 7 for detailed neurotransmitter assignment for each cluster.
Extended Data Fig. 10
Extended Data Fig. 10. Neuropeptide distribution across the whole mouse brain.
(a) Scatter plot of Tau score over the number of clusters each neuropeptide is expressed in at the level of log2(CPM) > 3. The Tau score is a measurement of cell type specificity, which varies from 0 to 1 where 0 means uniformly expressed and 1 means highly specific to one type. (b) Scatter plot of Tau score over the number of clusters each peptide-liganded G-protein coupled receptor (GPCR) gene is expressed in at the level of log2(CPM) > 3. (c) Expression level of neuropeptide in log2(CPM) per cluster. For each neuropeptide along the Y axis, clusters are sorted from the highest to lowest mean gene expression level along the X axis. (d) Expression level of neuropeptide in log2(CPM) per cluster. For each neuropeptide along the Y axis, clusters are sorted from the highest to lowest mean gene expression level along the X axis. For each gene, only the top 200 highest-expressing clusters out of 5,322 clusters are shown. (e) Representative MERFISH sections highlighting the spatial location of clusters expressing each of the 20 highly cell-type-specific neuropeptide genes (expressed in 8 or fewer clusters). (f) Representative MERFISH sections showing the expression of the neuropeptides present on the MERFISH gene panel that are widely expressed. We also note that the relationships between mRNA levels, the post-translationally processed peptide levels, and the functional levels are unknown for most neuropeptides, thus, it is difficult to predict what mRNA levels would lead to sufficient functional expression of a given neuropeptide.
Extended Data Fig. 11
Extended Data Fig. 11. Additional non-neuronal UMAPs and marker genes.
(a-c) UMAP representation of the NN-IMN-GC neighborhood colored by subclass (a), region (b), and supertype (c). (d) Dot plot showing marker gene expression in non-neuronal subclasses. Dot size and color indicate proportion of expressing cells and average expression level in each subclass, respectively. (e) Dot plot showing marker gene expression in all clusters in the Astro-Epen class. Dot size and color indicate proportion of expressing cells and average expression level in each cluster, respectively. (f) Dot plot showing marker gene expression in VLMC clusters. Dot size and color indicate proportion of expressing cells and average expression level in each cluster, respectively. (g) Representative MERFISH sections showing the spatial gradient of OEC clusters. (h) Co-localization of VLMCs with interlaminar astrocytes (ILA) as shown in selected MERFISH sections. (i) UMAP representation of OPCs and oligodendrocytes colored and labeled by supertype. (j-k) Representative MERFISH sections showing the spatial distribution of OPC (j) and Oligo (k) supertypes.
Extended Data Fig. 12
Extended Data Fig. 12. Gene expression patterns in immature neuronal populations and RMS astrocytes.
(a) UMAP representation of immature neuron populations colored by supertype. Maturation trajectories in dentate gyrus (DG) (b), inner olfactory bulb (c), and outer olfactory bulb (d) are highlighted. (b-d) Representative MERFISH sections showing location of immature neuronal supertypes from the three trajectories shown in (a). (e-g) Heatmap showing gene expression changes as immature neurons transition to mature cell types, conserved between OB (left) and DG (right) cell type development (e), specific to OB cell types (f), and specific to DG cell types (g). Key marker genes at each stage of development are highlighted. It seems, however, that the scRNA-seq data might not have captured all cell states along the DG maturation trajectory based on the gaps between clusters in the UMAP and absence of expression for genes like Ascl1, Pax6, Top2a, and Mki67 along the DG trajectory. Various studies have tried to capture the transitional states between neural stem and neuronal progenitor cells in the DG with most making use of transgenic mice to isolate specific states,. (h) MERFISH sections showing the co-localization of immature neurons and astrocytes in the rostral migratory stream (RMS). The dashed boxes in (d) show the location of the highlighted regions in (h). (i) Heatmap showing gene expression changes in astrocytes associated with the RMS from SVZ to OB. Highlighted genes are conserved between the RMS-associated astrocytes and the OB trajectory.
Extended Data Fig. 13
Extended Data Fig. 13. Transcription factor families.
Expression of key transcription factors for each subclass in the taxonomy tree, organized by transcription factor gene families. The lines divide the dendrogram into neighborhoods. Source Data
Extended Data Fig. 14
Extended Data Fig. 14. Distribution of Gini coefficient for subclasses.
(a) Illustration explaining the concept of the Gini coefficient (GC). For each subclass, brain regions are ordered by number of cells present in x-axis. The y-axis is the cumulative fraction of cells for each subclass. The Gini coefficient is calculated by dividing the area (Area A) between the line of perfect equality and the observed distribution curve (the Lorenz curve) by the total area under the line of perfect equality (Areas A + B). The result is a value between 0 and 1 with 0 representing perfect equality and 1 maximum inequality. (b) Distribution of GCs for all subclasses. Color scheme is the same as used for Fig. 6a. (c) Ridge plot showing the distribution of GCs for subclasses grouped by class. (d) 3D example plots of subclasses for 4 classes (02 NP-CT-L6b, 07 CTX-MGE-GABA, 30 Astro-Epen, and 33 Vascular), illustrating the wide range of GCs present. Within each class, plots are ordered by GC from lowest to highest.
Extended Data Fig. 15
Extended Data Fig. 15. Predicting transcriptomic subclasses based on spatial location of MERFISH cells.
(a) Correspondence between assigned subclasses for MERFISH cells in glutamatergic, dopaminergic and serotonergic subclasses, and predicted subclasses based on the spatial coordinates of these MERFISH cells. Each row is normalized by dividing by the maximum number. Insert in the lower left corner shows the correspondence between assigned and predicted glutamatergic, dopaminergic, and serotonergic classes. Insert in the upper right corner highlights the correspondence between assigned and predicted subclasses in the MB Glut class. (b) Correspondence between assigned GABAergic subclasses and predicted subclasses based on the spatial coordinates of MERFISH cells. Insert in the lower left corner shows the correspondence between assigned and predicted GABAergic classes. Insert in the upper right corner highlights the correspondence between assigned and predicted subclasses in the MB GABA class. Source Data
Extended Data Fig. 16
Extended Data Fig. 16. Predicting anatomical regions based on imputed MERFISH transcriptomes.
(a) Correspondence between assigned CCFv3 regions for MERFISH cells in glutamatergic, dopaminergic, and serotonergic cell types to predicted CCFv3 regions based on imputed transcriptomes of these MERFISH cells. Each row is normalized by dividing by the maximum number. Insert in the lower left corner shows the correspondence between assigned and predicted regions for glutamatergic, dopaminergic, and serotonergic cell types. Insert in the upper right corner highlights the correspondence between assigned and predicted subregions in midbrain. (b) Correspondence between assigned CCFv3 regions for MERFISH cells in GABAergic cell types and predicted CCFv3 regions based on imputed transcriptomes of these MERFISH cells. Insert in the lower left corner shows the correspondence between assigned and predicted regions for GABAergic cell types. Insert in the upper right corner highlights the correspondence between assigned and predicted subregions in midbrain. Source Data
Extended Data Fig. 17
Extended Data Fig. 17. Distribution of cluster numbers and cluster sizes across different brain regions.
(a) Number of clusters per fine CCFv3 region (Supplementary Table 9) as analyzed using the MERFISH data. Bars are colored by broad CCFv3 regions. (b) Distribution of cluster size (number of cells per cluster) per major brain region in scRNA-seq data and MERFISH data.
Extended Data Fig. 18
Extended Data Fig. 18. Circadian cycle associated expression changes in clock genes.
(a-b) Dot plots showing the expression of clock genes in light-phase and dark-phase cells within each cell class (a) or selected subclasses that have any clock genes with fold change |log2(FC)| > 1 between light and dark phases (b). Dot size and color indicate proportion of expressing cells and average expression level in each class or subclass, respectively. (c) Heatmap showing the log2(FC) difference between light and dark phases for clock genes in the selected subclasses as in (b).

Update of

  • A high-resolution transcriptomic and spatial atlas of cell types in the whole mouse brain.
    Yao Z, van Velthoven CTJ, Kunst M, Zhang M, McMillen D, Lee C, Jung W, Goldy J, Abdelhak A, Baker P, Barkan E, Bertagnolli D, Campos J, Carey D, Casper T, Chakka AB, Chakrabarty R, Chavan S, Chen M, Clark M, Close J, Crichton K, Daniel S, Dolbeare T, Ellingwood L, Gee J, Glandon A, Gloe J, Gould J, Gray J, Guilford N, Guzman J, Hirschstein D, Ho W, Jin K, Kroll M, Lathia K, Leon A, Long B, Maltzer Z, Martin N, McCue R, Meyerdierks E, Nguyen TN, Pham T, Rimorin C, Ruiz A, Shapovalova N, Slaughterbeck C, Sulc J, Tieu M, Torkelson A, Tung H, Cuevas NV, Wadhwani K, Ward K, Levi B, Farrell C, Thompson CL, Mufti S, Pagan CM, Kruse L, Dee N, Sunkin SM, Esposito L, Hawrylycz MJ, Waters J, Ng L, Smith KA, Tasic B, Zhuang X, Zeng H. Yao Z, et al. bioRxiv [Preprint]. 2023 Mar 6:2023.03.06.531121. doi: 10.1101/2023.03.06.531121. bioRxiv. 2023. Update in: Nature. 2023 Dec;624(7991):317-332. doi: 10.1038/s41586-023-06812-z. PMID: 37034735 Free PMC article. Updated. Preprint.

References

    1. Yuste R, et al. A community-based transcriptomics classification and nomenclature of neocortical cell types. Nat. Neurosci. 2020;23:1456–1468. doi: 10.1038/s41593-020-0685-8. - DOI - PMC - PubMed
    1. Zeng H. What is a cell type and how to define it? Cell. 2022;185:2739–2755. doi: 10.1016/j.cell.2022.06.031. - DOI - PMC - PubMed
    1. Zeng H, Sanes JR. Neuronal cell-type classification: challenges, opportunities and the path forward. Nat. Rev. Neurosci. 2017;18:530–546. doi: 10.1038/nrn.2017.85. - DOI - PubMed
    1. Paxinos, G. The Rat Nervous System 4th edn (Academic Press, 2014).
    1. Swanson LW. What is the brain? Trends Neurosci. 2000;23:519–527. doi: 10.1016/S0166-2236(00)01639-8. - DOI - PubMed

Publication types