. 2023 Dec;624(7991):355-365.
doi: 10.1038/s41586-023-06823-w. Epub 2023 Dec 13.

Brain-wide correspondence of neuronal epigenomics and distant projections

Affiliations

Brain-wide correspondence of neuronal epigenomics and distant projections

Jingtian Zhou et al. Nature. 2023 Dec.

Abstract

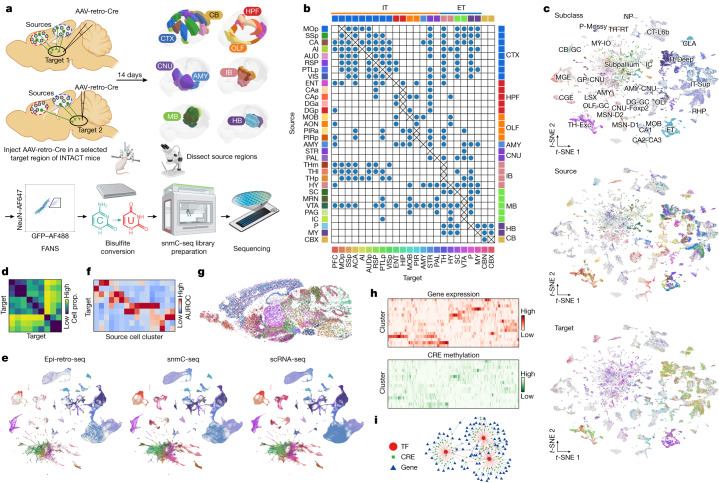
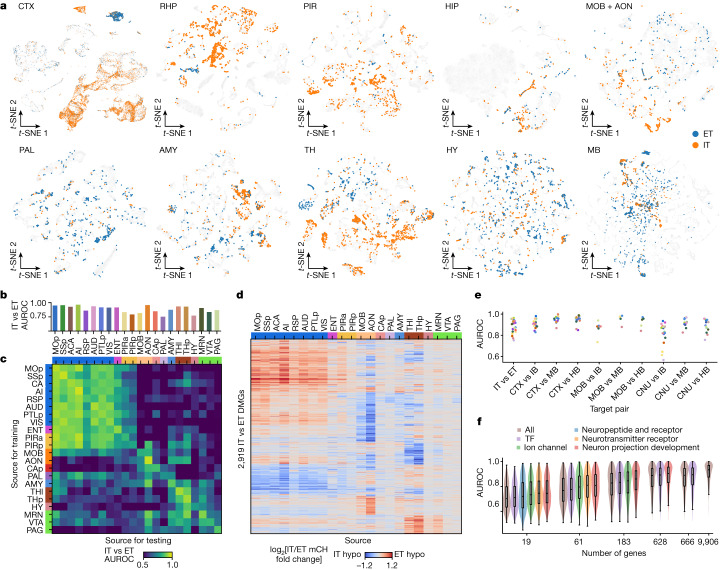
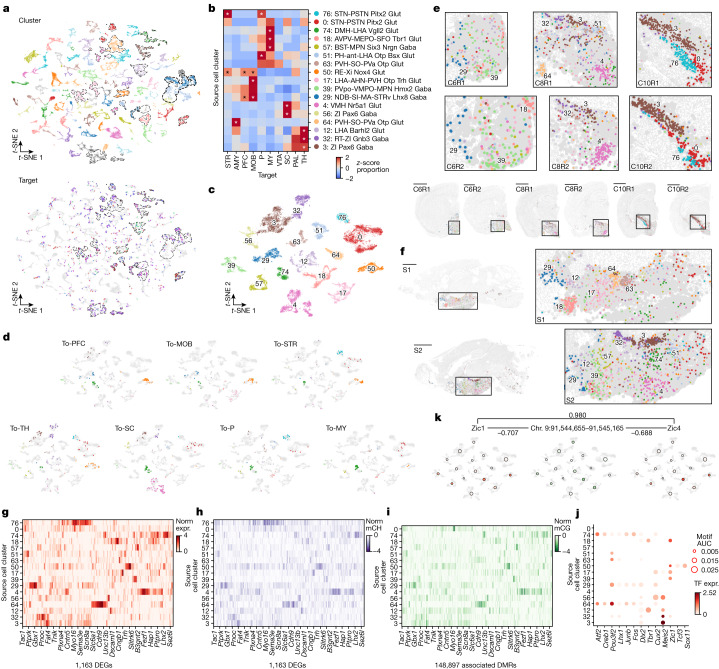
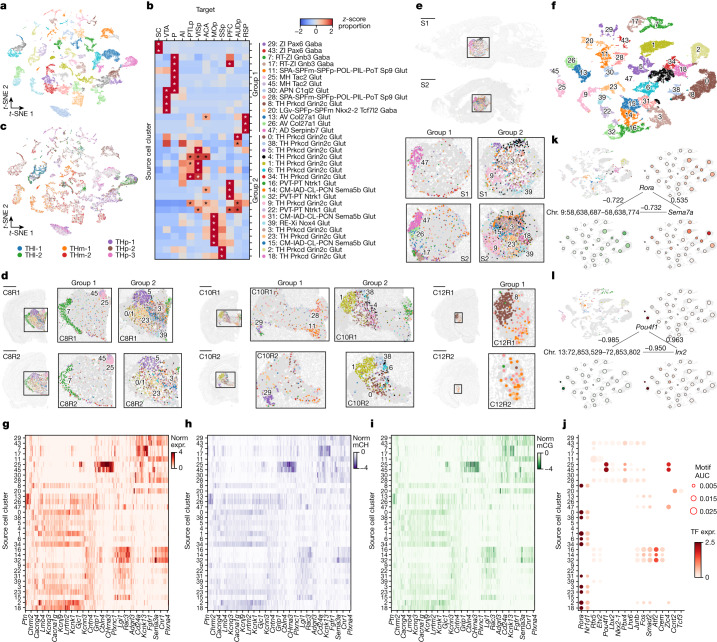
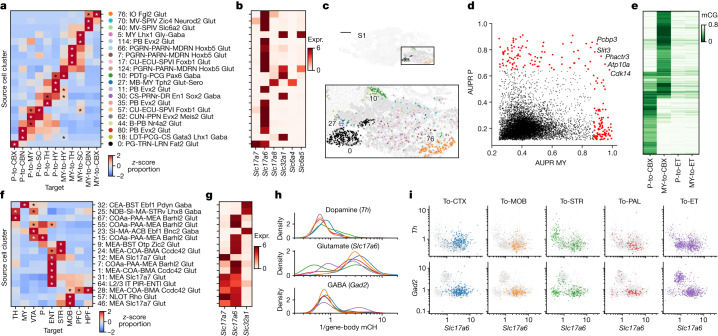
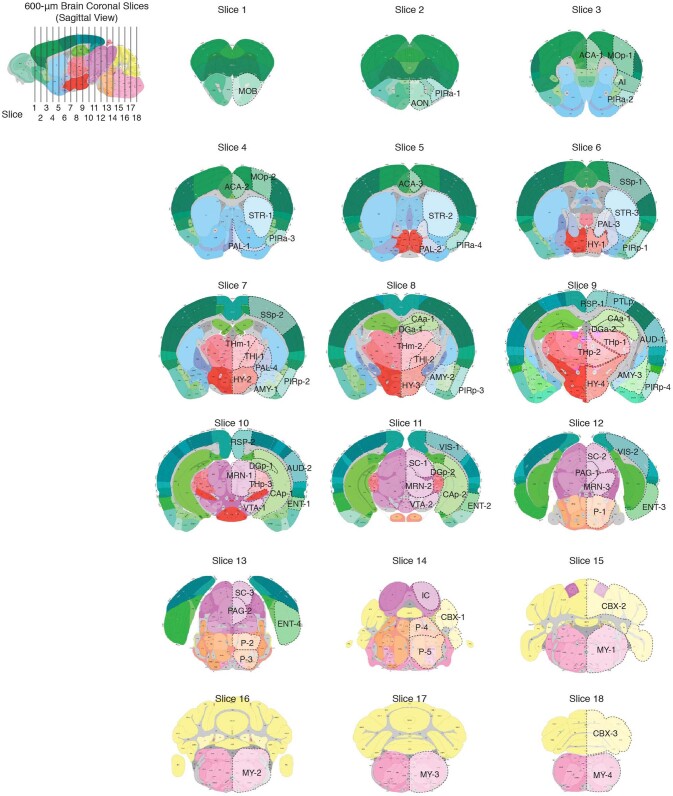
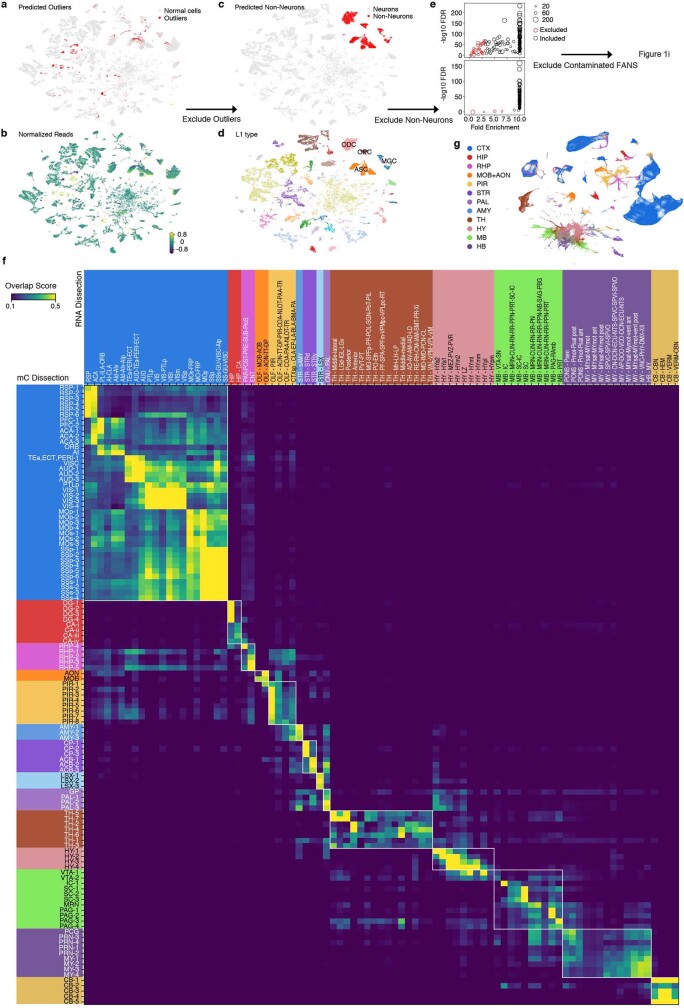
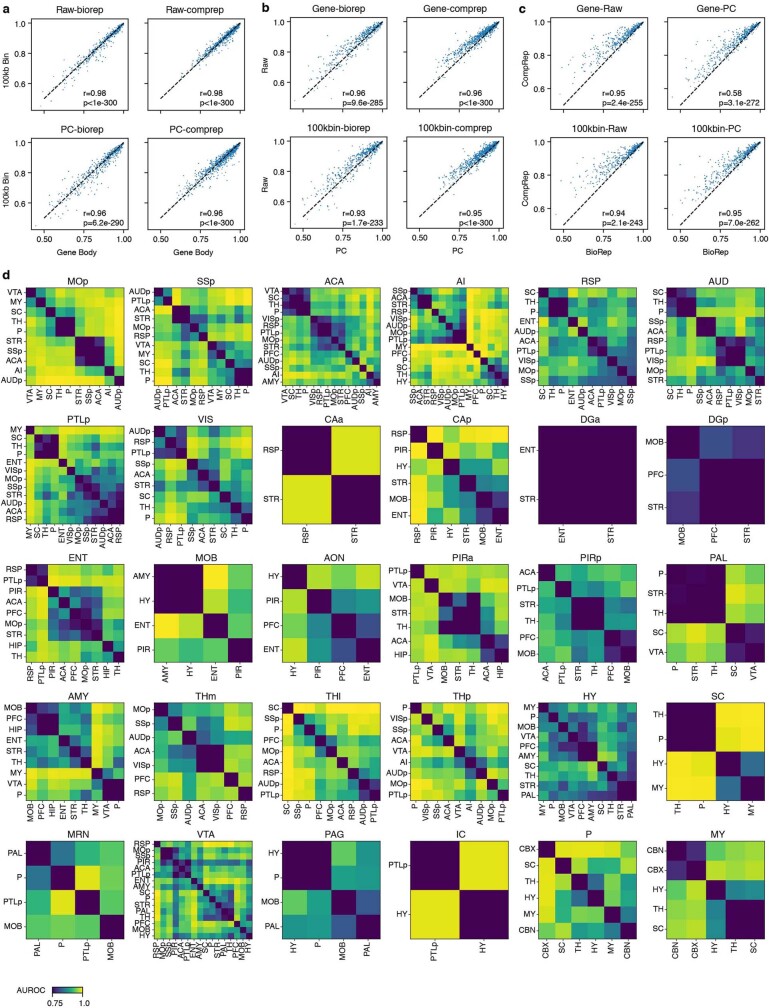
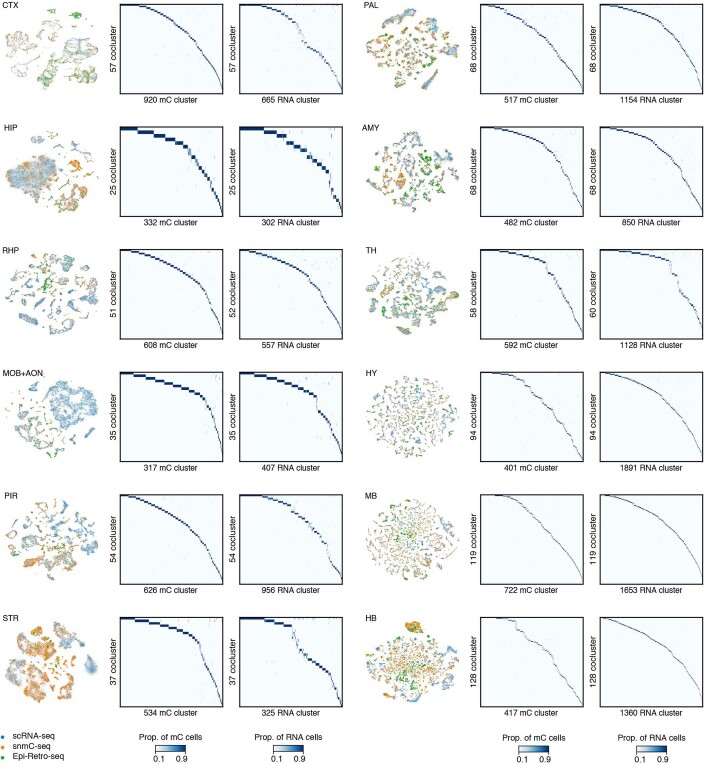
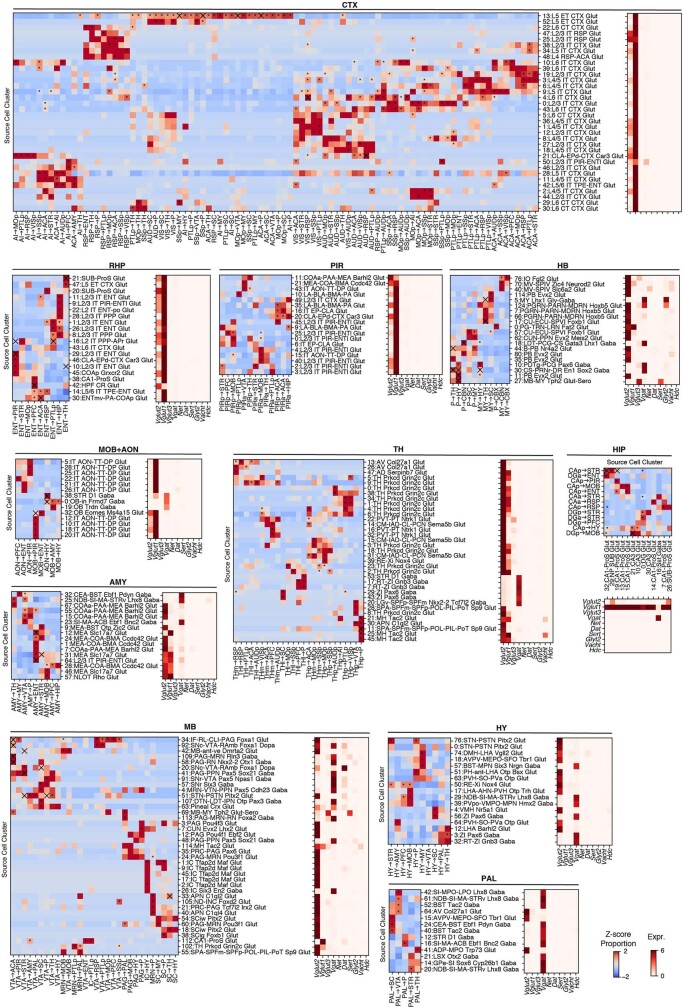
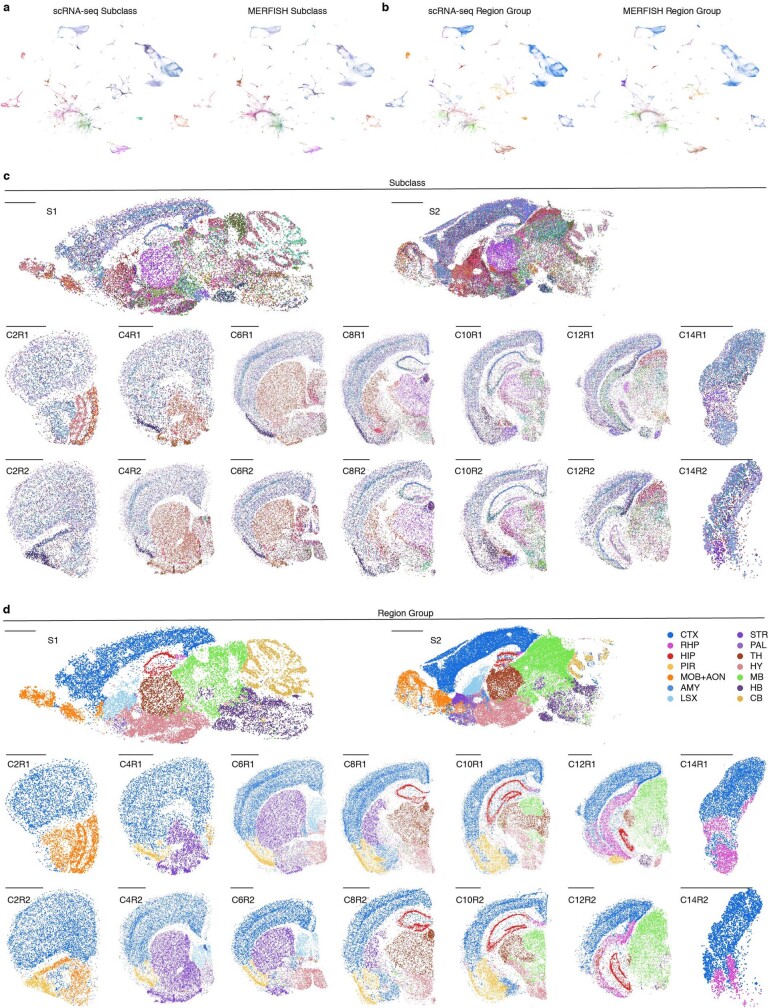
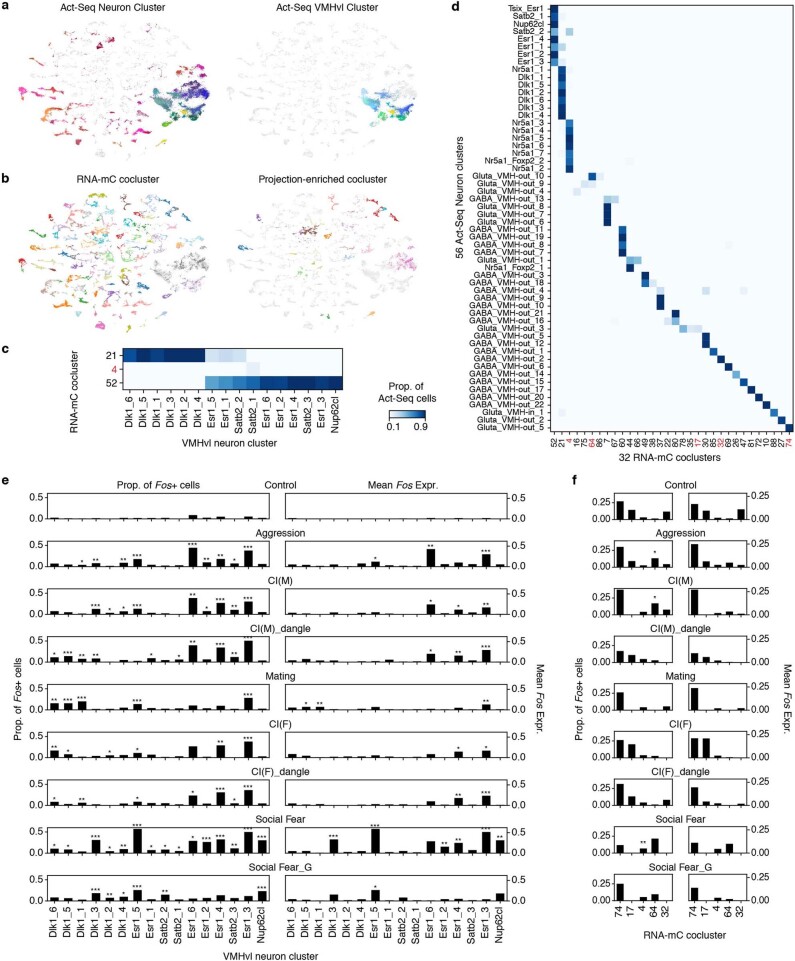
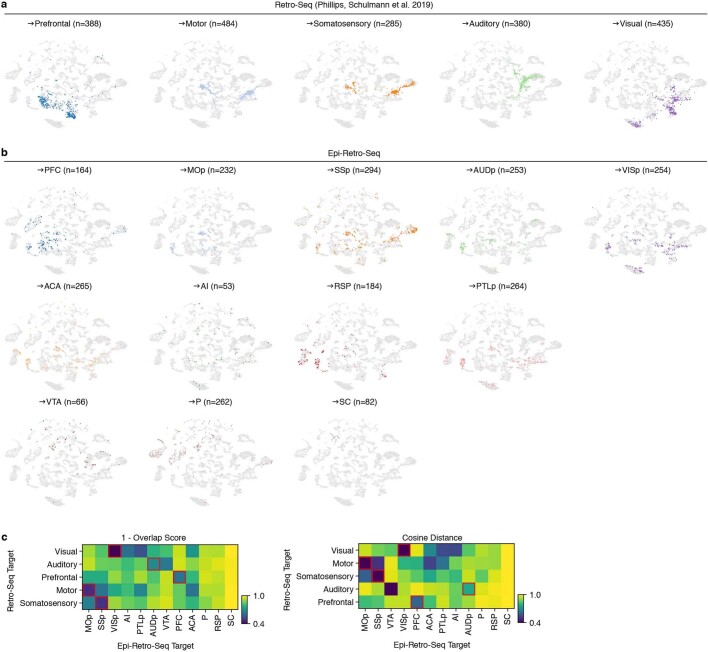
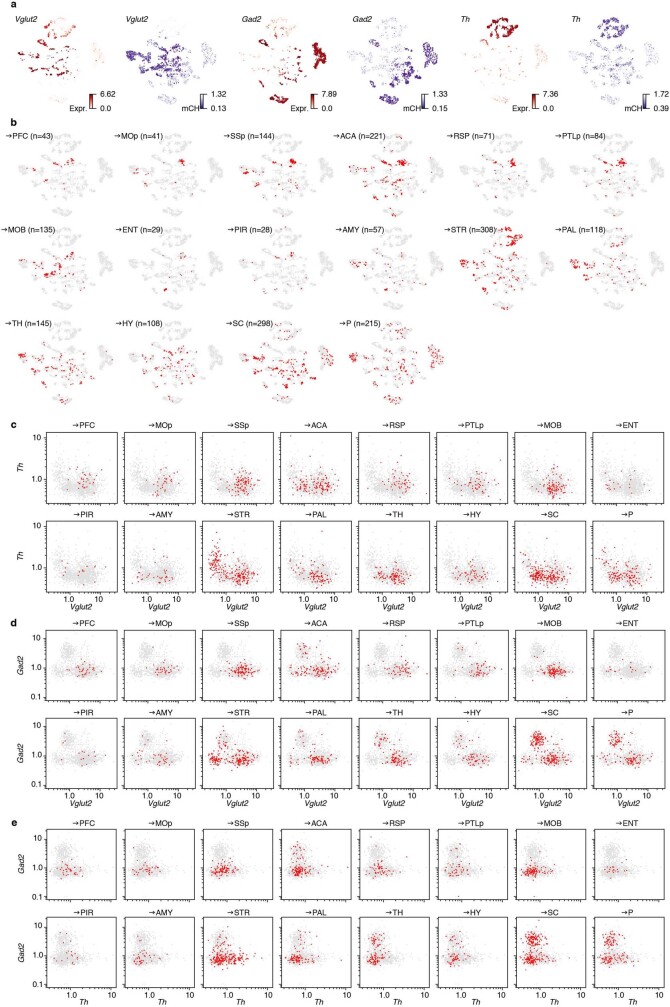
Single-cell analyses parse the brain's billions of neurons into thousands of 'cell-type' clusters residing in different brain structures1. Many cell types mediate their functions through targeted long-distance projections allowing interactions between specific cell types. Here we used epi-retro-seq2 to link single-cell epigenomes and cell types to long-distance projections for 33,034 neurons dissected from 32 different regions projecting to 24 different targets (225 source-to-target combinations) across the whole mouse brain. We highlight uses of these data for interrogating principles relating projection types to transcriptomics and epigenomics, and for addressing hypotheses about cell types and connections related to genetics. We provide an overall synthesis with 926 statistical comparisons of discriminability of neurons projecting to each target for every source. We integrate this dataset into the larger BRAIN Initiative Cell Census Network atlas, composed of millions of neurons, to link projection cell types to consensus clusters. Integration with spatial transcriptomics further assigns projection-enriched clusters to smaller source regions than the original dissections. We exemplify this by presenting in-depth analyses of projection neurons from the hypothalamus, thalamus, hindbrain, amygdala and midbrain to provide insights into properties of those cell types, including differentially expressed genes, their associated cis-regulatory elements and transcription-factor-binding motifs, and neurotransmitter use.


Conflict of interest statement

J.R.E. serves on the scientific advisory board of Zymo Research Inc.

Figures

Fig. 1
Fig. 1. The epigenomic landscape of brain-wide projection neurons.
a, Schematics of the epi-retro-seq workflow for retrogradely labelling and epigenetically profiling single projection neurons. The three-dimensional brain contours of the source regions (top right) were derived from the Allen Mouse Brain Reference Atlas (http://atlas.brain-map.org, © 2017 Allen Institute for Brain Science, version 3 (2020)). The diagrams of the brain slices (top left) and the images of the surgical set up, microscope and library preparation apparatus in the workflow were created with BioRender.com. b, A total of 225 source–target combinations profiled using epi-retro-seq (blue dots) from 32 different source regions (rows) projecting to 24 different targets (columns) across the whole mouse brain. The colour palettes of sources (left), targets (bottom) and region groups (top and right) are labeled on the side and used across the article. c, Joint two-dimensional t-SNE of epi-retro-seq (n = 35,938) and unbiased snmC-seq (n = 276,187) neurons. snmC-seq neurons are shown in grey and epi-retro-seq neurons are coloured by cell subclass (top), the source regions of neurons (middle) or their projection targets (bottom; n = 33,034, after removing the experiments with less confident target assignment). d, As an example, AUROC for pairwise comparisons of AMY neurons projecting to nine targets. Higher AUROC scores suggest greater distinguishability between the compared projections based on their gene-body mCH levels. e, Joint t-SNE of whole-mouse-brain neurons from epi-retro-seq (n = 35,743), unbiased snmC-seq (n = 266,740) and scRNA-seq (n = 2,434,472) coloured by cell subclass. f, As an illustration, the proportion (prop.) of neurons found in each AMY cell cluster (row) that projects to each target (column). Only clusters that were enriched for projection neurons are shown and values are z-score normalized across targets. g, A sagittal brain slice for MERFISH with all neurons coloured by their assigned subclasses. h, An illustration of joint analysis of single-cell transcriptomes and DNA methylomes that enables the characterization of gene expression patterns of DEGs between these projection-enriched clusters, as well as the mCG levels of DEG-associated putative CREs, as marked by DMRs. i, An illustration of GRN linking TFs, CRE and target genes. AI, agranular insular cortex; AUD, auditory cortex; AUDp, primary auditory cortex; CAa, anterior cornu ammonis; CAp, posterior cornu ammonis; CB, cerebellum; CBN, cerebellar nuclei; CGE, caudal ganglionic eminence; CT, corticothalamic; DGa, anterior dentate gyrus; DGp, posterior dentate gyrus; GC, granule cell; GP, globus pallidus; HPF, hippocampal formation; IC, inferior colliculus; IO, inferior olivary; LSX, lateral septal complex; MGE, medial ganglionic eminence; MSN, medium spiny neurons; NP, near projecting; OLF, olfactory areas; PAG, periaqueductal grey; PIRa, anterior piriform cortex; PIRp, posterior piriform cortex; THl, anterior lateral thalamus; THm, anterior medial thalamus; THp, posterior TH; VIS, visual cortex.
Fig. 2
Fig. 2. Distinguishability of neurons projecting to different targets across the entire brain.
a, Joint t-SNEs of epi-retro-seq, unbiased snmC-seq and scRNA-seq data from ten region groups containing both IT- and ET-projecting neurons from the same source. Only the epi-retro-seq neurons projecting from the same source to ET (blue) and IT (orange) targets are coloured and the other cells are in grey. b, AUROC scores for comparisons between IT versus (vs) ET neurons from each of the 22 source regions. c, AUROC for IT versus ET neurons when the model was trained in one source region (row) and tested on another source region (column). A high AUROC indicates that the epigenetic differences between IT and ET neurons were similar between the training and testing sources. The values on the diagonal of c are the same as the values in b. d, The log2 fold changes of mCH levels in each source at the IT versus ET DMGs. A total of 2,919 DMGs are shown that were identified in at least one of the 22 source regions. The row and column colours represent the region groups in bd. e, AUROC for comparisons of neurons projecting to each pair of target groups. Each dot represents a comparison in one source region (colour palette as in b). f, AUROC for the comparison of all target pairs from every source region (n = 926) with models using different sets of genes as features. Subsets or all of the 9,906 genes with high coverage in single cells were used. The larger gene sets were downsampled to the same number of genes as the smaller sets for comparison. All comparisons between gene sets are significant (false discovery rates (FDRs) in Supplementary Table 6; two-sided Wilcoxon signed-rank test, Benjamini–Hochberg procedure) except the ones between “neuron projection development” and “neurotransmitter receptor” with 19 genes.
Fig. 3
Fig. 3. The diversity of cell type, spatial location and gene regulation of hypothalamic projection neurons.
a, Joint t-SNE of epi-retro-seq (n = 1,572), unbiased snmC-seq (n = 11,554) and scRNA-seq (n = 148,840) data for hypothalamic neurons coloured by cell cluster (top) or projection target (bottom, same colour palette as left row colours in Fig. 1b). Seventeen clusters enriched for the profiled projection neurons are outlined. b, The proportion of each of the 10 projections in each of the 17 projection-enriched clusters, z-score normalized across targets. The asterisk denotes enrichment with FDR < 0.01 (one-sided Fisher exact test, Benjamini–Hochberg procedure; Methods). c,d, t-SNE of cells in the 17 projection-enriched clusters coloured by co-cluster. All cells are colored in c, whereas only cells projecting to one target are colored in each of the subplots in d. e,f, Projection-enriched HY clusters mapped to MERFISH data for six coronal slices (e; two biological replicates (R1 and R2) of slices from anterior to posterior (C6, C8 and C10)) and two sagittal slices (f; S1 and S2 from lateral to medial). Examples of clusters with specific spatial locations are labelled in the enlarged insets of each slice. Scale bars, 15 mm. The colour palette for clusters is the same in bf. gi, Normalized gene expression (norm expr, g) and gene-body mCH (h) levels of DEGs (n = 1,163) between the 17 projection-enriched clusters, and mCG levels of DEG-associated DMRs (i; n = 148,897), in each cluster. The values are z-score normalized across clusters. The DEGs and cell clusters are arranged in the same orders in gi. Only the DMRs with the highest anticorrelation with each DEG are shown in i to make the column orders consistent for gi. Examples of DEGs with GO annotations related to neuronal function and connectivity are labelled on the x axis. j, Examples of TFs whose binding motifs were enriched in hypo-CG-methylated DMRs of each cluster are shown in the bubble plot. The size of each dot represents the enrichment level (area under the curve (AUC)). The colour of the dot indicates the expression (expr.) level of the TF. The clusters are arranged in the same order as in gi. Cluster 76 was excluded in i,j as the number of cells in the cluster is too small (<30) to be included in the DMR analysis. k, Example triplet combination of TF–CRE–target gene in GRN of HY. Pearson correlation coefficients (PCCs) are shown on edges. The t-SNE plots share the same coordinates as c. Single cells are greyed and shown in the background. Large dots represent clusters, plotted at the mean coordinates of cells in the cluster. The size of each dot is proportional to the number of cells in the cluster. The dots are coloured by Zic1 expression (left), mCG level of an example DMR (middle) and Zic4 expression (right). Colour scales for gene expression are the same as in g, and the colour scale for mCG is the same as in i.
Fig. 4
Fig. 4. The diversity of cell type, spatial location and gene regulation of thalamic projection neurons.
a, Joint t-SNE of epi-retro-seq (n = 2,606), unbiased snmC-seq (n = 16,943) and scRNA-seq (n = 162,795) data for thalamic neurons coloured by cell cluster. b, The proportion of each of the 12 assayed TH projections in each of the 33 projection-enriched clusters, z-score normalized across targets. The same set of colours is used for labelling clusters in both cluster group 1 (14 clusters) and cluster group 2 (19 clusters). The asterisk denotes enrichment with FDR < 0.01 (one-sided Fisher exact test, Benjamini–Hochberg procedure; Methods). c, TH neurons dissected from two anterior lateral regions (THl-1 and THl-2), two anterior medial regions (THm-1 and THm-2) and three posterior regions (THp-1, THp-2 and THp-3) coloured respectively in the t-SNE. See slices 7–10 in Extended Data Fig. 1 for details. d,e, Projection-enriched TH clusters mapped to MERFISH data for six coronal slices (d; two biological replicates (R1 and R2) of slices from anterior to posterior (C8, C10 and C12)) and two sagittal slices (e; S1 and S2 from lateral to medial). The colours of the clusters in the left (right) column of the insets are the same as for cluster group 1 (2) in b. Examples of clusters with specific spatial locations are labelled in the enlarged insets of each slice. C12R1 and C12R2 are not shown for cluster group 2. Scale bars, 15 mm. f, t-SNE of projection-enriched clusters coloured by co-cluster. The colour palette for clusters in f and the top left of k,l is the same as in b. gi, Normalized gene expression (norm expr, g) and gene-body mCH (h) levels of DEGs (n = 2,348) between the 33 projection-enriched clusters, and mCG levels of DEG-associated DMRs (i; n = 1,566,402), in each cluster. The values are z-score normalized across clusters. The DEGs and cell clusters are arranged in the same orders in gi. Only the DMRs with the highest anticorrelation with each DEG are shown in i to make the column orders consistent for gi. Examples of DEGs with GO annotations related to neuronal function and connectivity are labelled on the x axis. j, Examples of TFs whose binding motifs were enriched in hypo-CG-methylated DMRs of each cluster are shown in the bubble plot. The size of each dot represents the enrichment level (AUC). The colour of the dot indicates the expression level of the TF. The clusters are arranged in the same order as in b,gi. k,l, Example triplet combinations of TF–CRE–target gene in GRN of TH. PCCs are shown on edges. The coordinates of the t-SNE plots are the same as in f. Top left, cells projecting to SSp (k) or P (l) are highlighted, coloured by co-clusters. In other plots, single cells are greyed and shown as background. Large dots represent clusters, plotted at the mean coordinates of the cells in the cluster. The size of each dot is proportional to the number of cells in the cluster. The dots are coloured by Rora (k) or Pou4f1 (l) expression (top right), mCG level of an example DMR (bottom left) and Sema7a (k) or Irx2 (l) expression (bottom right). The colour scales for gene expression are the same as in g, and the colour scale for mCG is the same as in i.
Fig. 5
Fig. 5. Neurotransmitter usage in HB, AMY and VTA projection neurons.
a,b, The proportion of each of the 11 assayed HB projections (a, z-score normalized across targets; the asterisk denotes enrichment with FDR < 0.01 (one-sided Fisher exact test, Benjamini–Hochberg procedure; Methods)) and the expression levels of six neurotransmitter transporter genes, encoding respectively VGLUT1, VGLUT2, VGLUT3, VGAT, SERT and GLYT2 (b), in each of the 20 HB projection-enriched clusters. c, Projection-enriched HB clusters mapped to the MERFISH slice S1. The colour palette for clusters is the same as in a. d, AUC of precision–recall (AUPR) of genes to distinguish the P-to-CBX cluster (0) and P-to-ET clusters (10, 11, 27, 30, 35, 44, 57, 62 and 80) versus the MY-to-CBX cluster (76) and MY-to-ET clusters (5, 7, 10, 11, 17, 57, 66 and 114) with gene-body mCH level in epi-retro-seq data. The genes with AUPR > 0.872 in P and AUPR > 0.647 in MY (>99th quantile) are coloured in red. Five genes selected in both P and MY are labelled. e, mCG levels of hypo-mCG DMRs (n = 22,3839) in P and MY between the P-to-CBX clusters and P-to-ET clusters. f,g, The proportion of each of the 9 assayed AMY projections (f, z-score normalized across targets; the asterisk denotes enrichment with FDR < 0.01 (Fisher exact test, Benjamini–Hochberg procedure; Methods)) and the expression levels of neurotransmitter transporters Slc17a7, Slc17a6 and Slc32a1, encoding respectively VGLUT1, VGLUT2 and VGAT (g), in each of the 16 projection-enriched clusters. h,i, The gene-body mCH levels of tyrosine hydroxylase (Th), Gad2 and Slc17a6 in VTA projection neurons, shown in density plots (h) or scatter plots (i). Colours represent VTA neurons projecting to different targets and the same palette is used in h,i. Note that the x axis in h and both axes in i are plotted as reciprocal mCH values (1/gene-body mCH), so low mCH is plotted to the right and top, indicating higher gene expression. ACA was not included in CTX (see Extended Data Fig. 9).
Extended Data Fig. 1
Extended Data Fig. 1. The dissection map of source regions across the mouse brain.
The posterior views of dissected slices are shown. The slices correspond to Allen Mouse Common Coordinate Framework (CCF), Reference Atlas, Version 3 (2020), level 21 ~ 27 (slice 1), 27 ~ 33 (slice 2), 33 ~ 39 (slice 3), 39 ~ 45 (slice 4), 45 ~ 51 (slice 5), 51 ~ 57 (slice 6), 57 ~ 63 (slice 7), 63 ~ 69 (slice 8), 69 ~ 75 (slice 9), 75 ~ 81 (slice 10), 81 ~ 87 (slice 11), 87 ~ 93 (slice 12), 93 ~ 99 (slice 13), 99 ~ 105 (slice 14), 105 ~ 111 (slice 15), 111 ~ 117 (slice 16), 117 ~ 123 (slice 17), and 123 ~ 129 (slice 18), respectively. Regions dissected from each slice are indicated by dotted lines and are annotated. Allen Brain Reference Atlas, http://www.atlas.brain-map.org, © 2017 Allen Institute for Brain Science.
Extended Data Fig. 2
Extended Data Fig. 2. Quality control workflow and region group assignment.
a, b, Joint t-SNE of Epi-Retro-Seq cells (n = 56,843) and unbiased snmC-seq cells (n = 310,605) after basic QC (Methods, QC Step 1) colored by the predicted outliers (a) or the total number of reads normalized per sequencing plate (b). c, d, Joint t-SNE of Epi-Retro-Seq cells (n = 48,032) and unbiased snmC-seq cells (n = 301,626) after removing outlier clusters (Methods, QC Step 2) colored by neuronal vs. non-neuronal cells (c) or their assigned L1 type (d). e, the on-target vs. off-target fold enrichment (x-axis) and -log10 FDR (y-axis) of IT (n = 186, top) or ET (n = 100, bottom) FANS experiments. The size of the circle is proportional to the number of neurons captured in the experiment. f, The overlap scores between 115 snmC-seq dissections and 87 scRNA-seq dissections. Each region group is colored differently on the x and y axes and squared in the heatmap. g, Joint t-SNE of Epi-Retro-Seq (n = 35,743), snmC-seq (n = 266,740), and scRNA-seq (n = 2,434,472) neurons colored by region groups. (f) and (g) share the same color palette.
Extended Data Fig. 3
Extended Data Fig. 3. Quantification of target discriminability for all 926 target pairs from all source regions.
a, Comparisons of AUROCs from models trained with gene features (x-axis) or 100 kb bin features (y-axis) using posterior mCH level (top) or mCH principal components (bottom) when splitting the training and testing data according to biological replicates (left) or computational replicates (right). b, Comparisons of AUROCs from models trained with mCH principal components (x-axis) or posterior mCH level (y-axis) using gene (top) or 100 kb bin (bottom) features when split the training and testing data according to biological replicates (left) or computational replicates (right). c, Comparisons of AUROCs from models when splitting the training and testing data according to biological replicates (x-axis) or computational replicates (y-axis) using gene (top) or 100 kb bin (bottom) features and posterior mCH level (left) or mCH principal components (right). For a-c, each dot represents a pairwise comparison between the neurons projecting from the same source to two different targets. The plots involving biological replicates have 516 data points each while the others have 926 data points each. Pearson Correlation Coefficient (PCC, r) and P value (permutation test) are labeled in each panel. d, The AUROC between neurons projecting from each of the 30 sources to all possible pairs of targets that have been profiled for the source. STR and CBX are not included since we only profiled one target for these sources.
Extended Data Fig. 4
Extended Data Fig. 4. Co-clustering of Epi-Retro-Seq, unbiased snmC-seq and scRNA-seq data for 12 brain regions.
For each brain region group, the joint t-SNE colored by data modality (left) and the proportion of cells from each snmC-seq L4 cluster (middle, column) or scRNA-seq L3 cluster (right, column) within each co-cluster (middle and right, row). Numbers of co-clusters in the rows are sometimes different for middle and right columns because only the co-clusters (rows) with more than one value > 10% across the columns are shown. See Methods for further details.
Extended Data Fig. 5
Extended Data Fig. 5. Projection-enriched cell clusters and their neurotransmitter usage for all brain regions.
Joint clustering analysis of Epi-Retro-Seq, unbiased snmC-seq and scRNA-seq was performed on each of the major brain region groups, including CTX, RHP, PIR, HB, MOB + AON, AMY, TH, HIP, MB, HY, and PAL (STR not included because there is only one target), to characterize neuronal cell clusters that were enriched for Epi-Retro-Seq projections. The normalized proportion of each projection in each cluster was visualized in the heatmaps (left) for each of the brain region groups. “*” denotes FDR < 0.01 for testing if the proportion of cells in a cluster among those projecting to a target is greater than the proportion of cells in this cluster among those projecting to all other targets (one-sided Fisher exact test; Benjamini-Hochberg procedure). “X” denotes FDR < 0.01 for testing if the proportion of cells in a cluster among those projecting to a target is different between male and female samples (two-sided Fisher exact test; Benjamini-Hochberg procedure). In addition, the expression levels of 10 marker genes for neurotransmitter usage in each cluster are visualized in the heatmap (right) for each brain region group. These genes included Slc17a7 (Vglut1), Slc17a6 (Vglut2), and Slc17a8 (Vglut3) for glutamatergic neurons, Slc32a1 (Vgat) for GABAergic neurons, Slc6a2 (Net) for noradrenergic neurons, Slc6a3 (Dat) for dopaminergic neurons, Slc6a4 (Sert) for serotonergic neurons, Slc6a5 (Glyt2) for glycinergic neurons, Slc18a3 (Vacht) for cholinergic neurons, and histidine decarboxylase (Hdc) for histaminergic neurons.
Extended Data Fig. 6
Extended Data Fig. 6. Joint clustering and annotation of MERFISH and scRNA-seq data.
a, b, Joint t-SNE of scRNA-seq neurons (n = 2,619,158, left) and MERFISH neurons (n = 329,282, right) colored by cell subclass (a) or region group (b). The labels for scRNA-seq cells are based on Yao et al. and the labels for MERFISH cells are predicted through integration. c, d, The MERFISH slices colored by cell subclass (c) or region group (d). Scale bars represent 15 mm.
Extended Data Fig. 7
Extended Data Fig. 7. Integration and comparisons of hypothalamic Epi-Retro-Seq, Act-seq, and scRNAseq data.
a, b, Joint t-SNE of Act-Seq neurons (n = 78,476, a) and scRNA-seq neurons (n = 148,840, b). In (a), all Act-Seq neurons (left) or only VMHvl neurons (right) are colored by Act-Seq neuron cluster (left) or VMH cluster (right). In (b), all scRNA-seq neurons (left) or only neurons in projection associated clusters (right) are colored by the co-cluster label. c, d, The proportion of neurons from each of the Act-Seq VMHvl clusters (c) or all neuron clusters (d) classified as neurons of each co-cluster. Only the co-clusters with value > 0.1 in at least one Act-Seq cluster are shown. The projection-associated co-clusters are labeled in red. e, f, Proportion of Fos+ “behavior activated” cells (left) or average Fos expression (right) of each VMHvl cluster (e) or each co-cluster (f) in control and different behavior experiments. Only the co-clusters labeled red in d are shown in (f). *, **, and *** represent FDR < 0.1, 0.01, and 0.001, respectively.
Extended Data Fig. 8
Extended Data Fig. 8. Comparison of thalamic Retro-Seq and Epi-Retro-Seq data.
a, t-SNEs for visualization of the Retro-Seq data from thalamic neurons projecting to prefrontal, motor, somatosensory, auditory, and visual cortices that were mapped onto the joint-clustering analysis of Epi-Retro-Seq, unbiased snmC-seq and scRNA-seq in TH. b, The t-SNEs for visualization of the Epi-Retro-Seq data for thalamic neurons projecting to 12 different targets that were mapped onto the same t-SNE space. c, The overlap score and cosine distance were calculated for each pairwise comparison of Retro-Seq and Epi-Retro-Seq projections and were visualized in the heatmaps, respectively.
Extended Data Fig. 9
Extended Data Fig. 9. The neurotransmitter usage of VTA projection neurons.
a, Joint t-SNE of Epi-Retro-Seq, unbiased snmC-seq and scRNA-seq of VTA neurons colored by the gene expression levels (red) and gene-body mCH levels (purple) for Vglut2 (left), Gad2 (middle), and Th (right), marker genes for glutamatergic, GABAergic, and dopaminergic neurons, respectively. b, The distribution of VTA neurons projecting to each of the 16 targets on the same t-SNE. c-e, The gene-body mCH levels of Th versus Vglut2 (c), Gad2 versus Vglut2 (d), and Gad2 versus Th (e) for VTA neurons projecting to each of the 16 targets, are visualized in scatter plots. Note that, because low mCH levels indicate high gene expression, the axes in c-e are plotted as the reciprocal mCH values (1/gene body mCH), so low mCH is plotted to the right/up and high to the left/down.

Comment in

References

    1. Armand EJ, Li J, Xie F, Luo C, Mukamel EA. Single-cell sequencing of brain cell transcriptomes and epigenomes. Neuron. 2021;109:11–26. doi: 10.1016/j.neuron.2020.12.010. - DOI - PMC - PubMed
    1. Zhang Z, et al. Epigenomic diversity of cortical projection neurons in the mouse brain. Nature. 2021;598:167–173. doi: 10.1038/s41586-021-03223-w. - DOI - PMC - PubMed
    1. Chen X, et al. High-throughput mapping of long-range neuronal projection using in situ sequencing. Cell. 2019;179:772–786. doi: 10.1016/j.cell.2019.09.023. - DOI - PMC - PubMed
    1. Sun Y-C, et al. Integrating barcoded neuroanatomy with spatial transcriptional profiling enables identification of gene correlates of projections. Nat. Neurosci. 2021;24:873–885. doi: 10.1038/s41593-021-00842-4. - DOI - PMC - PubMed
    1. Economo MN, et al. Distinct descending motor cortex pathways and their roles in movement. Nature. 2018;563:79–84. doi: 10.1038/s41586-018-0642-9. - DOI - PubMed

Publication types

Substances