. 2024 Jan;625(7996):805-812.
doi: 10.1038/s41586-023-06835-6. Epub 2023 Dec 13.

Base-editing mutagenesis maps alleles to tune human T cell functions

Affiliations

Base-editing mutagenesis maps alleles to tune human T cell functions

Ralf Schmidt et al. Nature. 2024 Jan.

Abstract

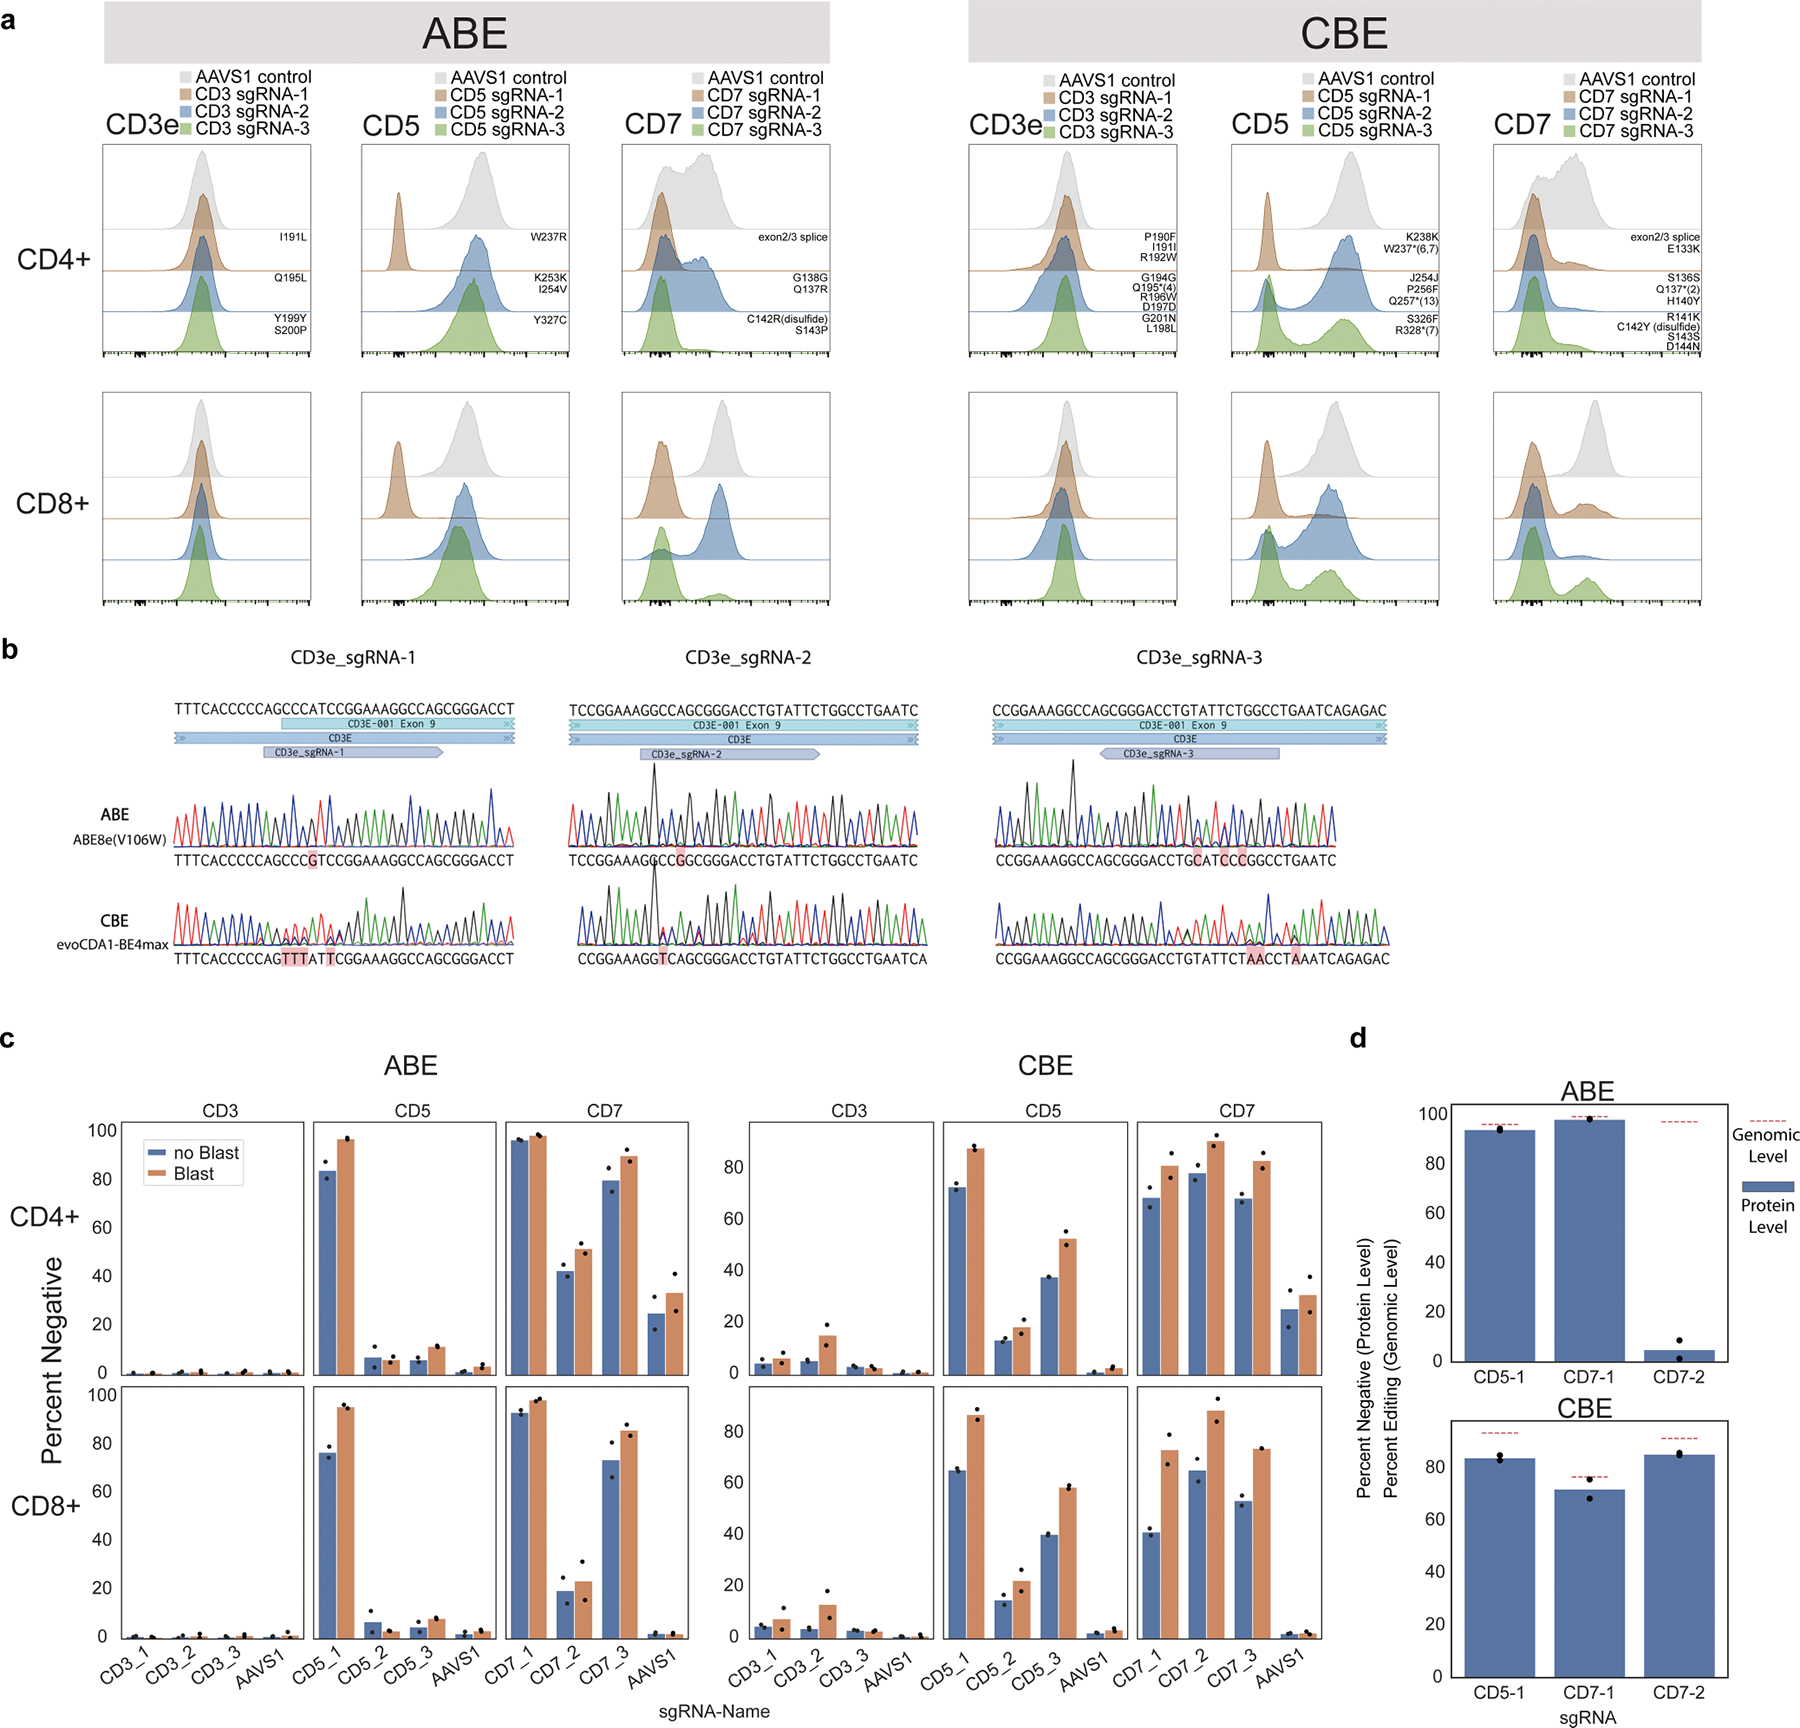
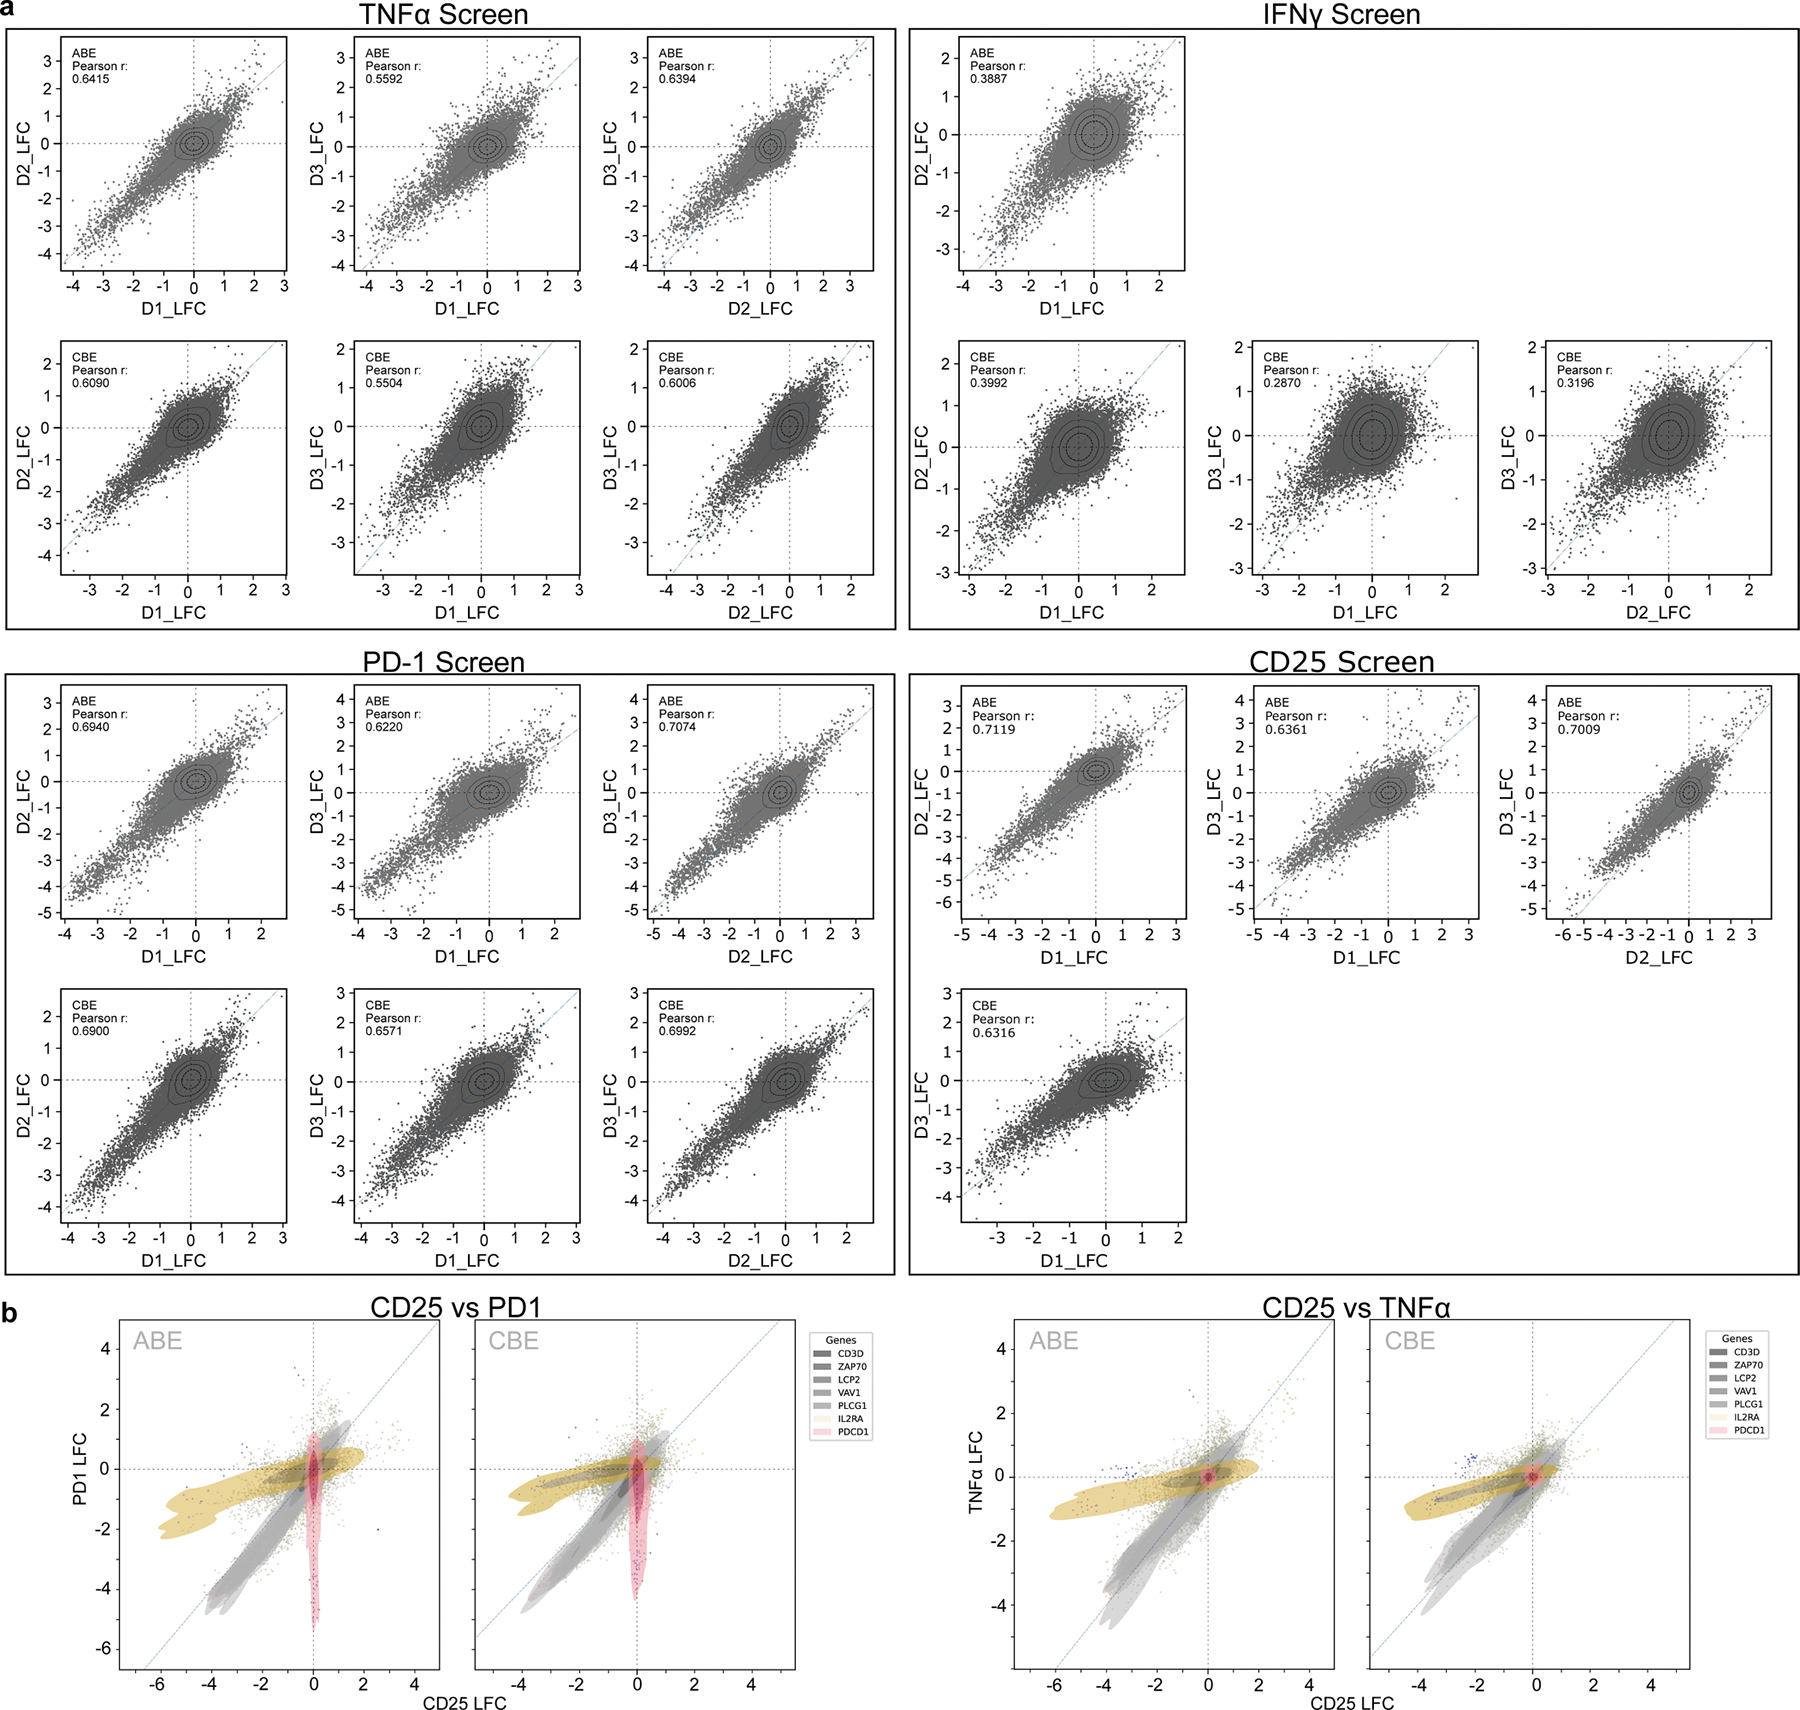
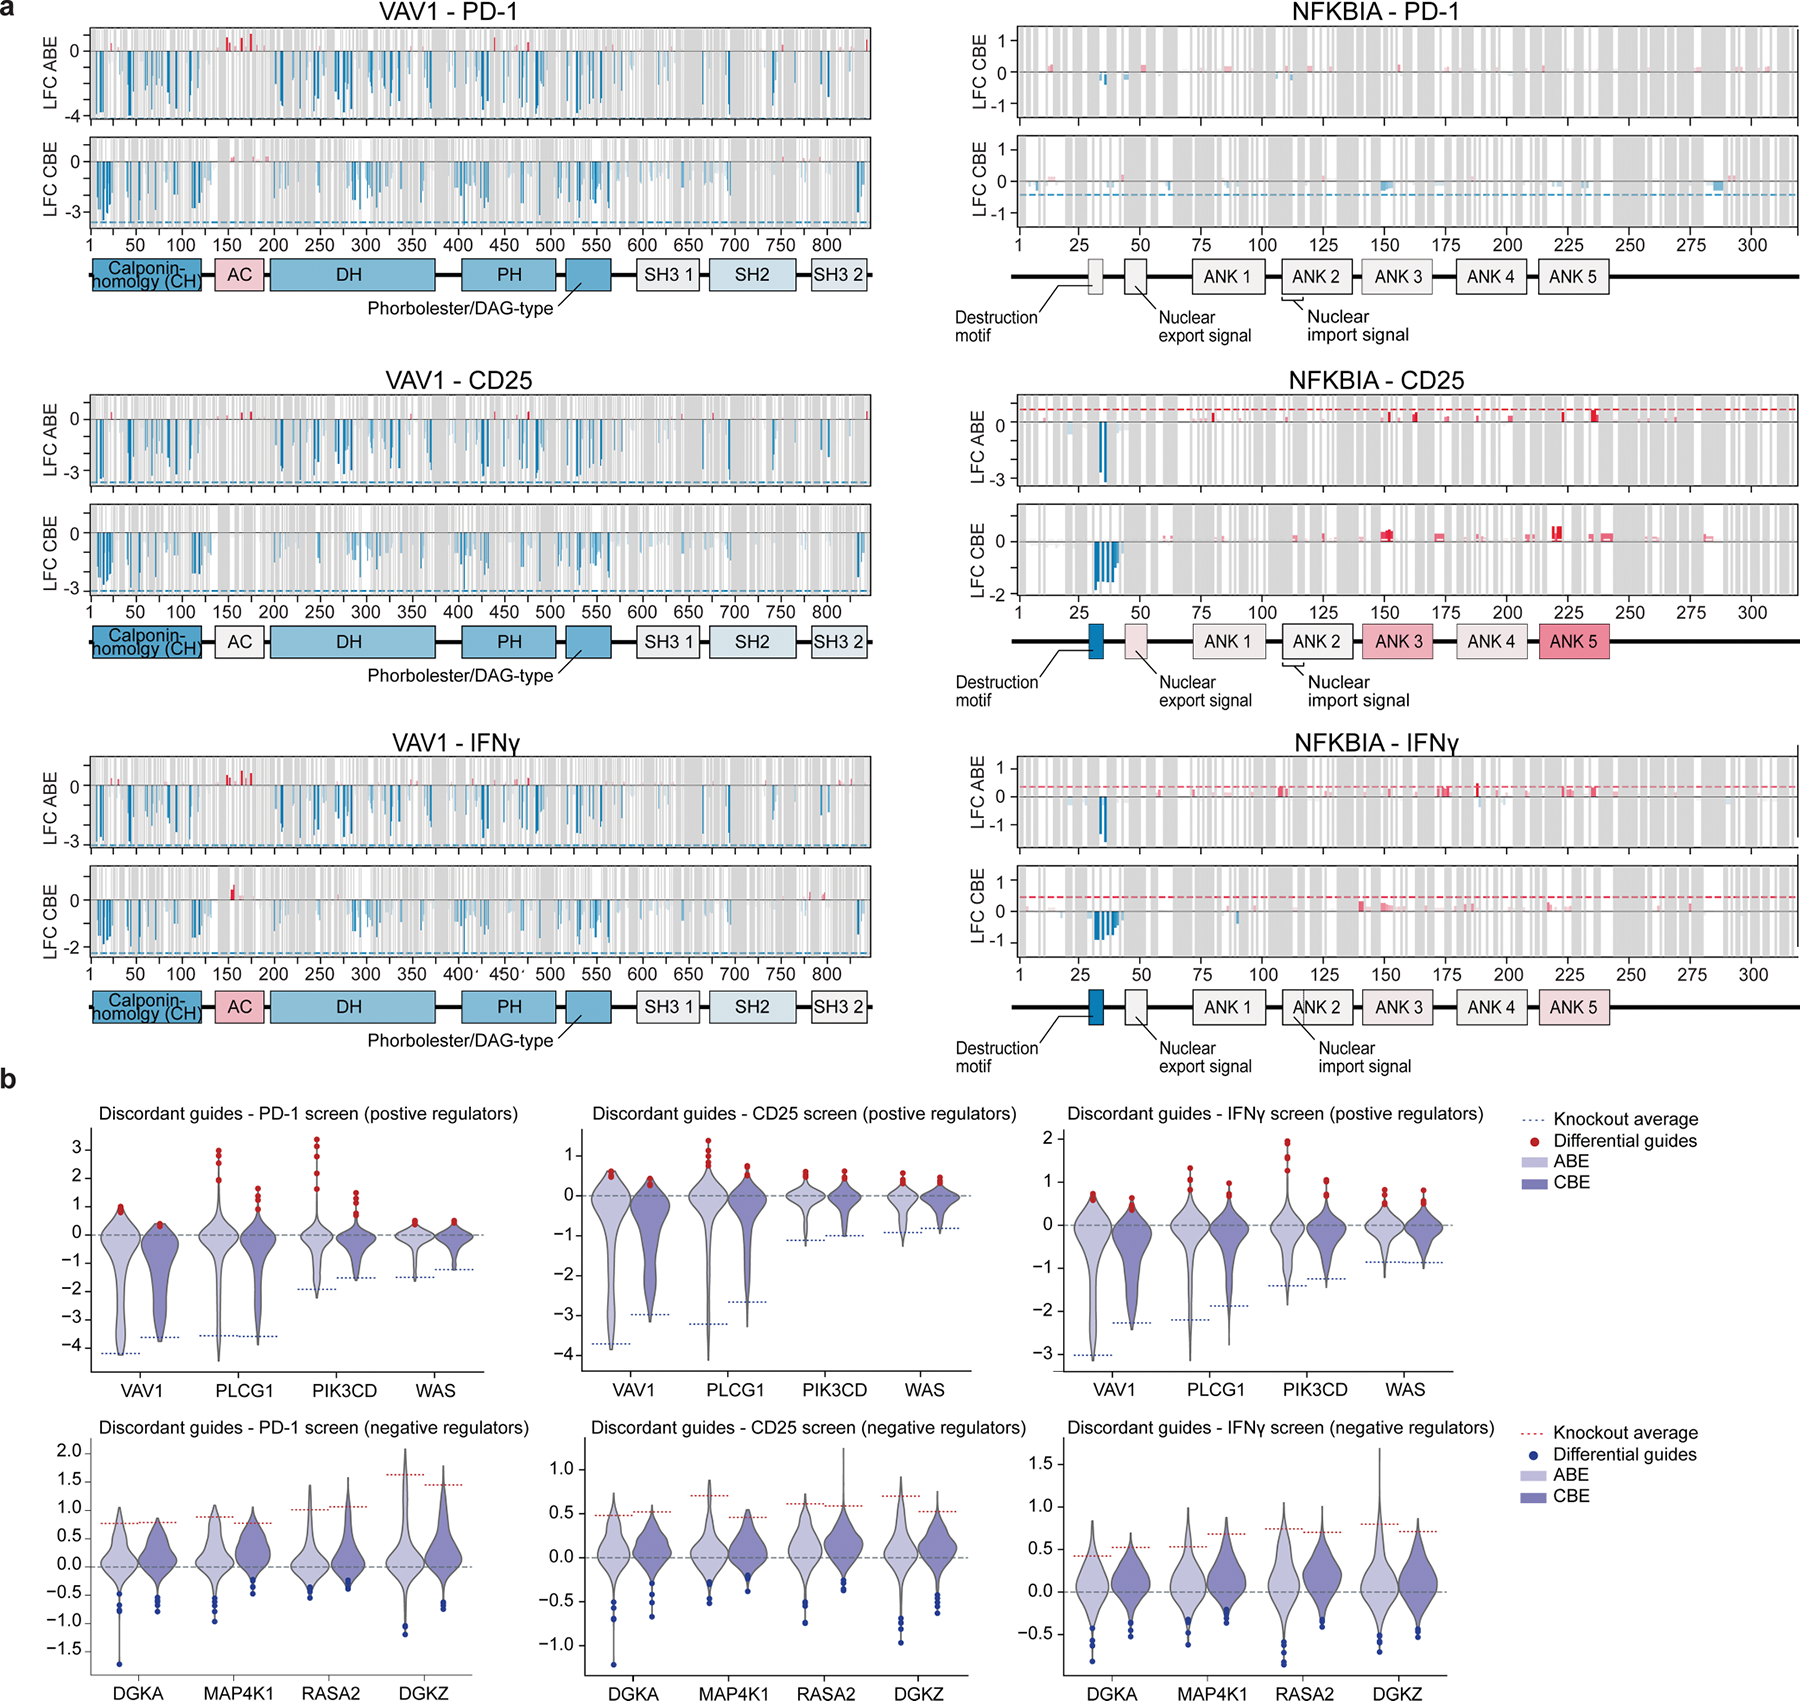
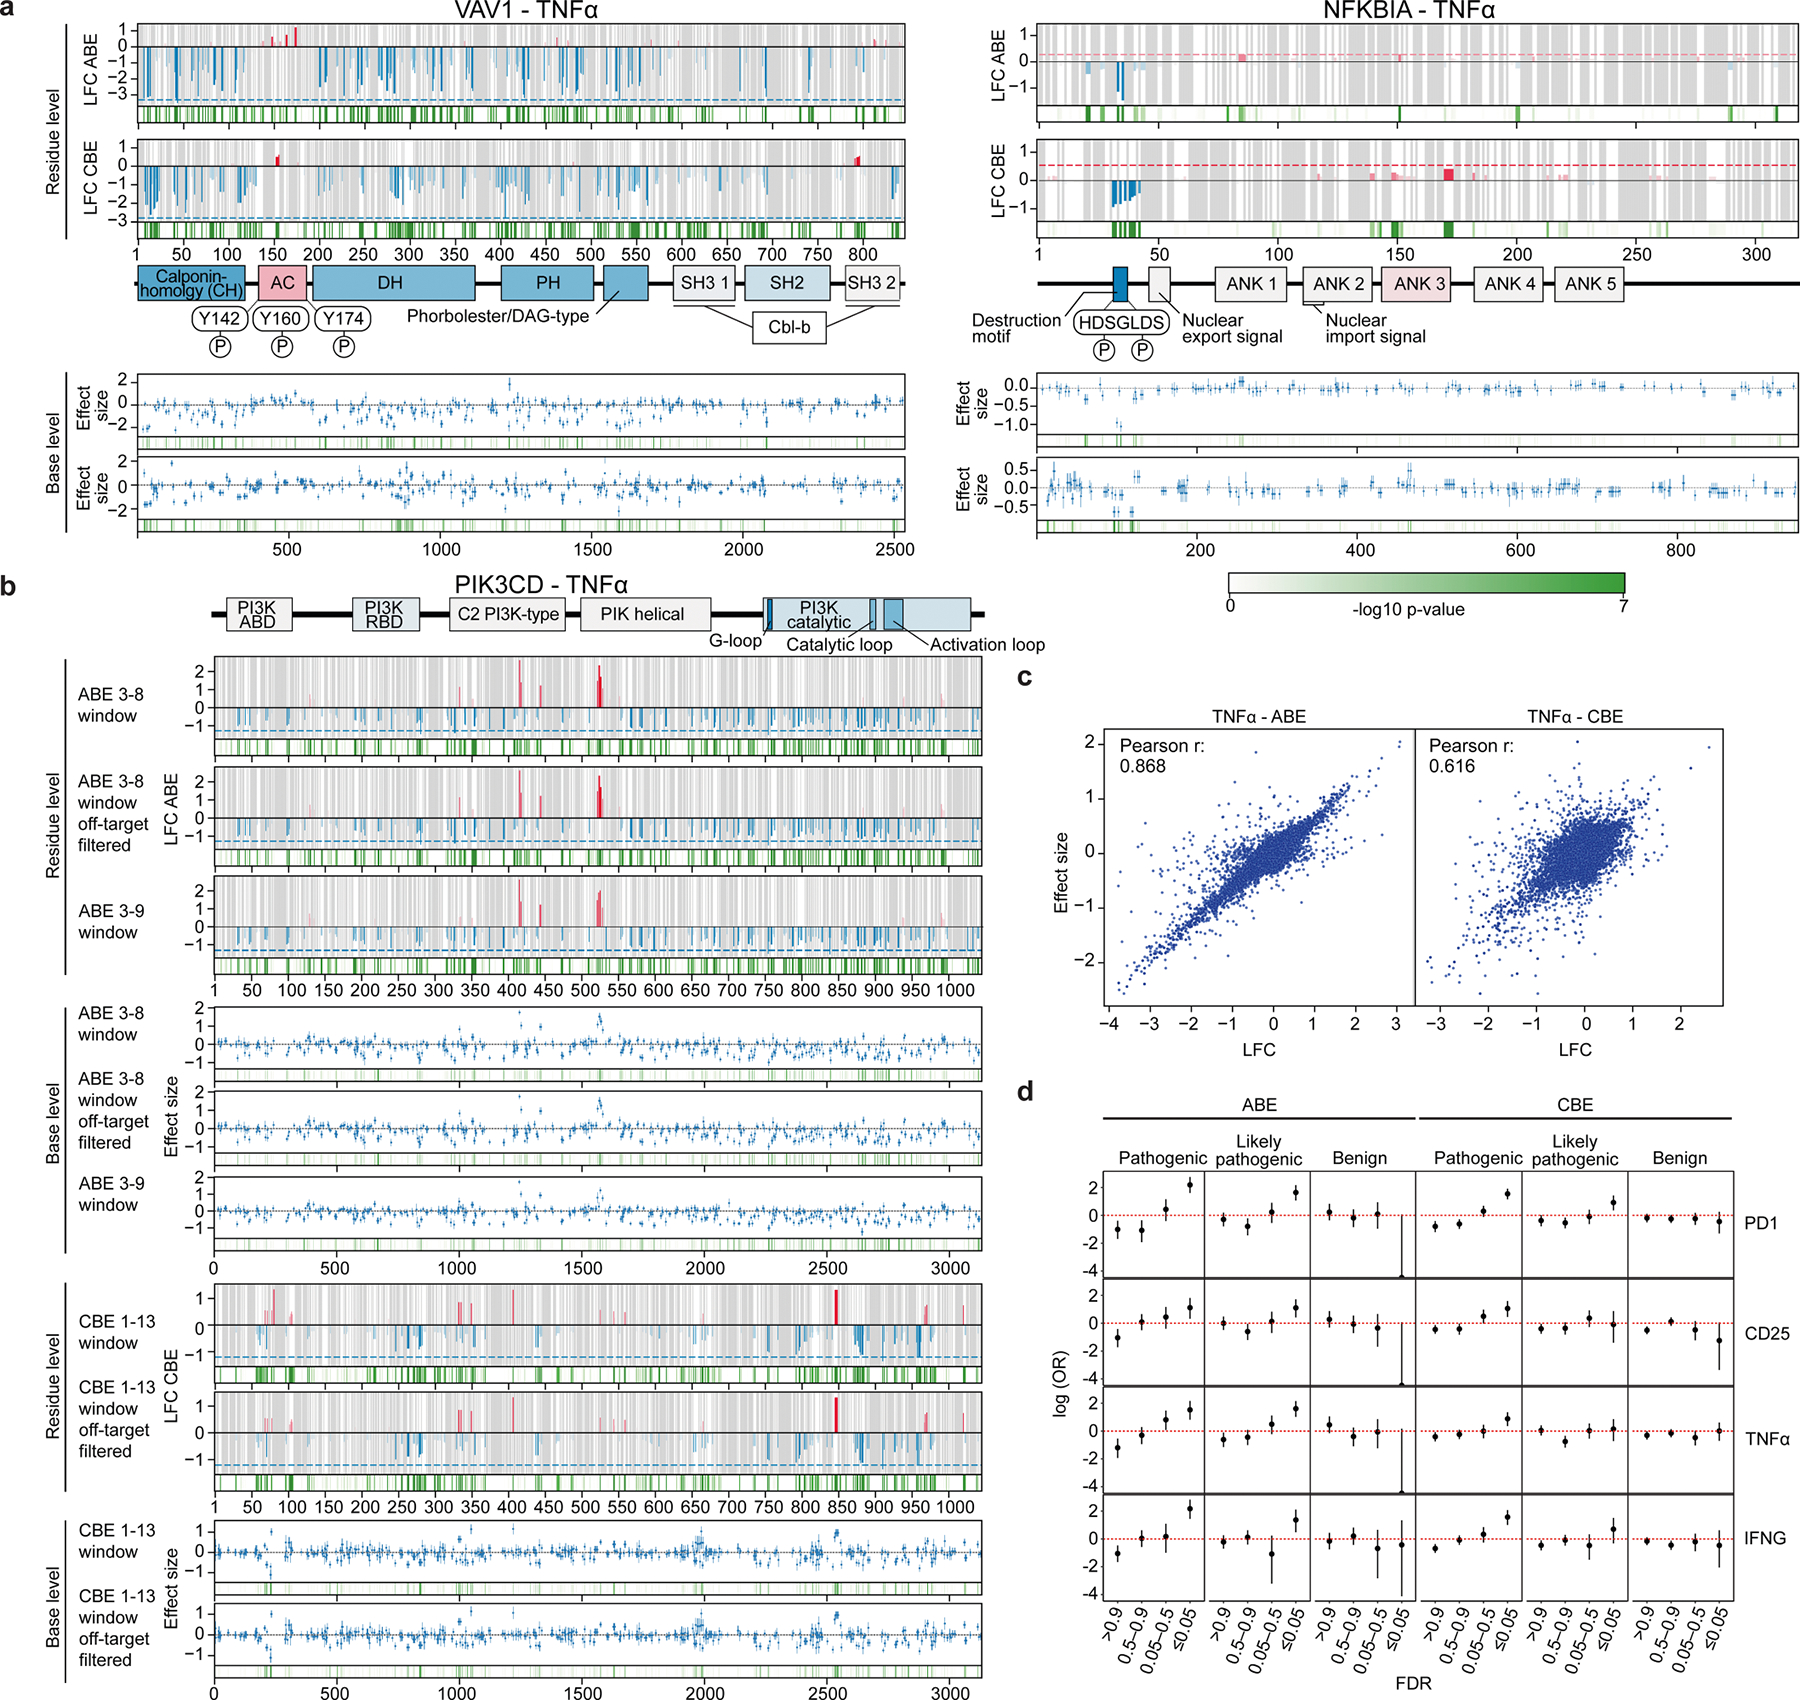
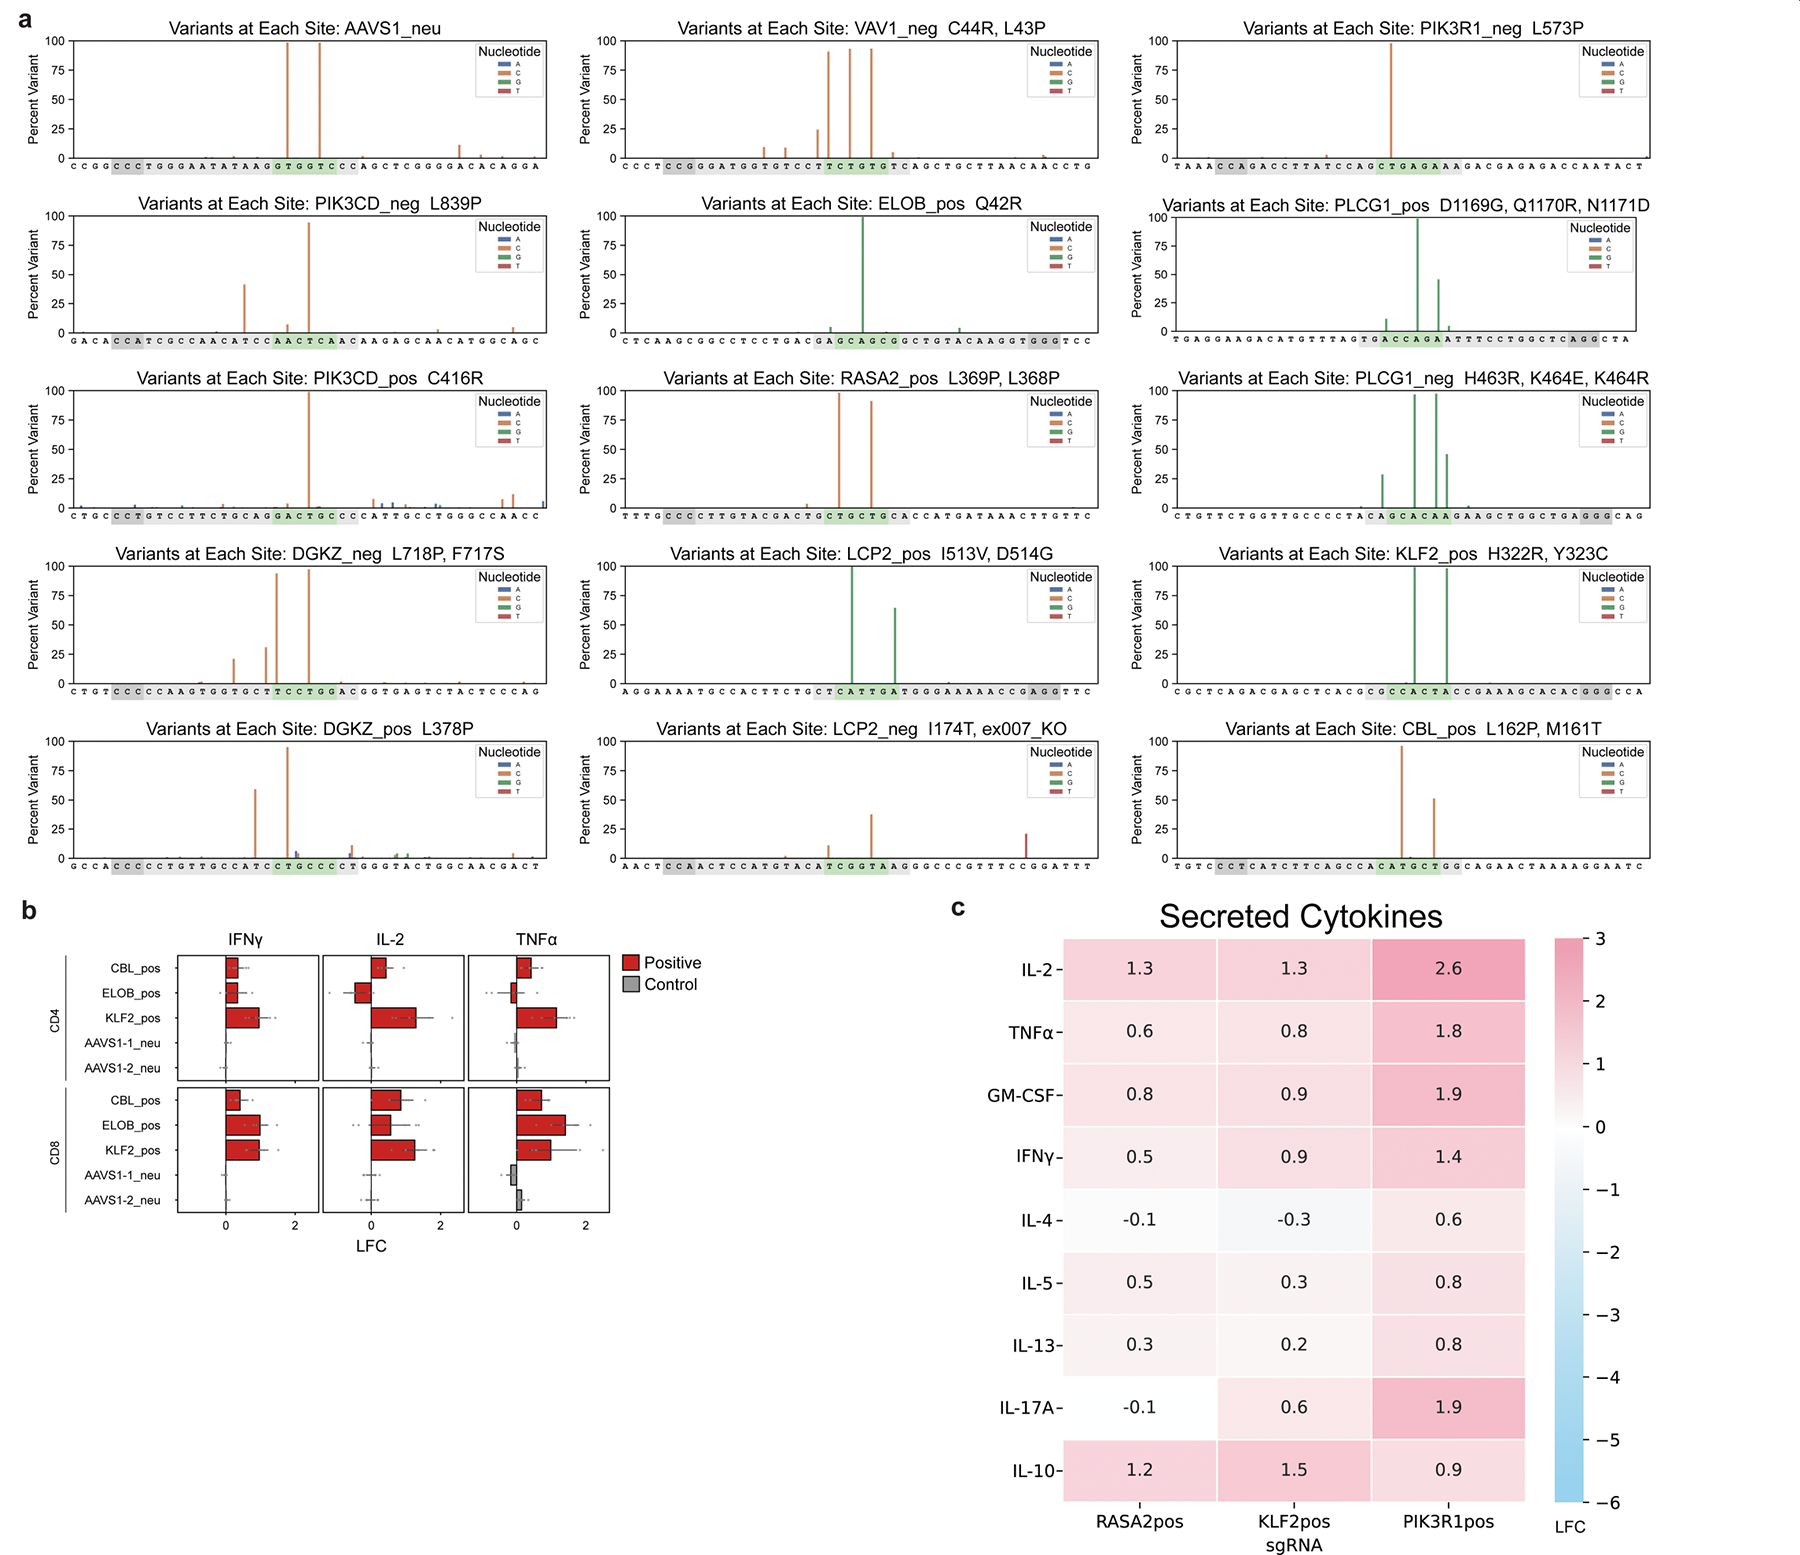
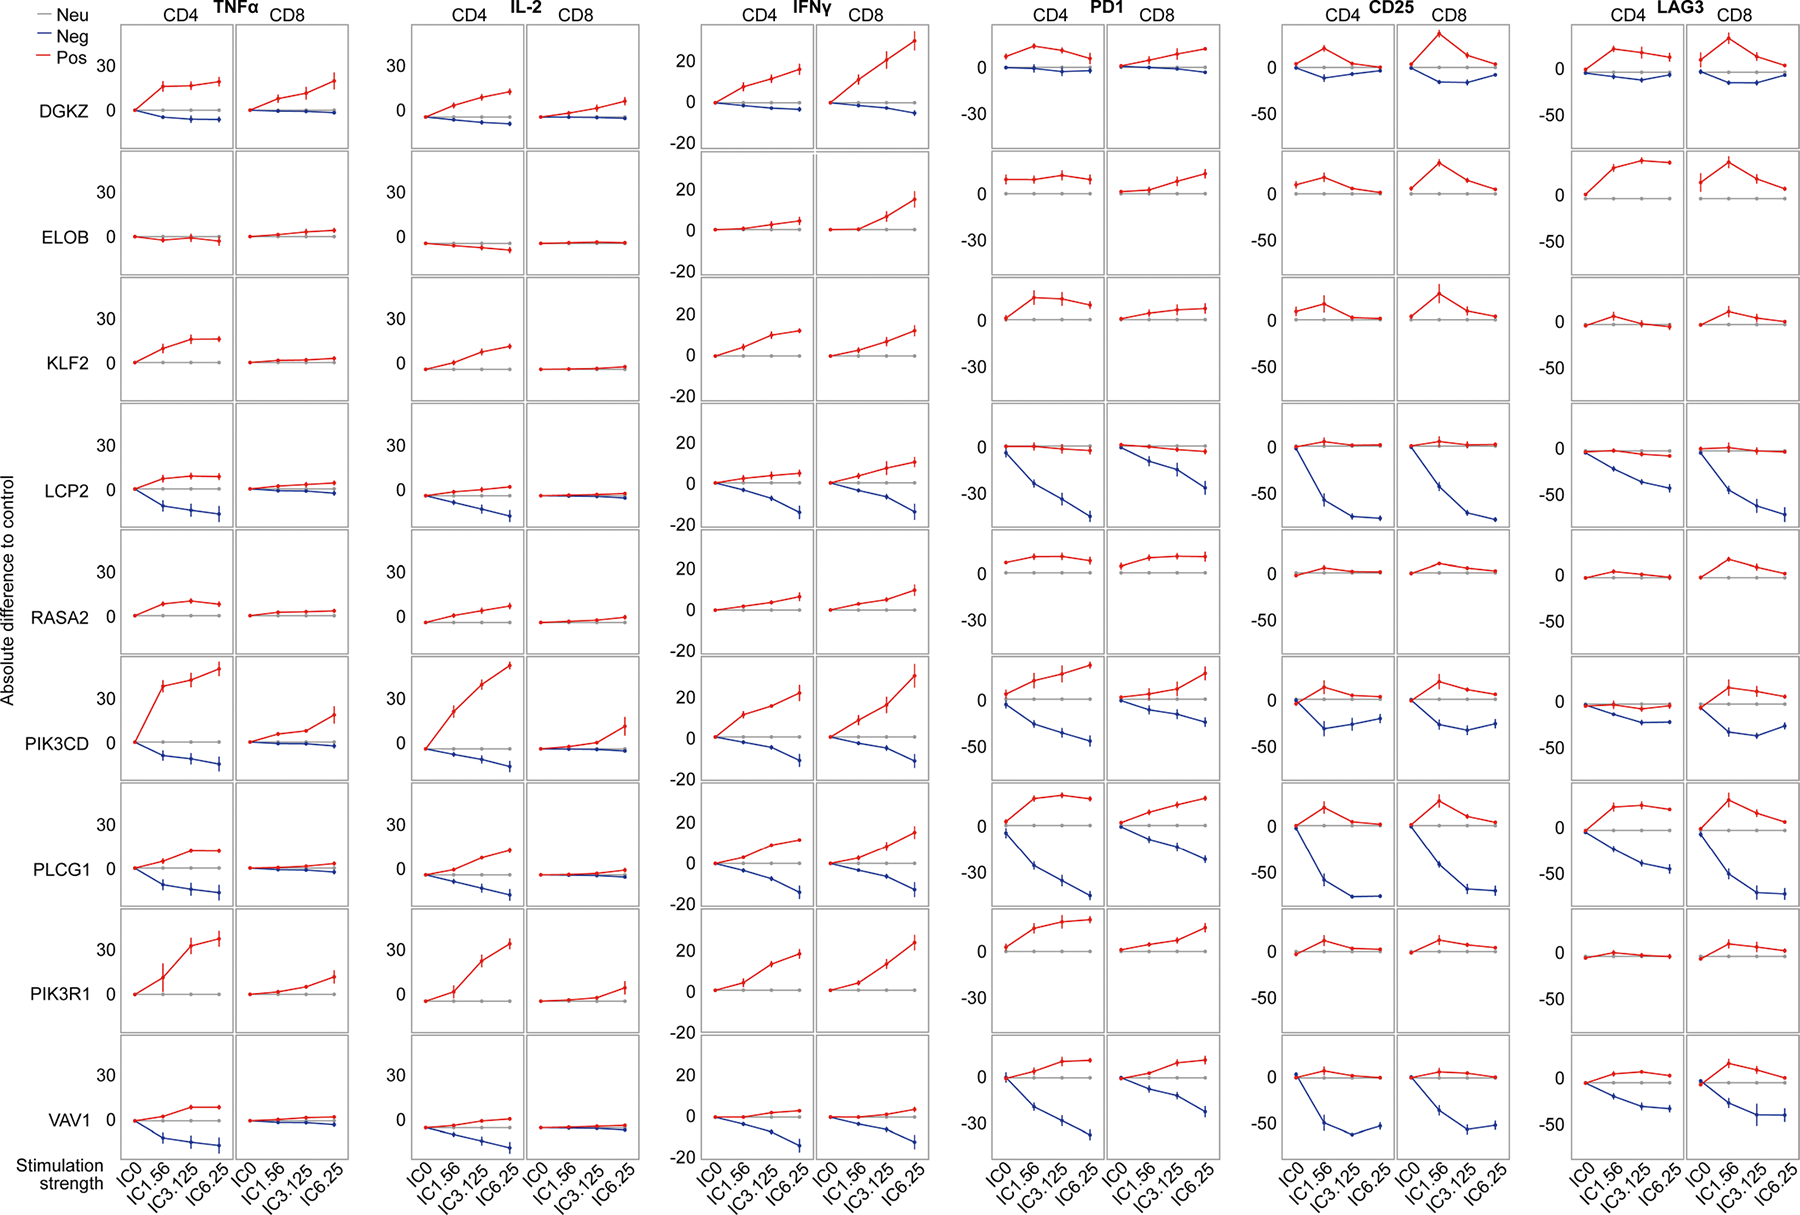
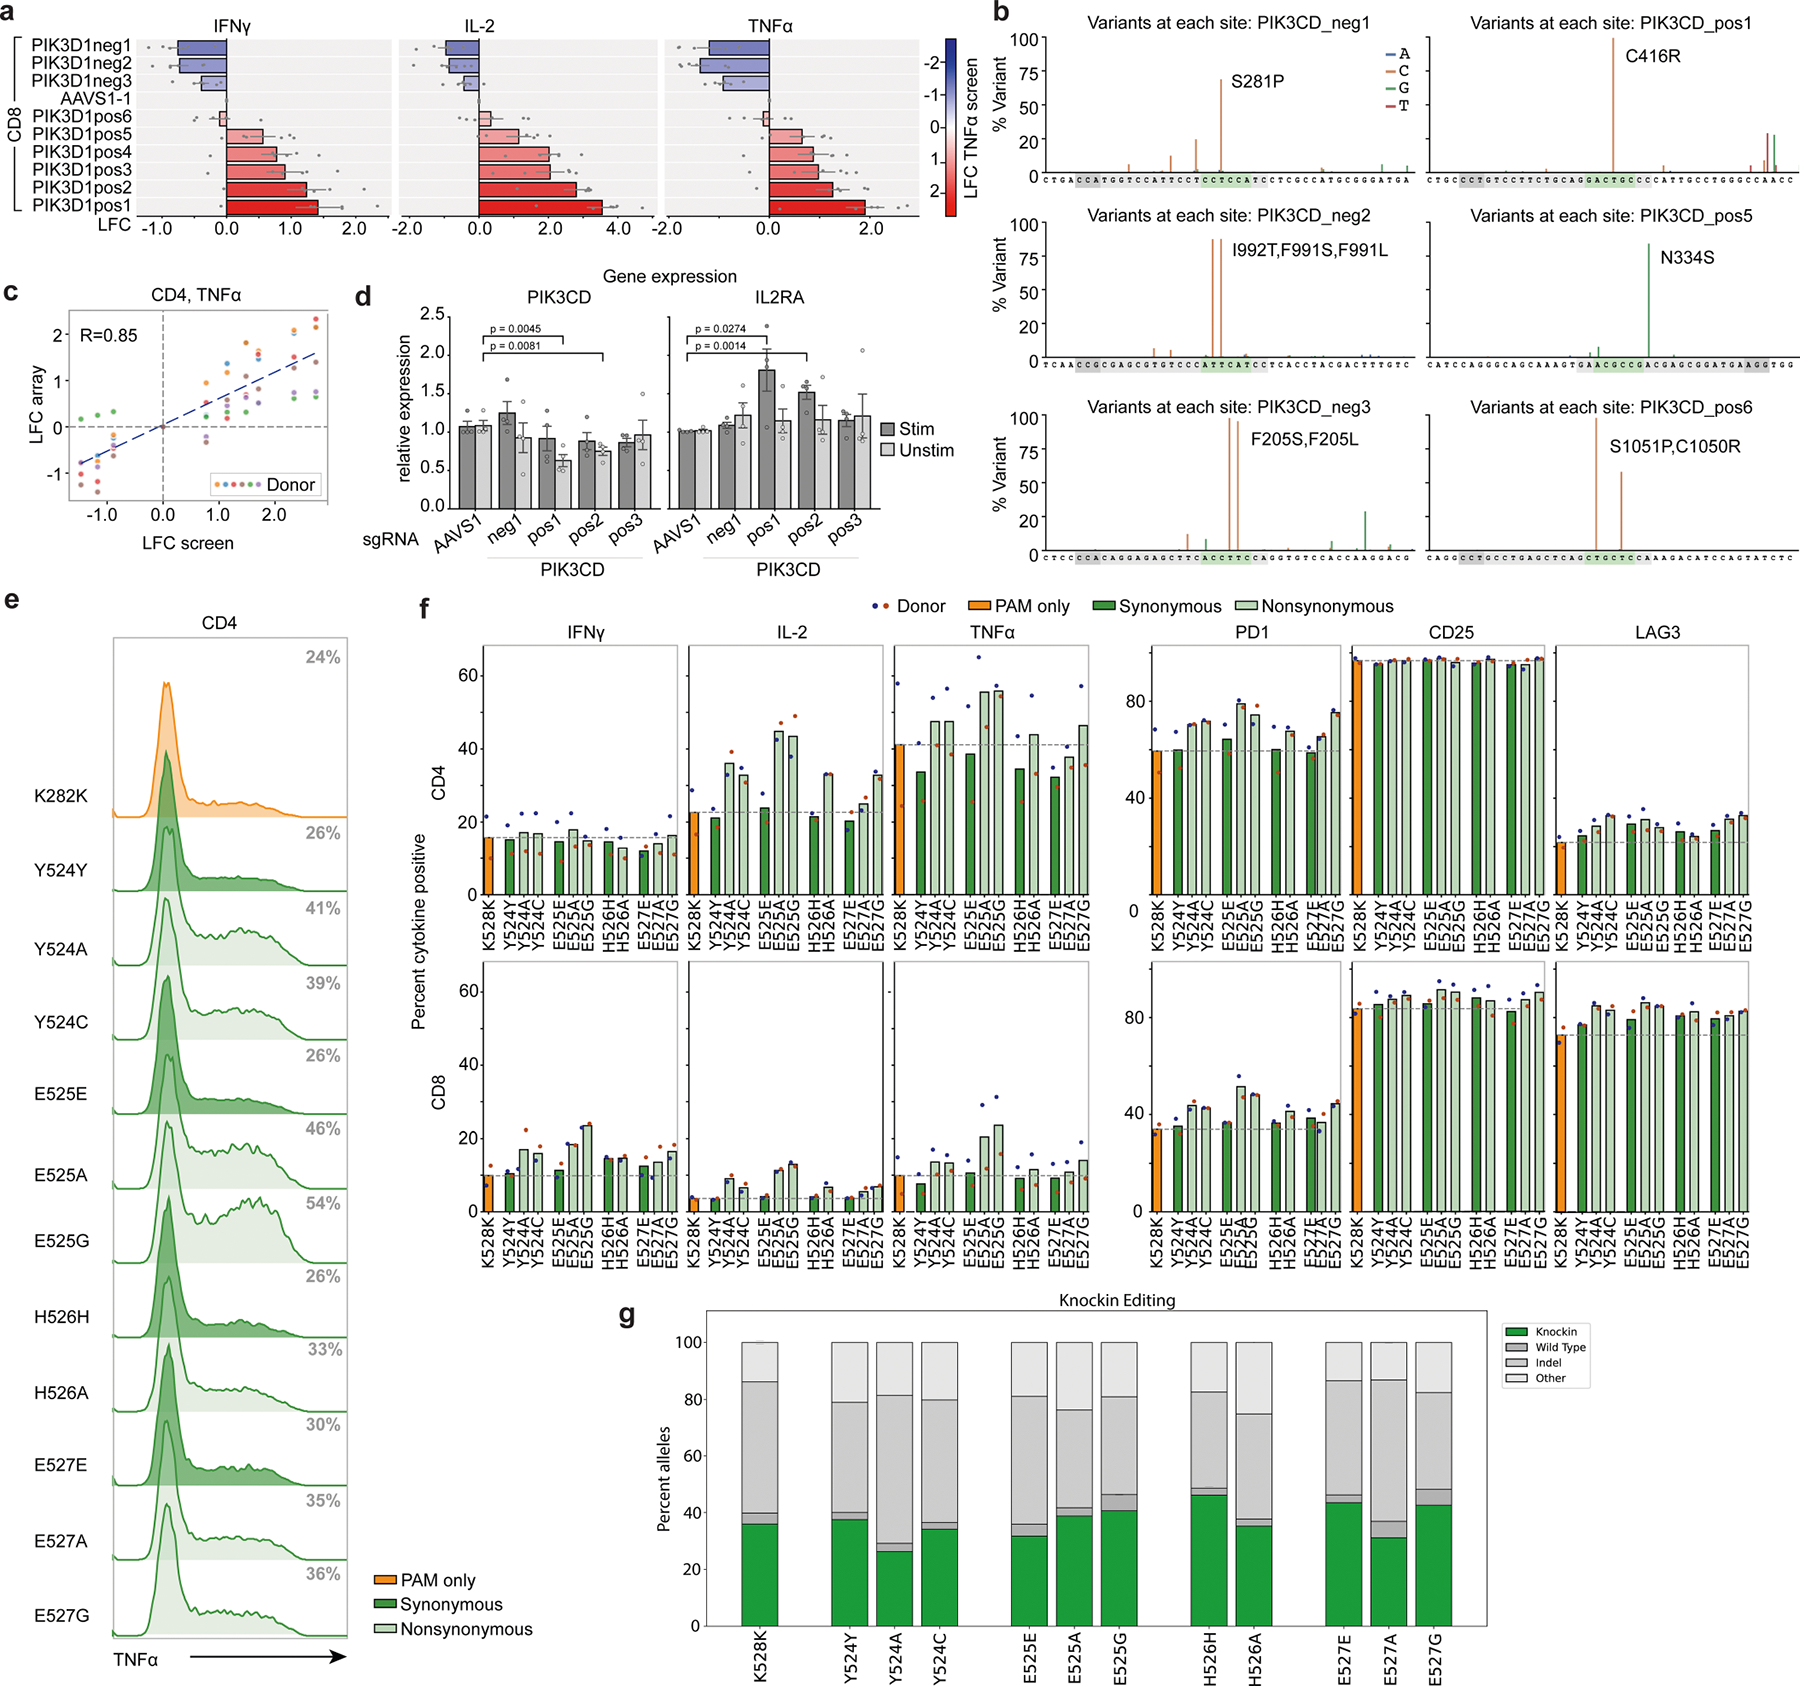
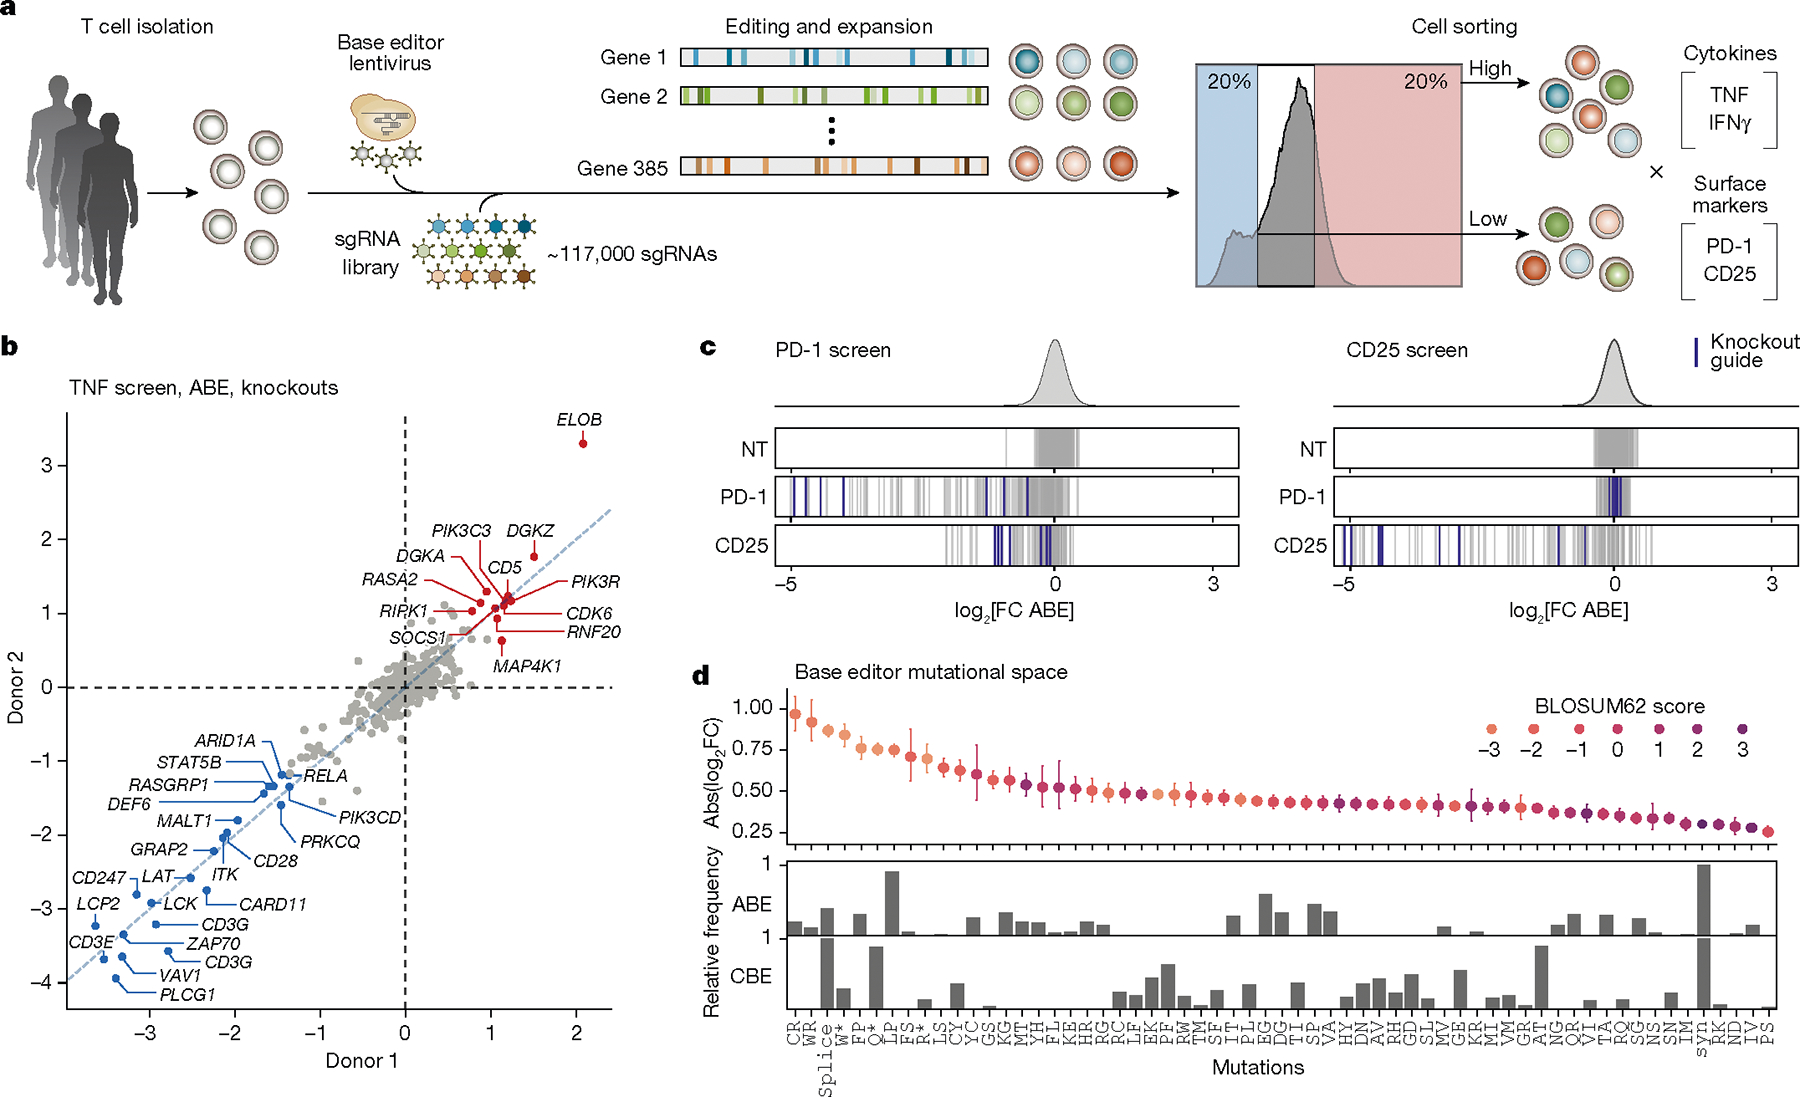
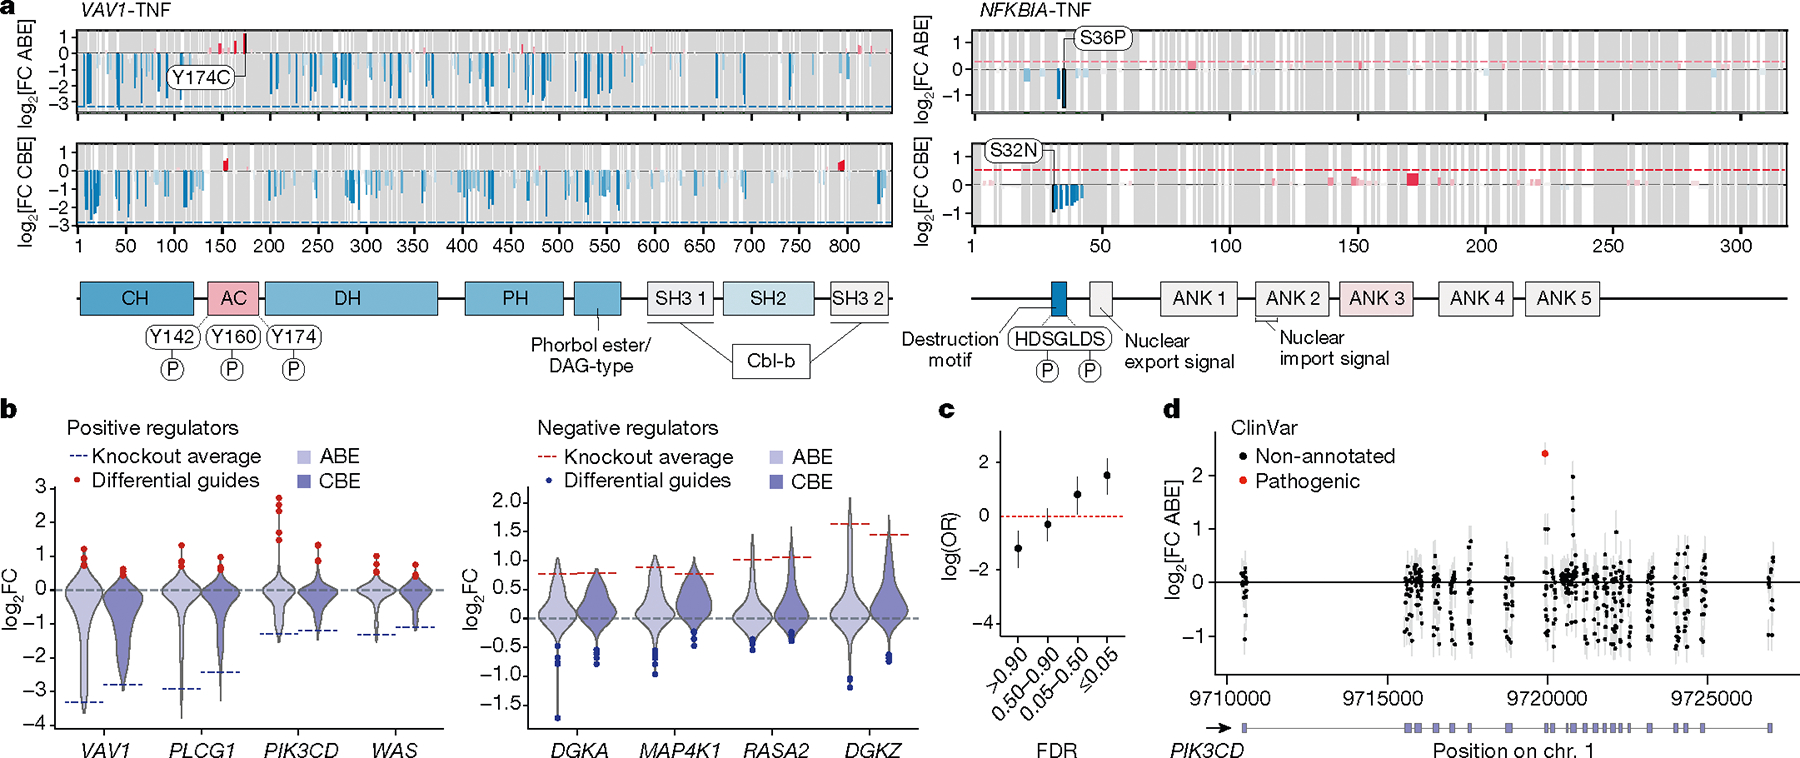
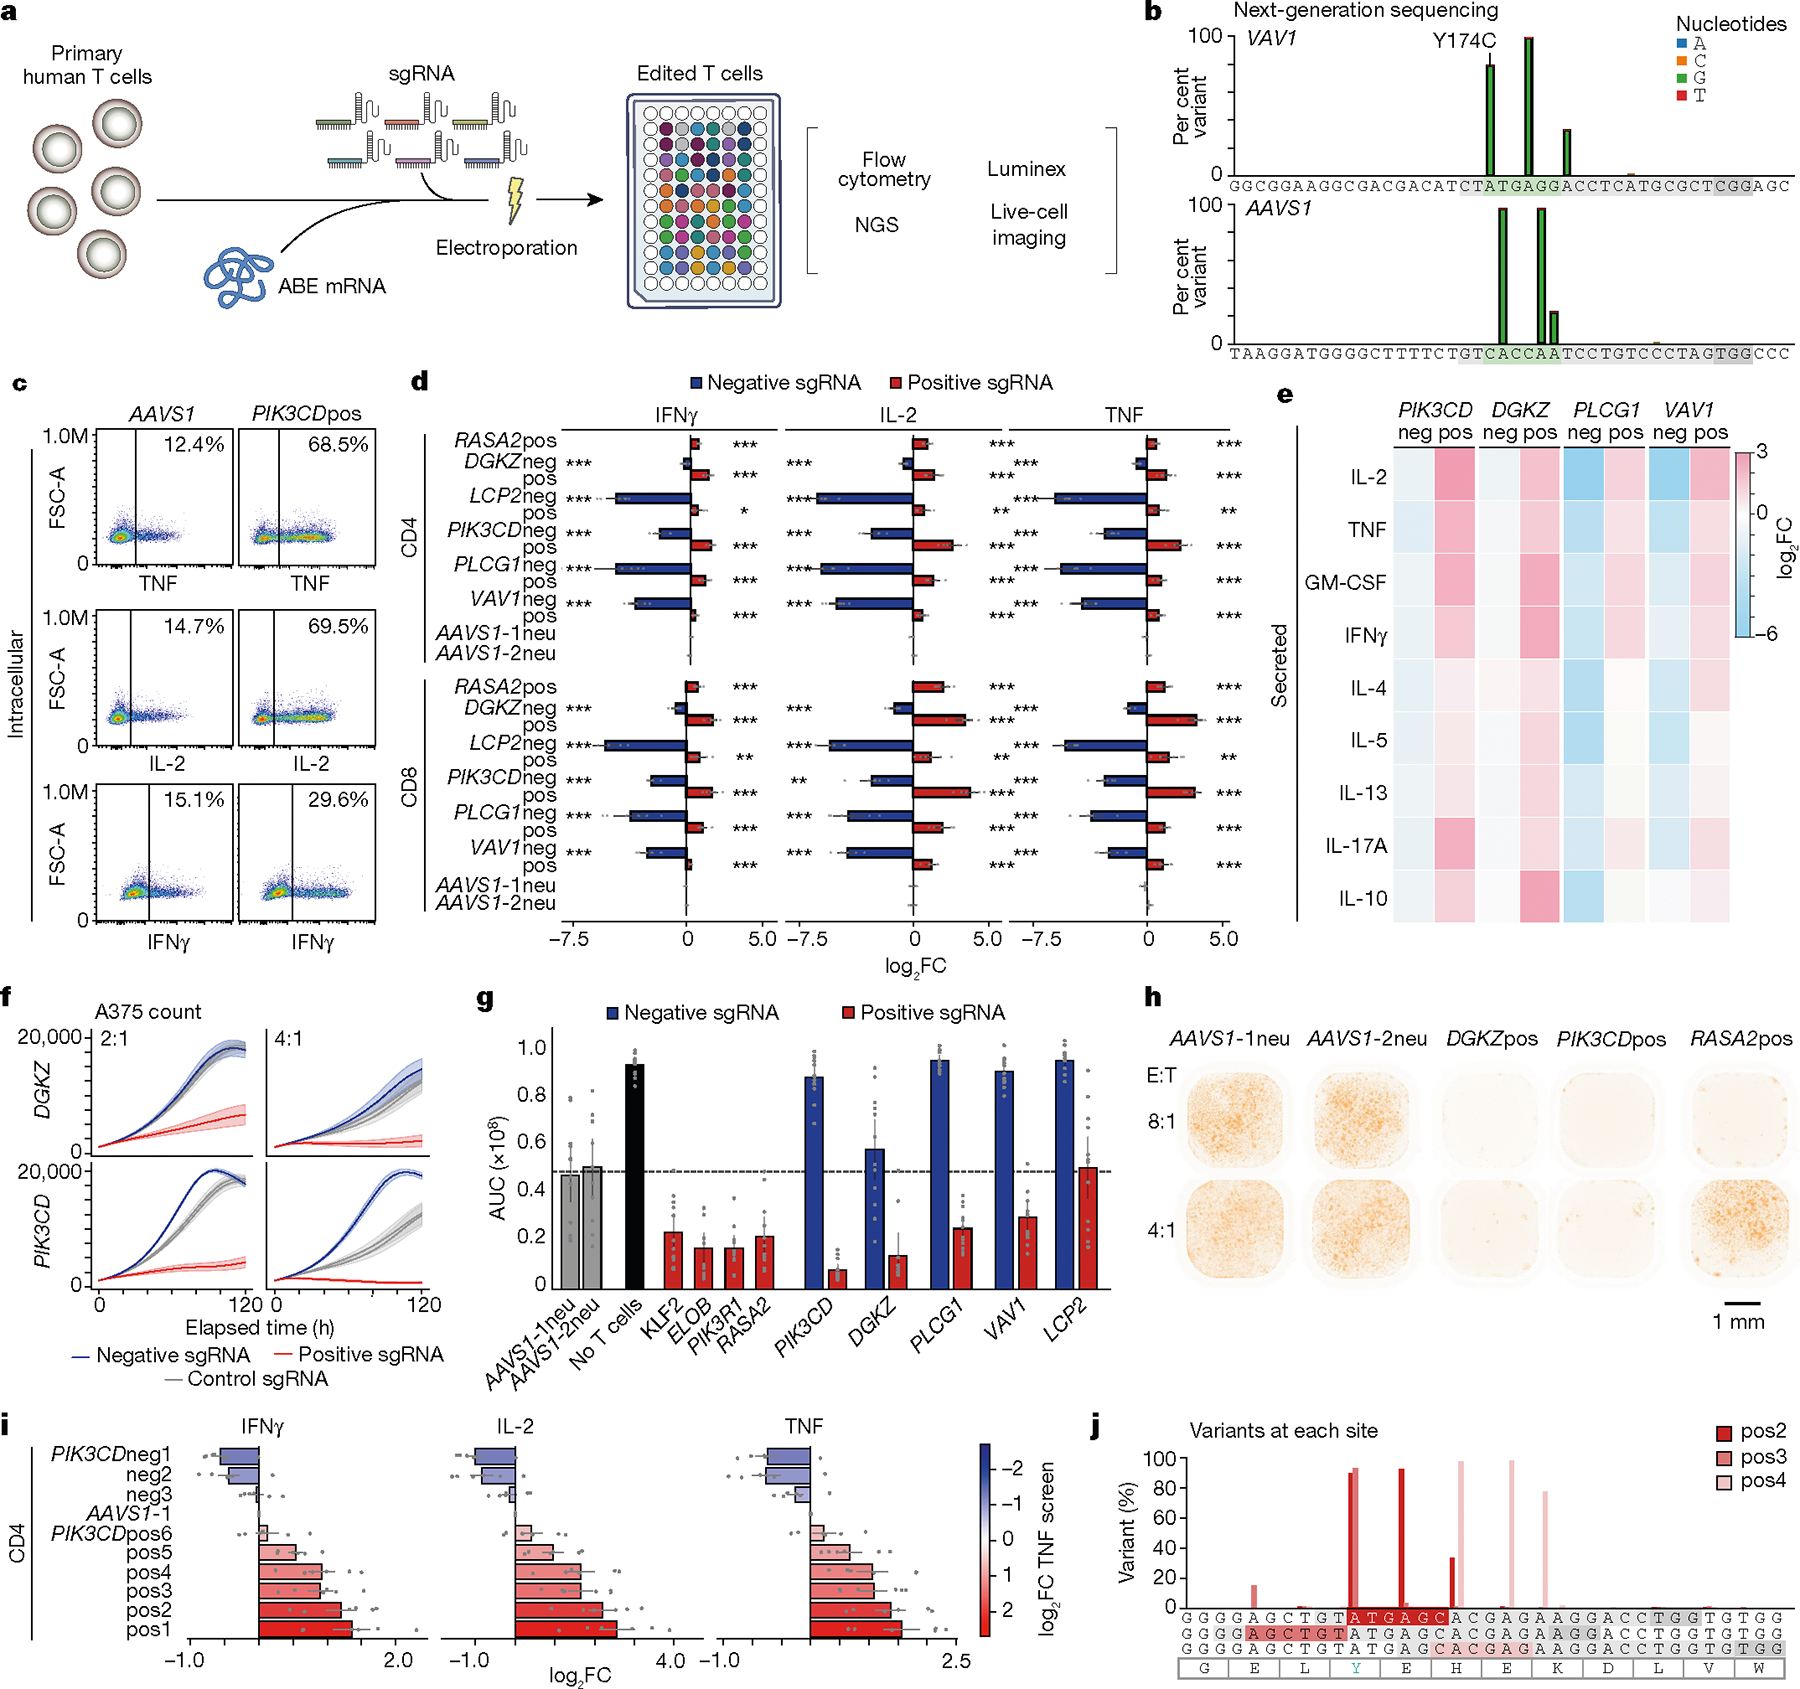
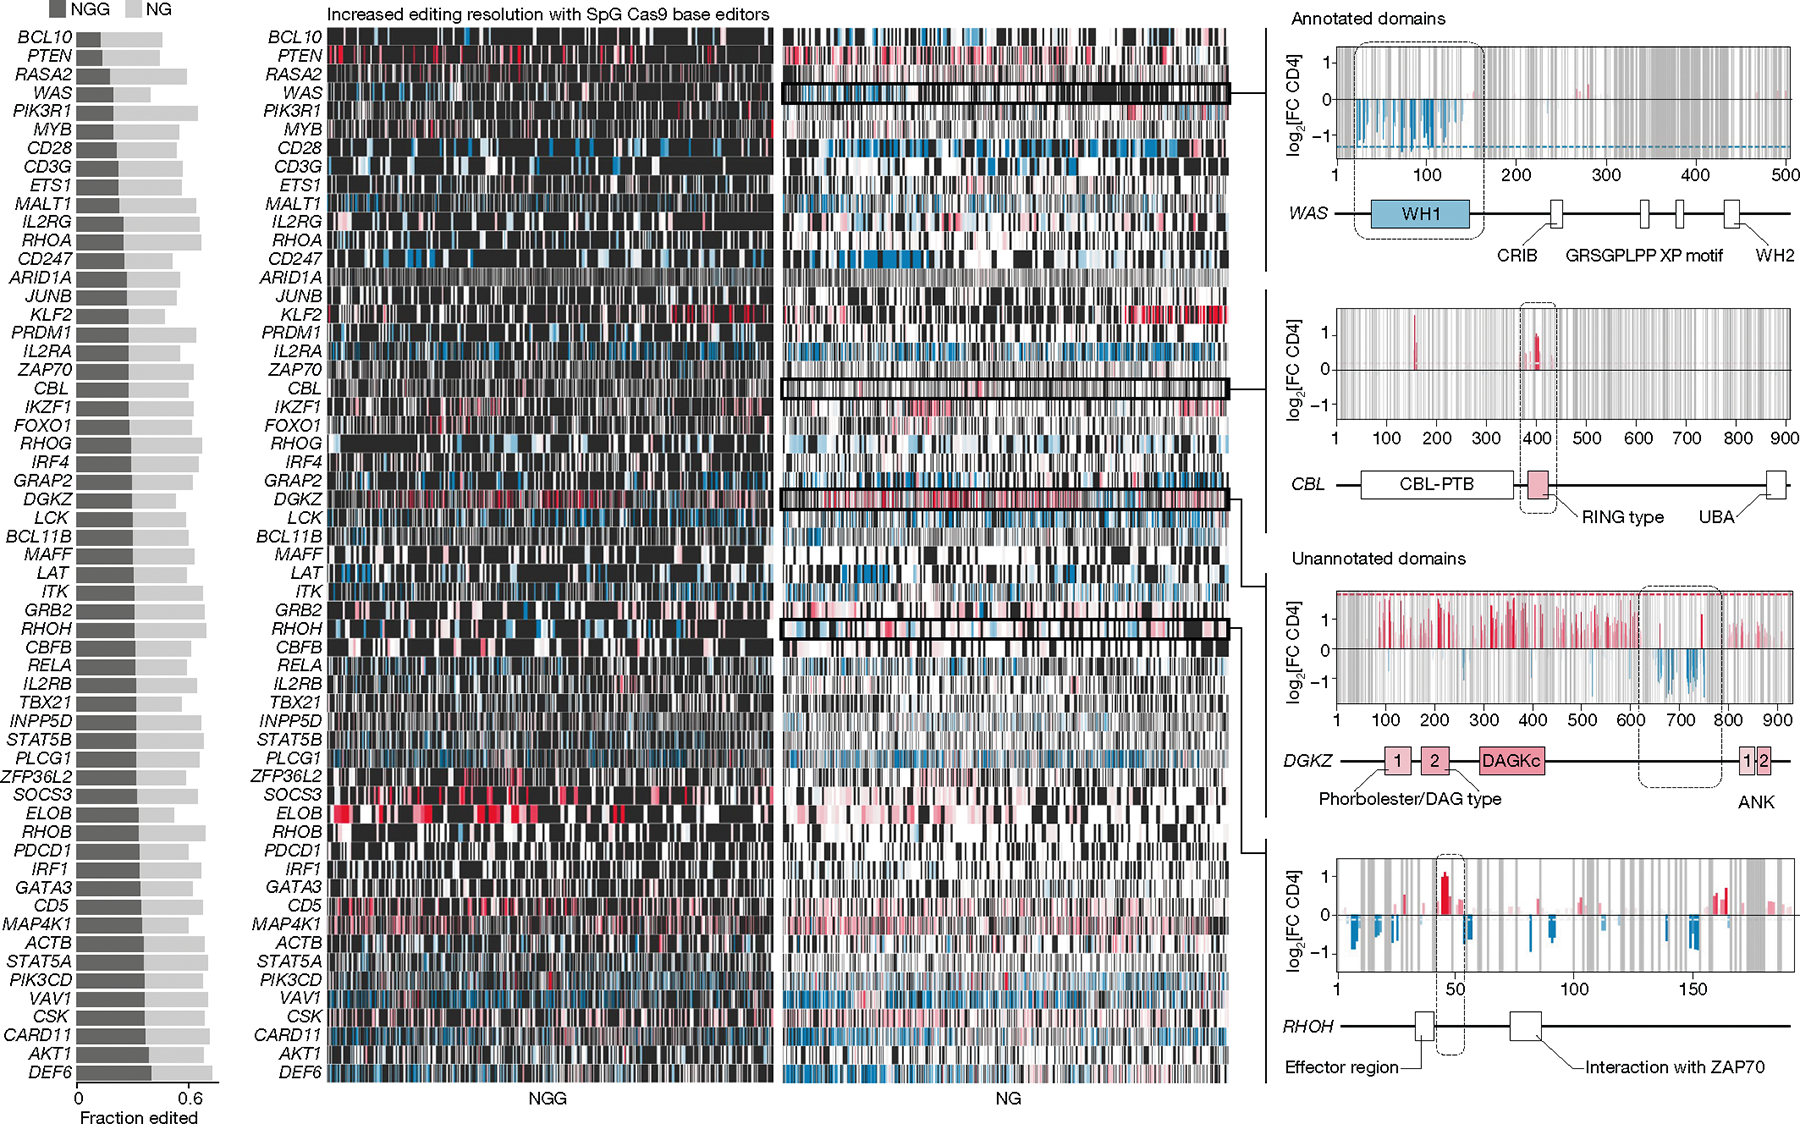
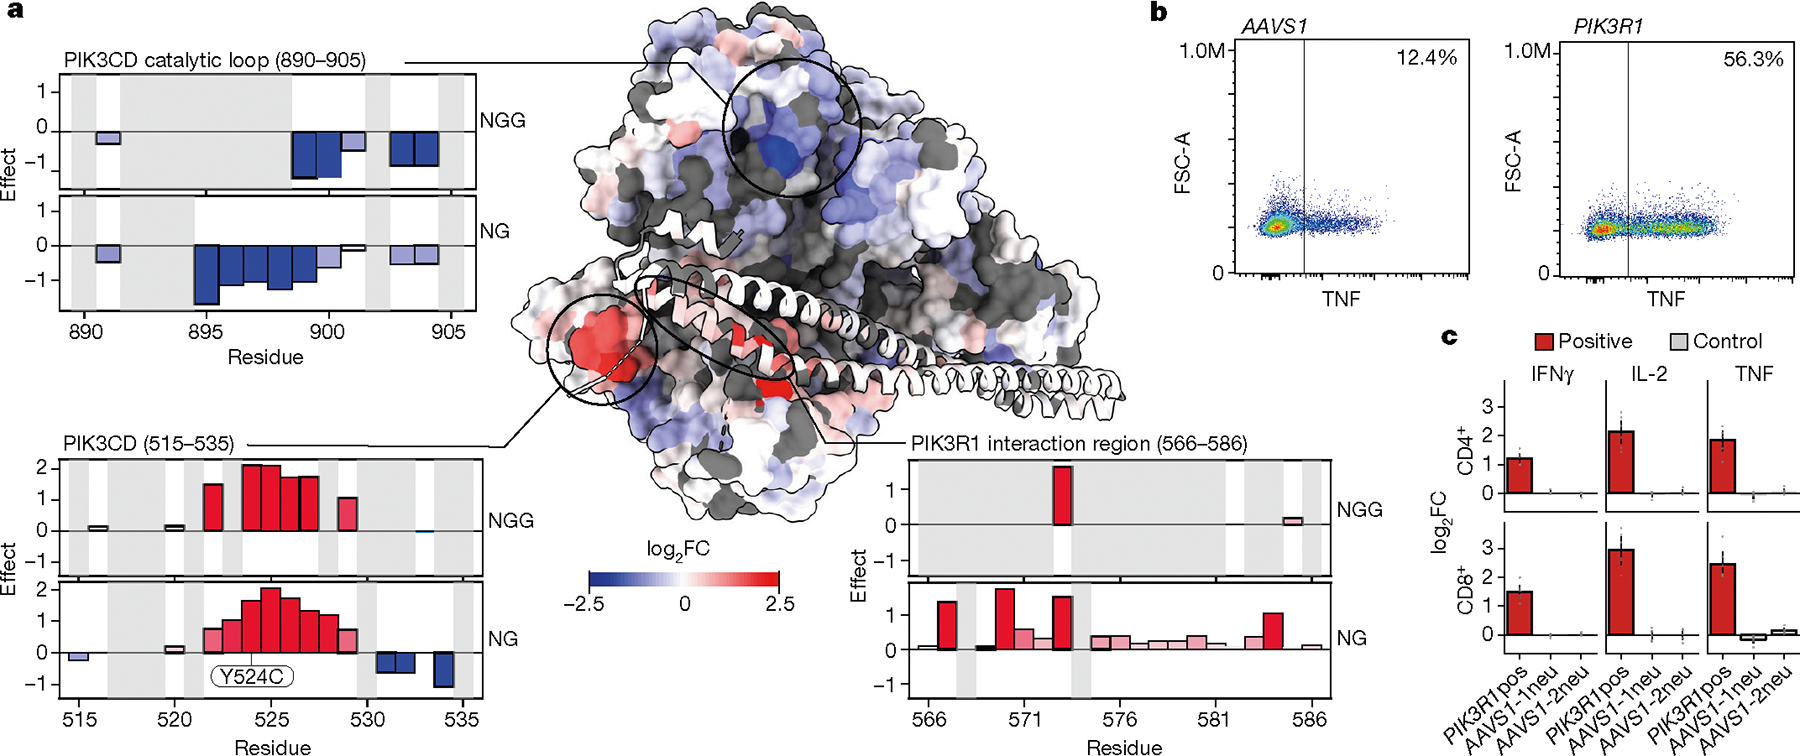
CRISPR-enabled screening is a powerful tool for the discovery of genes that control T cell function and has nominated candidate targets for immunotherapies1-6. However, new approaches are required to probe specific nucleotide sequences within key genes. Systematic mutagenesis in primary human T cells could reveal alleles that tune specific phenotypes. DNA base editors are powerful tools for introducing targeted mutations with high efficiency7,8. Here we develop a large-scale base-editing mutagenesis platform with the goal of pinpointing nucleotides that encode amino acid residues that tune primary human T cell activation responses. We generated a library of around 117,000 single guide RNA molecules targeting base editors to protein-coding sites across 385 genes implicated in T cell function and systematically identified protein domains and specific amino acid residues that regulate T cell activation and cytokine production. We found a broad spectrum of alleles with variants encoding critical residues in proteins including PIK3CD, VAV1, LCP2, PLCG1 and DGKZ, including both gain-of-function and loss-of-function mutations. We validated the functional effects of many alleles and further demonstrated that base-editing hits could positively and negatively tune T cell cytotoxic function. Finally, higher-resolution screening using a base editor with relaxed protospacer-adjacent motif requirements9 (NG versus NGG) revealed specific structural domains and protein-protein interaction sites that can be targeted to tune T cell functions. Base-editing screens in primary immune cells thus provide biochemical insights with the potential to accelerate immunotherapy design.


Conflict of interest statement

Competing interests A.M. is a co-founder of Function Bio, Arsenal Biosciences, Spotlight Therapeutics and Survey Genomics, serves on the boards of directors at Function Bio, Spotlight Therapeutics and Survey Genomics, was a board observer at Arsenal Biosciences, is a member of the scientific advisory boards of Function Bio, Arsenal Biosciences, Spotlight Therapeutics, Survey Genomics, NewLimit, Amgen, Tenaya, and Lightcast owns stock in Arsenal Biosciences, Spotlight Therapeutics, NewLimit, Survey Genomics, PACT Pharma, Tenaya, and Lightcast, and has received fees from Arsenal Biosciences, Spotlight Therapeutics, NewLimit, 23andMe, PACT Pharma, Juno Therapeutics, Tenaya, Lightcast, Trizell, Vertex, Merck, Amgen, Genentech, AlphaSights, Clearview Healthcare, Rupert Case Management, Bernstein, GLG, Survey Genomics, and ALDA. A.M. is an investor in and informal advisor to Offline Ventures and a client of EPIQ. C.W., S.E.D., R.S. and A.M. are shareholders of Function Bio. The Marson laboratory has received research support from Juno Therapeutics, Epinomics, Sanofi, GlaxoSmithKline, Gilead, and Anthem. J.E. is a compensated co-founder at Mnemo Therapeutics. J.E. owns stocks in Mnemo Therapeutics and Cytovia Therapeutics. J.E. is a compensated scientific advisor for Enterome, Treefrog Therapeutics and Resolution Therapeutics. The Eyquem lab has received research support from Cytovia Therapeutic, Mnemo Therapeutics and Takeda. J.E. is a holder of patents pertaining to but not resulting from this work. L.A.G. has filed patents on CRISPR approaches and is a co-founder of Chroma Medicine. R.S., C.W. and A.M. are listed as inventors on patent applications related to this work. The other authors declare no competing interests.

Figures

Extended Data Fig. 1 |
Extended Data Fig. 1 |. Optimization and assessment of base editing efficacy in primary human T cells.
a, Distribution of protein surface expression levels for CD3e, CD5, or CD7 in CD4+ or CD8+ T cells base edited with three sgRNAs targeting each gene or AAVS1 control with ABE (left) and CBE (right). Predicted mutations for each guide are annotated above each distribution in the CD4+ plots. n = 2 independent donors. b, Sanger sequencing traces for ABE and CBE editing using the three CD3e sgRNAs for both ABE and CBE. Consensus sequences are in black above and detected BE mutations are highlighted in red under traces. c, Summary boxplots of T cell editing outcomes expressed as % cells negative for CD3, CD5, or CD7 protein expression using the guides in (a), with (Blast) or without (noBlast) blasticidin selection. n = 2 independent donors. d, Protein level and genomic level editing for efficient sgRNAs targeting CD5 and CD7, shown as percent negative (flow cytometry, protein level) and percent edited (NGS, genomic level). Genomic level editing was analyzed with CRISPResso2. n = 2 independent donors for protein-level assessment and 1 matching donor for genomic-level assessments.
Extended Data Fig. 2 |
Extended Data Fig. 2 |. ABE and CBE screens are reproducible across human donors.
a, Scatter plots showing LFC (log2-fold changes) of pairwise donor-to-donor correlations (high/low bins) for each screen. Three human donors were used for all screens except the IFNγ-ABE and CD25-CBE screens, where two were used for analyses. Pearson correlation coefficient is given for each comparison. b, Comparison of sgRNA level effect sizes between CD25 and PD1 screens (left) or CD25 and TNFα screens (right), shown as LFC (log2-fold changes, high/low bins).
Extended Data Fig. 3 |
Extended Data Fig. 3 |. Base edits with strong functional effects are enriched in structured regions of proteins.
Scatter plot showing the correlation between AlphaFold predicted local Distance Difference Test (pLDDT) scores and screen LFC (log2-fold changes) for residues in proteins whose genes had |LFC | > 1.0 in the TNFα screen. Lower (<50) AlphaFold pLDDTs scores are predictive of structurally disordered regions of proteins. Predictions were obtained from pre-computed AlphaFold structures for canonical UniProt accessions for each screen gene.
Extended Data Fig. 4 |
Extended Data Fig. 4 |. Tiling base edits reveal mutations with discordant effects across screens.
a, Average effects (LFC, log2-fold changes) of non-synonymous, non-terminating base edits at each residue (ABE, top; CBE, bottom) on PD-1, CD25 expression, and IFNγ production are plotted across open reading frames encoding VAV1 (left) and NFKBIA (right). The dotted line indicates the average log2-fold change of the top 3 terminating (knockout) guides in the first half of the coding sequence, with blue for negative effect and red for positive effect on TNFα levels. Annotated domains from UniProt are shown below and are colored by the average effect of guides targeting those regions. b, Violin plots show distribution of log2-fold changes of CBE (dark purple) and ABE (light purple) guides tiling positive (top) and negative (bottom) regulator genes of PD-1, CD25 expression, and IFNγ production. Dotted lines indicate the average log2-fold change of the top 3 terminating (knockout) guides in the first half of the coding sequence. Blue and red dots indicate guides with strongly opposing effects with respect to the knockout guides for the same gene.
Extended Data Fig. 5 |
Extended Data Fig. 5 |. Comparative analysis of residue vs. base-level analysis and correlation to clinical variants.
a, Comparison between residue-level analysis derived from average LFC (log2-fold change) and base-level analysis derived from a multiple regression model for VAV1 and NFKBIA. For residue-level: p values were derived with Fisher’s method from MAGeCK results for individual guides; for base-level: p values were derived from a two-sided Wald test. b, Residue-level and base-level analysis for PIK3CD showing comparisons when guides with high off-target scores are filtered from analysis as well as when the predicted editing window for ABE is expanded to include the 9th position. c, Effect size for base-level analysis vs. LFC (log2-fold change) for residue-level analysis is plotted for the TNFα ABE (left) and CBE (right) screens. d, Variants are binned based on MAGeCK guide-level FDR. Enrichments of base edited variants in Clinvar “pathogenic,” “likely pathogenic,” and “benign” categories are plotted for each group for the PD1, CD25, TNFα, and IFNγ screens (from n = 3 donors); error bars represent 95% confidence intervals.
Extended Data Fig. 6 |
Extended Data Fig. 6 |. Supplementary validation and characterization of specific base edits in arrayed format.
a, Editing by ABE mRNA and synthetic sgRNA co-electroporation for each sgRNA chosen for validation, assessed by deep amplicon sequencing and analyzed with Crispresso2. Guide sequences are in gray, predicted editing window in green, and PAM in dark gray. b, LFC (log2-fold changes) of levels of the indicated cytokines over control (mean of 2 AAVS1 control gRNAs) measured by intracellular staining and flow cytometry are plotted. n = 6 human donors; mean ± SE; *p < 0.05, **p < 0.01, ***p < 0.001. P-values were derived using a two-tailed independent two-sample t-test. c, Cytokine secretion in culture supernatants for T cells with the indicated base edits were measured by Luminex. Heatmap represents LFC (log2-fold changes) over the mean of cells edited with two AAVS1 control sgRNAs. n = 4 human donors.
Extended Data Fig. 7 |
Extended Data Fig. 7 |. Stimulation responses of base edited T cells in arrayed validation.
Individual plots of cytokine and cell surface protein expression for CD4+ or CD8+ T cells base edited with the indicated guides (red, positive in TNFα screen; blue, negative in TNFα screen; gray, AAVS1 control), measured by flow cytometry and normalized to AAVS1 control, over a range of anti-CD3/28/2 immunocult (IC) doses ranging from 0 (IC0) to 6.25ul/ml (IC6.25). n = 6 human donors, shown as mean ± SE.
Extended Data Fig. 8 |
Extended Data Fig. 8 |. Characterization of a PIK3CD allelic series.
a, Bar graphs corresponding to Fig. 3i show LFC (log2-fold change) in expression of the indicated cytokines in arrayed validation for a series of 9 PIK3CD guides relative to AAVS1 control in CD8+ T cells; color indicates LFC (log2-fold change) value of each guide in the original ABE TNFα screen. n = 6 human donors, shown as mean ± SE. b, A-T to G-C editing by co-electroporation of ABE mRNA and synthetic PIK3CD sgRNAs, assessed by deep amplicon sequencing and analyzed with Crispresso2. Guide sequences are in gray, predicted editing window in green, and PAM in dark gray. c, Correlation between PIK3CD LFC (log2-fold change) values from the TNFα screen and validation experiment (Fig. 3i) in CD4+ T cells. d, mRNA expression of PIK3CD and IL2RA in PIK3CD edited T cells. Mean ± SD, n = 4 independent donors. e-g, Single amino acid substitution by CRISPR/Cas9 knockin. All edits include a synonymous K282K mutation deleting the PAM site. e, Flow cytometry histograms showing TNFα expression in CD4+ gated T cells. Percent positive cells in gray. f, Percent cytokine positive CD4+ and CD8+ gated T cells with the indicated knockins. n = 2 human donors (red and blue dots) shown as mean. g, Corresponding gene editing outcomes for knockin experiments as reported by CRISPResso2. n = 2 human donors shown as mean.
Extended Data Fig. 9 |
Extended Data Fig. 9 |. Cytotoxic function of base edited T cells in arrayed validation.
Cytotoxicity (measured by A375 target cell killing) of antigen-specific T cells base edited with control, positive (increased T cell activation, red), or negative (decreased T cell activation, blue) guides targeting selected genes measured with Incucyte live-cell imaging over time. n = 6 human donors, shown as mean (line) ± SE (shaded area).
Extended Data Fig. 10 |
Extended Data Fig. 10 |. Establishment and performance of NG-PAM dependent base editing with SpG Cas9.
a, Predicted distribution of fraction of editable residues, within the original 385 genes in the NGG-PAM Cas9 screen, using either WT nCas9 (NGG PAM) or SpG Cas9 (NG PAM) for ABE. Box plots show median, center quartiles, and extremes within 1.5 * IQR. b, Distribution of surface protein expression levels for CD5 or CD7 in pan T cells gated for CD4+ (right) or CD8+ (left) base edited with one (CD5) or two (CD7) ABE NGG sgRNAs targeting each gene and one ABE NG sgRNA targeting each gene plus AAVS1 control. c, LFC (log2 fold changes) in the TNFα screens using WT nCas9 (NGG, y-axis) vs. using SpG Cas9 (NG, x-axis) for 13,334 overlapping guides between the two screens. The average knockout effect of specific genes present in both screens is shown with overlaid blue/red dots and labels. Knockout effects were calculated using the top 3 predicted knockout guides. d, Scatter plots showing LFC (log2-fold changes) of pairwise donor-to-donor correlations for each NG screen. Two human donors were used for all NG screens.
Fig. 1 |
Fig. 1 |. Base editing screens in primary human T cells identify mutations with effects on activation and cytokine production.
a, Schematic of the ABE and CBE base editor screens performed in primary T cells from three human donors. b, Scatter plot of average mean log2-transformed fold change (log2FC) of top three knockout-inducing sgRNAs (guides that ablate a start codon or edit a splice site within the first half of the coding sequence) for each gene, comparing ABE screens in two donors. Negative regulators of TNF production are shown in red, positive regulators are shown in blue. c, log2FC (high/low sorting bins for PD-1 or CD25 cell surface expression) for individual guide RNAs (vertical lines) directly targeting PD-1 (encoded by PDCD1) or CD25 (encoded by IL2RA) or non-targeting controls. Vertical purple lines indicate guides that are predicted to cause functional knockout (premature gene termination). d, Top, the spectrum of predicted ABE- and CBE-induced mutations for guides targeting genes with demonstrated effects on TNF production (knockout effect size > 1.0 log2FC) is plotted against effect size (mean absolute log2FC ± 95% confidence interval in all screens, from n = 3 donors) and coloured by biological substitution likelihood (BLOSUM62 score). Frequency of each mutation type in ABE (middle) and CBE (bottom) screens.
Fig. 2 |
Fig. 2 |. Tiling base edits reveal functional protein domains across gene coding sequences.
a, Average effects log2FC of non-synonymous, non-terminating base edits at each residue (top, ABE; bottom, CBE) on TNF production are plotted across open reading frames encoding VAV1 (left) and NFKBIA (right). The dotted line indicates the average log2FC of the top three terminating (knockout) guides in the first half of the coding sequence, with blue for negative effects and red for positive effects on TNF levels. Annotated domains from UniProt are shown below and are coloured by the average effect of guides targeting those regions. Known phosphorylated residues within domains with gain-of-function mutations (discordant with knockout effect) are mapped. AC, acidic region; ANK, ankyrin repeats; CH, calponin homology; DAG, diacylgycerol; DH, Dbl homology domain; PH, pleckstrin homology domain; SH2, Src homology 2 domain; SH3, Src homology 3. b, Violin plots show distribution of log2FC of CBE and ABE guides tiling positive (left) and negative (right) regulator genes of TNF. Dotted lines indicate the average log2FC of the top three terminating (knockout) guides in the first half of the coding sequence. Blue and red dots indicate guides with strongly opposing effects with respect to the knockout guides for the same gene (discordant guides). c, Base-editing variants in the TNF ABE screen (from n = 3 donors) binned by MAGeCK guide-level false discovery rate (FDR) are plotted with the log odds ratio of overlap with ClinVar ‘pathogenic’ variants. d, Base-editing variants from the PD-1 screen (from n = 3 donors) across the PIK3CD locus. Those with an exact base-level match in ClinVar are coloured red. c,d, Error bars represent 95% confidence intervals.
Fig. 3 |
Fig. 3 |. Validation and functional characterization of allelic spectra in key genes.
a, Schematic of arrayed validation by co-electroporation of ABE mRNA and synthetic sgRNA. b, ABE base editing at a positive VAV1 (VAV1pos sgRNA) site and AAVS1 control site verified by deep amplicon sequencing and analysed with Crispresso2. Predicted editing window in green, guide sequence in grey, and NGG PAM in dark grey. c, Representative flow cytometry plots for indicated cytokines in control (AAVS1) or PIK3CDpos sgRNA-edited T cells, gated on CD4+ T cells. d, log2FC of intracellular expression of indicated cytokines over control (mean of two AAVS1 guide RNAs) measured by flow cytometry. Negative sgRNAs in the original screen are in blue, positive sgRNAs are in red. n = 6; *P < 0.05, **P < 0.01, ***P < 0.001. pos and neg indicate sgRNAs with positive and negative effects on T cell activation responses, respectively. e, Cytokine secretion in culture supernatants for base-edited T cells measured by Luminex. The heat map represents log2FC over mean of cells edited with two AAVS1 controls. n = 4. f, Cytotoxicity (A375 cell killing) of antigen-specific T cells base edited with control, positive or negative guide RNAs targeting DGKZ or PIK3CD measured by Incucyte imaging over time. n = 6. g, Area under the curve (AUC) of A375 cell counts over time when co-cultured with base edited T cells (x axis) at an effector:target (E:T) ratio of 4. n = 6 donors in technical duplicates. h, Imaging of A375 cells co-cultured with base-edited, antigen-specific T cells using indicated guides and E:T ratios after 120 h. i, Change in production of indicated cytokines in arrayed validation for nine PIK3CD guides relative to AAVS1 control in CD4+ T cells; colour indicates the guide log2FC value in the original ABE TNF screen. n = 6. j, Sequencing of base edits clustering around Y524 (green) show distinct mutations. All n values refer to the number of human donors. Data are mean ± s.e.m. Two-tailed independent two-sample t-test.
Fig. 4 |
Fig. 4 |. NG PAM Cas9 base editors enable high-resolution screens.
Comparison of base-editing resolution between NGG PAM- and NG PAM-dependent Cas9 for 57 genes overlapping between libraries. Left, the fraction of editable residues with NGG PAM compared with NG PAM ABE base editors. Centre, heat maps of effects of base editing across coding sequences for each gene (rows); black indicates an absence of data (uneditable residue), white is an editable residue with no observed effect, red indicates a positive effect, and blue indicates a negative effect. Right, detailed results for base edits across WAS, CBL, DGKZ and RHOH, with domains confirmed by base editing (WAS and CBL) or suggested as novel functional domains (DGKZ and RHOH) boxed and indicated on the gene plots. X-axis labels on far right plots show amino acid positions. CRIB, Cdc42- and Rac-interactive binding motif; DAGKc, diacylglycerol kinase catalytic domain; PTB, phosphotyrosine-binding domain; WH, WASp homology domains.
Fig. 5 |
Fig. 5 |. High-resolution map of functional residues in a 3D protein complex structure.
a, Structural model of the PIK3CD–PIK3R1 complex (Protein Data Bank: 7JIS), with residues coloured by log2FC of TNF production from the NG PAM screen. The catalytic loop (residues 890–905) is marked by negative base-editing effects (top left); two other domains—the PIK3R1-interaction region (residues 566–586) (bottom right) and residues 515–535 (bottom left) are marked by positive base-editing effects. b, Flow cytometry plots of CD4+ T cells edited with ABE mRNA and synthetic sgRNA targeting PIK3R1 or AAVS1 (control). c, log2FC in cytokine production for CD4+ or CD8+ T cells edited with positive PIK3R1 sgRNA or AAVS1 controls in arrayed format. n = 6 human donors. Data are normalized to controls and show mean ± s.e.m.

References

    1. Shifrut E et al. Genome-wide CRISPR screens in primary human T cells reveal key regulators of immune function. Cell 175, 1958–1971.e15 (2018). - PMC - PubMed
    1. Carnevale J et al. RASA2 ablation in T cells boosts antigen sensitivity and long-term function. Nature 609, 174–182 (2022). - PMC - PubMed
    1. Schmidt R et al. CRISPR activation and interference screens decode stimulation responses in primary human T cells. Science 375, eabj4008 (2022). - PMC - PubMed
    1. Belk JA et al. Genome-wide CRISPR screens of T cell exhaustion identify chromatin remodeling factors that limit T cell persistence. Cancer Cell 40, 768–786.e7 (2022). - PMC - PubMed
    1. Henriksson J et al. Genome-wide CRISPR screens in T helper cells reveal pervasive crosstalk between activation and differentiation. Cell 176, 882–896.e18 (2019). - PMC - PubMed