. 2023 Dec;624(7992):645-652.
doi: 10.1038/s41586-023-06803-0. Epub 2023 Dec 13.

Lung dendritic-cell metabolism underlies susceptibility to viral infection in diabetes

Affiliations

Lung dendritic-cell metabolism underlies susceptibility to viral infection in diabetes

Samuel Philip Nobs et al. Nature. 2023 Dec.

Abstract

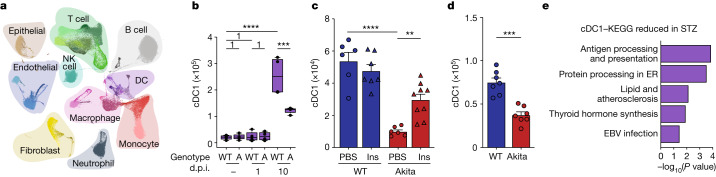
People with diabetes feature a life-risking susceptibility to respiratory viral infection, including influenza and SARS-CoV-2 (ref. 1), whose mechanism remains unknown. In acquired and genetic mouse models of diabetes, induced with an acute pulmonary viral infection, we demonstrate that hyperglycaemia leads to impaired costimulatory molecule expression, antigen transport and T cell priming in distinct lung dendritic cell (DC) subsets, driving a defective antiviral adaptive immune response, delayed viral clearance and enhanced mortality. Mechanistically, hyperglycaemia induces an altered metabolic DC circuitry characterized by increased glucose-to-acetyl-CoA shunting and downstream histone acetylation, leading to global chromatin alterations. These, in turn, drive impaired expression of key DC effectors including central antigen presentation-related genes. Either glucose-lowering treatment or pharmacological modulation of histone acetylation rescues DC function and antiviral immunity. Collectively, we highlight a hyperglycaemia-driven metabolic-immune axis orchestrating DC dysfunction during pulmonary viral infection and identify metabolic checkpoints that may be therapeutically exploited in mitigating exacerbated disease in infected diabetics.


Conflict of interest statement

E.E. is a scienrtific cofounder of DayTwo and BiomX and an advisor to Purposebio, Igen, Aposense and Zoe in topics unrelated to this work. The remaining authors declare no competing interests.

Figures

Fig. 1
Fig. 1. Diabetes exacerbates lung viral infection.
a,b, WT (n = 27) and Akita (n = 19) mice infected with 200 plaque-forming units (pfu) PR8, log-rank Mantel–Cox test. a, Survival. Inset, lung PR8 RNA 10 d.p.i., WT (n = 16) and Akita (n = 7) mice infected with 50 pfu PR8, two-sided Mann–Whitney U-test. b, Lung NP34-tetramer+CD8+ T cells, two-sided Mann–Whitney U-test. c,d, Mice infected with 50 pfu PR8, treated with insulin (Ins)/phosphate-buffered saline (PBS): WT+PBS (n = 16), WT+Ins (n = 15), Akita+PBS (n = 13), Akita+Ins (n = 15), Kruskal–Wallis test with Dunn’s correction, two pooled experiments. c, Lung PR8 RNA. d, Lung NP34-tetramer+CD8+ T cells. e,f, Mice infected with 200 pfu PR8, administered STZ (n = 18 for e, n = 9 for f) or PBS (n = 30 for e, n = 20 for f). e, Survival, log-rank Mantel–Cox test. Inset, lung PR8 RNA 10 d.p.i., mice infected with 50 pfu PR8, administered STZ (n = 9) or PBS (n = 20), two-sided Mann–Whitney U-test. f, Lung NP34-tetramer+CD8+ T cells, two-sided Mann–Whitney U-test. g,h, Mice infected with 50 pfu PR8, administered STZ or PBS, treated with Ins/PBS: PBS+PBS (n = 27 for g, n = 19 for h), PBS+Ins (n = 19 for gn = 15 for h), STZ+PBS (n = 10 for gn = 4 for h), STZ+Ins (n = 17 for g, n = 11 for h), Kruskal–Wallis test with Dunn’s correction. g, PR8 RNA, three pooled experiments. h, Lung NP34-tetramer+CD8+ T cells, two pooled experiments. i,j, Db/Db (n = 9 for i, n = 10 for j) and WT (n = 10 for i, n = 15 for j) mice infected with 200 pfu PR8. i, Survival, log-rank Mantel–Cox test. Inset, lung PR8 RNA 10 d.p.i., WT (n = 20) and Db/Db (n = 10) mice infected with 50 pfu PR8, three pooled experiments, two-sided Mann–Whitney U-test. j, NP34-tetramer+CD8+ T cells, two-sided Mann–Whitney U-test. k, Survival, WT (n = 15) and Akita (n = 18) mice infected with 200 pfu PVM, log-rank Mantel–Cox test. Inset, lung PVM RNA 10 d.p.i., WT (n = 15) and Akita (n = 17) mice infected with 50 pfu PVM, two-sided Mann–Whitney U-test. All P values are indicated in Supplementary Table 1. All data mean+s.e.m. a.u., Arbitrary units.
Fig. 2
Fig. 2. Diabetes alters lung DC in homeostasis and during respiratory viral infection.
a,b, scRNA-seq of lungs during steady-state, 1 d.p.i. and 10 d.p.i. with 50 pfu PR8 (n = 4 per group). a, Uniform manifold approximation and projection (UMAP) of all cells. b, Lung cDC1, two-sided Wilcoxon test. Boxplots show 25th–75th percentiles, the 50th percentile denoted by a thicker line; whiskers show 1.5× interquartile range, or maximum or minimum if smaller than 1.5× interquartile range. Numeral (1) above the horizontal lines denotes the P value. A, Akita. c, Lung cDC1, WT and Akita mice infected with 50 pfu PR8 and treated with Ins/PBS: WT+PBS (n = 6), WT+Ins (n = 7), Akita+PBS (n = 6), Akita+Ins (n = 9), one-way analysis of variance (ANOVA) and Holm–Sidak correction. d, Lung cDC1, WT and Akita mice (n = 7 per group) infected with 50 pfu PVM, two-sided unpaired t-test. e, scRNA-seq of lung DC from PBS- (n = 4) and STZ-administered (n = 4) mice. Enriched Kyoto Encyclopedia of Genes and Genomes (KEGG) pathways in PBS- versus STZ-administered cDC1, P values corrected for multiple hypothesis testing with the g:SCS algorithm. All P values are indicated in Supplementary Table 1. ER, endoplasmic reticulum; EBV, Epstein–Barr virus.
Fig. 3
Fig. 3. High glucose impairs lung DC function.
ad, WT (n = 9) and Akita (n = 6) mice infected with 50 pfu PR8 and intratracheally administered 100 μg of OVA-AF647, two-sided unpaired t-test. a, Lung dLN OVA+ cDC1. b, CD40 mean fluorescence intensity (MFI). c, CD80 MFI. d, CD86 MFI. eg, WT lung cDC1 incubated with high (50 mM, n = 4) or normal (10 mM, n = 4) glucose. e, CD40 MFI, two-sided unpaired t-test. f, CD80 MFI, two-sided Mann–Whitney U-test. g, CD86 MFI, two-sided unpaired U-test. h, WT lung cDC1 incubated with high (50 mM, n = 8) or normal (10 mM, n = 9) glucose for 20 h, then co-incubated for 4 days with OT-I-CD8+ T cells in normal (10 mM) glucose. CD8+ T cells, two-sided unpaired t-test. i, WT lung cDC1 incubated with high (50 mM, n = 12) or normal (10mM, n = 12) glucose for 20 h, then co-incubated for 4 days with OT-II-CD4+ T cells in normal (10 mM) glucose. CD4+ T cells, two-sided unpaired t-test. All P values are indicated in Supplementary Table 1. All data mean+s.e.m.
Fig. 4
Fig. 4. Hyperglycaemia dysregulates lung DC metabolism and acetylation.
a, WT (n = 4) and Akita (n = 4) lung DC incubated with 11 mM 13C-glucose. Supernatant 13C-lactate, area under the curve, two-sided unpaired t-test. b, WT (n = 15) and Akita (n = 10) lung DC acetyl-CoA, two-sided unpaired t-test. c, WT lung cDC1 incubated with high (50 mM, n = 12)/normal (10 mM, n = 9) glucose or with BMS303141 in high (50 mM, n = 16)/normal (10 mM, n = 13) glucose, then co-cultured for 4 days with OT-I-CD8+ T cells in normal (10 mM) glucose (in the absence of inhibitor). CD8+ T cells, two-way ANOVA with Holm–Sidak correction. d, WT lung cDC1 incubated for 20 h with 10 mM dichloroacetate (DCA) (n = 12) or medium (n = 12), then co-cultured for 4 days with OT-I-CD8+ T cells in normal (10 mM) glucose (in the absence of inhibitor). CD8+ T cells, two-sided Mann–Whitney U-test. e, OT-I-CD8+ T cells incubated for 4 days with lung WT cDC1 (n = 15) or Pdk2–4−/− cDC1 (n = 11). CD8+ T cells, two-sided unpaired t-test. f, H3K27ac immunoblot of lung DC from WT (n = 6) and Akita (n = 5) mice, two-sided unpaired t-test. g, Fluorescent activated cell sorting of lung WT (n = 6) and Akita (n = 6) H3K27ac+ DC, two-sided unpaired t-test. h, WT lung cDC1 incubated for 20 h with high (50 mM, n = 6)/normal (10 mM, n = 8) glucose, or with 10 mM ANA in high (50 mM, n = 8)/normal (10 mM, n = 8) glucose, then co-cultured for 4 days with OT-I-CD8+ T cells and normal (10 mM) glucose (in the absence of inhibitor). CD8+ T cells, two-way ANOVA with Holm–Sidak correction. i,j, WT and Akita mice intraperitoneally administered 5 mg kg−1 ANA or vehicle (dimethyl sulfoxide, DM) for 5 days, followed by intratracheal administration of 50 μg of OVA + 50 μg poly I:C. 24 h later, lung DC were sorted and transferred to naïve WT mice: WT+DM DC (n = 28), Akita+DM DC (n = 23), Akita+ANA DC (n = 12 for in = 11 for j). 10 days later, recipient mice were administered 500 pfu PR8-OVA (SIINFEKL), analyzed at day 7, Kruskal–Wallis test with Dunn’s correction. i, Lung OVA-PR8 viral RNA. j, Lung CD8+ T cells. All P values are indicated in Supplementary Table 1. All data mean+s.e.m.
Extended Data Fig. 1
Extended Data Fig. 1. Diabetes-associated susceptibility to respiratory viral infection is associated with broadly impaired lung adaptive immunity.
a-m, WT (n = 16) and Akita mice (n = 7) infected with 50pfu PR8, analyzed at 10 d.p.i. a-b, Lung histology, two-sided Mann Whitney U-test. c, Lung CD4+ T cells, two-sided Mann Whitney U-test, lung CD8+ T cells, two-sided unpaired t-test. d, Lung Ki-67+CD8+ T cells, two-sided unpaired t-test. e, Lung IFNγ+CD8+ T cells, two-sided unpaired t-test. f, Lung T-bet+CD8+ T cells, two-sided Mann Whitney U-test. g, Lung FoxP3+CD4+ T cells, two-sided unpaired t-test. h, Lung B cells, two-sided Mann Whitney U-test. i, GC B cells, two-sided unpaired t-test. j-k, virus specific IgG2b, j, BAL, k, serum, two-sided Mann-Whitney U-test for EC50. l-m, virus-specific IgM, l, BAL m, serum, two-sided unpaired t-test for EC50. n-s, Mice infected with 50 pfu PR8, treated with insulin/PBS: WT+PBS (n = 16), WT+Ins (n = 15), Akita+PBS (n = 13), Akita+Ins (n = 15), pooled data from 2 experiments. n, Blood glucose. o, Lung CD4+ T cells, one-way ANOVA and Holm Sidak correction. p, Lung CD8+ T cells, Kruskal-Wallis and Dunn’s correction. q, Lung GC B cells, Kruskal-Wallis and Dunn’s correction. r-s, Virus-specific IgG2b, r, BAL, s, serum, Akita+PBS (n = 6), Akita+Ins (n = 9), one-way ANOVA with Tukey correction on EC50. All data mean+s.e.m. GC, Germinal centre.
Extended Data Fig. 2
Extended Data Fig. 2. Diabetes associated susceptibility to respiratory viral infection is associated with broadly impaired adaptive immunity in streptozotocin-induced diabetes.
a, Blood glucose, PBS (n = 20) or STZ (n = 16) administered mice, analyzed at 10 d.p.i., two-sided unpaired t-test. b, Survival, PBS (n = 10) or STZ (n = 10) administered mice, log-rank Mantel-Cox test. c-r, Mice infected with 50pfu PR8, administered PBS (n = 20) or STZ (n = 10 in e, n = 9 in all other panels), analyzed at 10 d.p.i. c, Lung Ifnβ1, two-sided Mann-Whitney U-test. d-e, Lung histology, d, representative sections, e, inflammatory score, two-sided Mann-Whitney U-test. f, Lung T cells, two-sided unpaired t-test. g-h, Flow cytometry,lung T-bet+CD8+ T cells, g, representative blots h, quantification, two-sided unpaired t-test. i, Lung IFNγ+CD8+ T cells, two-sided unpaired t-test. j, Lung Ki-67+CD8+ T cells, two-sided unpaired t-test. k, Lung FoxP3+CD4+ T cells, two-sided Mann-Whitney U-test. l, Lung B cells, two-sided Mann-Whitney U-test. m-n, Flow cytometry, GC B cells, m, representative blots, n, quantification, two-sided Mann-Whitney U-test. o-p, Virus specific IgG2b,o, BAL, p, serum, two-sided unpaired-test for EC50. q-r,Virus specific IgM, q, BAL, r, serum, two-sided Mann-Whitney test for EC50. All data mean+s.e.m.
Extended Data Fig. 3
Extended Data Fig. 3. Normalization of glucose levels in diabetic animals with insulin restores adaptive antiviral immunity and attenuates susceptibility to respiratory viral infection.
a-d, Mice infected with 50pfu PR8, administered STZ or PBS, treated with insulin/PBS: PBS+PBS (n = 19), PBS+Ins (n = 15), STZ+PBS (n = 4) STZ+Ins (n = 11), pooled data from 2 experiments. a, Survival curve (n = 11 mice/group), Log-rank Mantel Cox test. b, Lung CD4+ T cells, one-way ANOVA and Holm-Sidak correction. c, Lung CD8+ T cells, one-way ANOVA and Holm-Sidak correction. d, Lung GC B cells, Kruskall Wallis test and Dunn’s correction. e, Blood glucose, WT (n = 15) and Db/Db (n = 10) mice, two-sided unpaired t-test. f-j, WT (n = 14 for g, n = 15 for the other panels) and Db/Db (n = 10) mice infected with 50pfu PR8, pooled data from 3 experiments. f, Lung T cells, two-sided unpaired t-test for CD4+T cells and two-sided Mann-Whitney test for CD8+ T cells, respectively. g-h, Virus specific IgG2b, g, BAL, h, serum, two-sided Mann-Whitney test for EC50. i-j, IgM, i, BAL, j, serum, two-sided Mann-Whitney test for EC50. k, Blood insulin, WT (n = 15) and Db/Db (n = 10) mice, two-sided Mann-Whitney U-test. l, Lung Ifnβ1 expression, WT (n = 15) and Akita (n = 17) mice infected with 50pfu PVM, two-sided Mann-Whitney U-test. m-p, WT (n = 7) and Akita mice (n = 6 in n and n = 7 in the other panels) infected with 50pfu PVM. m, Lung T cells, two-sided unpaired t-test. n, Lung Ki-67+CD8+ T cells and T-bet+CD8+ T cells, two-sided Mann Whitney U-test. o, Lung B cells, two-sided Mann Whitney U-test. p, Lung GC B cells, two-sided Mann Whitney U-test. q-u, Mice infected with 50pfu PVM, administered STZ or PBS, treated with insulin/PBS: PBS+PBS (n = 14), PBS+Ins (n = 14), STZ+PBS (n = 13), STZ+Ins (n = 13), pooled data from 2 experiments. q, Lung viral RNA, Kruskall Wallis test and Dunn’s correction. r, Lung CD4+ T cells, one-way ANOVA and Holm-Sidak correction. s, Lung CD8+ T cells, Kruskall Wallis test and Dunn’s correction. t, Lung B cells, Kruskall Wallis test and Dunn’s correction. u, Lung GC B cells, Kruskall Wallis test and Dunn’s correction. All data mean+s.e.m.
Extended Data Fig. 4
Extended Data Fig. 4. Diabetes is associated with transcriptomic changes in respiratory viral infection.
a-h, scRNA-seq of lungs of WT and Akita mice (n = 4/group) collected during steady-state,1 d.p.i. and 10 d.p.i. with 50pfu PR8. Quantification of key cell subsets, two-sided Wilcoxon test. Boxplots show 25th to 75th percentiles, the 50th percentile denoted by a thicker line; whiskers show 1.5× interquartile range max. or min. if smaller than 1.5× interquartile range. i-j, Heatmap with z-score of gene expression of differentially expressed genes between cells from WT and Akita, 10 d.p.i (n = 4/group). Differentially expressed genes identified by DESeq2 on pseudobulk counts in each population and adjusted p-value < 0.05. DESeq2 is based on Negative Binomial GLM fitting and Wald statistics with Benjamini and Hochberg procedure. i, downregulated, and j, upregulated genes in Akita mice. AT1, type 1 alveolar epithelial cell; AT2, type 2 alveolar epithelial cell.
Extended Data Fig. 5
Extended Data Fig. 5. Hyperglycaemia dysregulates the lung DC compartment in infection and homeostasis.
a-d, Mice infected with 50pfu PR8, treated with Ins/PBS: WT+PBS (n = 6), WT+Ins (n = 7), Akita+PBS (n = 6), Akita+Ins (n = 9). a-c, one-way ANOVA and Holm-Sidak correction, d, Kruskal Wallis test with Dunn’s correction. a, Lung cDC2. b, Lung CD64+ DC. c, Lung IL-12+cDC1. d, Lung Ki-67+cDC1. e-f, Naïve WT (n = 8) and Akita (n = 8) mice, two-sided unpaired t-test. e, Lung cDC1, cDC2 and CD64+ DC. f, Lung Ki-67+ DC. g-i, Naïve WT (n = 10) and Akita (n = 10) mice, two-sided unpaired t-test. g, BM DC precursors. h, BM Pre-DC subsets. i, Blood lymphocytes. j-l, WT (n = 15) and Db/Db (n = 10) mice infected with 50pfu PR8, pooled data from 3 experiments. j, Lung cDC1, two-sided Mann Whitney U-test. k, Lung cDC2 and CD64+ DC, two-sided unpaired t-test. l, Lung Ki-67+ DC, two-sided unpaired t-test for cDC1 and CD64+ DC, two-sided Mann Whitney U-test for cDC2. m-p, WT and Akita mice infected with 50pfu PVM (n = 7 per group in m-o, WT (n = 8) and Akita (n = 10) mice in p). m, Lung cDC2, two-sided unpaired t-test and CD64+ DC, Mann Whitney U-test. n, Lung pDC, two-sided Mann Whitney U-test. o, Lung Ki-67+ DC, two-sided unpaired t-test. p, Lung IL-12+cDC1, two-sided unpaired t-test. q-r, WT and Akita mice treated with insulin/PBS: WT+PBS (n = 16), WT+Ins (n = 18), Akita+PBS (n = 14) Akita+Ins (n = 14), pooled data from 2 experiments. q, Lung cDC1, Kruskal Wallis test with Dunn’s correction.r, Lung cDC2 and CD64+ DC, Kruskal Wallis test with Dunn’s correction. s-t, WT and Akita mice treated with insulin/PBS: WT+PBS (n = 6), WT+Ins (n = 9), Akita+PBS (n = 7) Akita+Ins (n = 7), one-way ANOVA and Holm-Sidak. s, Lung Ki-67+cDC1. t, Lung IL-12+cDC1. All data mean+s.e.m. CDP, Common dendritic cell progenitor; MDP, Macrophage dendritic cell progenitor.
Extended Data Fig. 6
Extended Data Fig. 6. Insulin treatment improves outcomes of influenza infection.
a-e, Mice infected with 50pfu PR8, administered STZ or PBS, treated with insulin/PBS: PBS+PBS (n = 19), PBS+Ins (n = 15), STZ+PBS (n = 4), STZ+Ins (n = 11), pooled data from 2 experiments. a, Lung cDC1, Kruskal Wallis test with Dunn’s correction. b, Lung cDC2, one-way ANOVA and Holm-Sidak. c, Lung CD64+ DC, Kruskal Wallis test with Dunn’s correction. d, Lung Ki-67+cDC1, Kruskal Wallis test with Dunn’s correction. e, Lung IL-12+cDC1, one-way ANOVA and Holm-Sidak. f-h, Mice infected with 50pfu PVM, administered STZ or PBS, treated with insulin/PBS: PBS+PBS (n = 8), PBS+Ins (n = 7), STZ+PBS (n = 6), STZ+Ins (n = 8). f, Lung cDC1, Kruskall Wallis test and Dunn’s correction. g, Lung cDC2, Kruskall Wallis test and Dunn’s correction. h, Lung CD64+ DC, one-way ANOVA and Holm-Sidak correction. i-j, scRNA-seq of lung DC from PBS or STZ administered WT mice (n = 4/group). i, UMAP showing all DC populations. j, Balloon plots with key population markers. Size of dots represents percentage of cells in which the gene was detected, color corresponds to mean scaled gene expression of all cells in a cluster. k-p, Quantification of all lung DC subsets not shown in Fig. 2, two-sided Wilcoxon test. Boxplots show 25th to 75th percentiles, the 50th percentile denoted by a thicker line; whiskers show 1.5× interquartile range, or max. or min. if smaller than 1.5× interquartile range. All data mean+s.e.m.
Extended Data Fig. 7
Extended Data Fig. 7. Hyperglycaemia dysregulates the lung DC compartment in steady-state in the streptozotocin-induced diabetes model.
a-g, scRNA-seq of lung DC from PBS- or STZ-administered WT mice (n = 4/group). a-e, Heatmaps of differentially expressed genes with Z-score of tpm pseudobulk counts in a-b, CD64+ DC, c, cDC1, d, cDC2, and e, pDC. Differentially expressed genes identified by DESeq2 on pseudobulk counts in each population and adjusted p-value < 0.05. f, KEGG pathways reduced in pDC from STZ: bar plot showing KEGG pathway enrichment analysis with all differentially expressed genes higher in PBS controls than in STZ-administered mice, with gProfiler2 R package using standard settings; P values corrected for multiple hypothesis testing with g:SCS algorithm. g, KEGG pathways reduced in CD64+ DC, bar plot showing KEGG pathway enrichment analysis with all differentially expressed genes higher in PBS controls than in STZ-administered mice, with gProfiler2 R package using standard settings. P values corrected for multiple hypothesis testing using the g:SCS algorithm.
Extended Data Fig. 8
Extended Data Fig. 8. High glucose impairs lung DC immune functions.
a-d, WT (n = 9) and Akita mice (n = 6) infected with 50 pfu PR8 and intratracheally administered 100μg OVA-AF647. a, Representative flow cytometry, lung dLN OVA+DC. b, Percentage of lung dLN OVA+cDC2, two-sided unpaired t-test. c, Number of lung dLN OVA+DC, two-sided unpaired t-test. d, Frequency of lung OVA+DC, WT (n = 10) and Akita (n = 7) mice, cDC1 and CD64+ DC, two-sided unpaired t-test, cDC2, Mann Whitney U-test. e-g, Lung dLN cDC2 MFI, WT (n = 9) and Akita (n = 6) mice, two-sided unpaired t-test. e, CD40. f, CD80. g, CD86. h-j, Lung DC MFI, WT (n = 10) and Akita (n = 7) mice. h, CD40, two-sided Mann Whitney U-test. i, CD80, two-sided unpaired t-test. j, CD86, two-sided unpaired t-test. k, WT Lung DC incubated with high (50mM, n = 4) or normal (10mM, n = 4) glucose, cell viability, two-sided unpaired t-test. l-n, WT Lung cDC2 incubated with high (50mM, n = 4) or normal (10mM, n = 4) glucose, MFI, two-sided unpaired t-test. l, CD40. m, CD80. n, CD86. o-t, WT Lung DC incubated with 25 mM (n = 10) or 5 mM (n = 10) glucose, two-sided Mann Whitney U-test for p, two-sided unpaired t-test for all other panels. o, cDC1 CD40. p, cDC1 CD80. q, cDC1 CD86. r, cDC2 CD40. s, cDC2 CD80. t, cDC2 CD86. u-ab, WT and Akita mice intratracheally administered 100μg HDM + 100 μg OVA-AF647.u, Lung dLN OVA+DC, WT (n = 8) and Akita (n = 7) mice, two-sided unpaired t-test. v-x, Lung dLN DC MFI, WT (n = 10) and Akita (n = 5) mice, two-sided unpaired t-test. v, CD40. w, CD80. x, CD86. y, Lung OVA+DC frequency, WT (n = 10) and Akita (n = 7) mice, two-sided Mann Whitney U-test. z-ab, Lung DC MFI, WT (n = 9) and Akita (n = 5) mice. z, CD40, two-sided unpaired t-test. aa, CD80, two-sided Mann Whitney U-test. ab, CD86, two-sided Mann Whitney U-test. All data mean+s.e.m.
Extended Data Fig. 9
Extended Data Fig. 9. Hyperglycaemia protects from allergic lung inflammation.
a-c, WT and Akita mice intratracheally administered 10μg HDM at day 0, 7-11, analyzed at day 14. a, Lung eosinophils and neutrophils, WT (n = 5) and Akita (n = 6) mice, two-sided Mann Whitney U-test. b, Lung PAS staining and mucus quantification,WT (n = 13) and Akita (n = 9) mice, two-sided Mann Whitney U-test. c, Lung CD4+ T cells and CD8+ T cells, WT (n = 5) and Akita (n = 6) mice, two-sided unpaired t-test. d-e, STZ (n = 4)- or PBS (n = 9)-pretreated mice intratracheally received 10μg HDM at day 0, 7-11, analyzed on day 14. d, Lung eosinophils and neutrophils. e, Lung CD4+ T cells and CD8+ T cells. f, WT lung cDC2 incubated in vitro with high (50mM, n = 7) or normal (10mM, n = 7) glucose for 20 h, then co-cultured for 4 days with OT-I-CD8+ T cells in normal (10mM) glucose. CD8+T cells, two-sided Mann-Whitney U-test. g, WT lung cDC2 incubated in vitro with high (50mM, n = 12) or normal (10mM, n = 12) glucose for 20 h, then co-cultured for 4 days with OT-II-CD4+ T cells in normal (10mM) glucose. CD4+ T cells, two-sided unpaired t-test. h-i, T cell activation by anti-CD3 and anti-CD28 in the presence of high (50mM, n = 8) or normal (10mM, n = 8) glucose, analyzed at day 4. h, CD8+ T cells, two-sided unpaired t-test. i, CD4+ T cells, two-sided Mann-Whitney U-test. j-r, WT mice sublethally irradiated and transplanted with a Zbtb46-DTR bone marrow, followed, after 8 weeks, by administration of STZ or PBS. 2 weeks later, mice infected with 50pfu PR8 and treated, every other day, with PBS or DT: PBS+PBS (n = 10), PBS+DT (n = 10), STZ+PBS (n = 12) and STZ+DT (n = 8). j, Lung PR8 viral titer, Kruskall Wallis test and Dunn’s correction. k, Lung virus-specific NP34 Tetramer+CD8+ T cells, Kruskall Wallis test and Dunn’s correction. l, Lung CD4+ T cells, Kruskall Wallis test and Dunn’s correction. m, Lung CD8+ T cells, one-way ANOVA and Holm-Sidak correction. n, Lung B cells, Kruskall Wallis test and Dunn’s correction. o, Lung GC B cells, Kruskall Wallis test and Dunn’s correction. p, Lung cDC1, Kruskall Wallis test and Dunn’s correction. q, Lung cDC2, Kruskall Wallis test and Dunn’s correction. r, Lung CD64+ DC, Kruskall Wallis test and Dunn’s correction. s-x, WT and Akita mice intratracheally administered 100μg HDM, followed, 24 h later, by DC sorting and transfer to WT recipients (receiving WT DC (n = 9), Akita DC (n = 10), or no DC (n = 7)). Recipient mice intratracheally challenged by 10μg HDM daily from day 7-11, analyzed at day 14. s, Lung eosinophils and neutrophils, Kruskall Wallis test and Dunn’s correction. t, Lung T cells, one-way ANOVA and Holm-Sidak correction. u, Lung Ly-6Chigh and Ly-6Clowmonocytes, one-way ANOVA and Holm-Sidak correction. v, Lung cDC1, Kruskal Wallis test with Dunn’s correction. w, Lung cDC2, one-way ANOVA and Holm-Sidak correction and CD64+ DC, Kruskal Wallis test with Dunn’s correction. x, CD4+ T cell IL-5 and IL-13 expression, Kruskall Wallis test and Dunn’s correction, and CD4+ T cell IFNγ expression, one-way ANOVA and Holm-Sidak correction. All data mean+s.e.m. PAS, Periodic acid-schiff; DT, diphtheria toxin.
Extended Data Fig. 10
Extended Data Fig. 10. Lung DC from diabetic animals induce an attenuated T cell response.
a-h, WT and Akita mice intratracheally administered 100μg HDM, followed, 24h later, by DC sorting and transfer to WT recipients (receiving WT DC (n = 9), Akita DC (n = 10), or No DC (n = 7)). Recipient mice intratracheally challenged by 10μg HDM daily from day 7-11, analyzed at day 14. a, GATA3+CD4+ T cells, Kruskall Wallis test and Dunn’s correction. b, Ki-67+ T cells, Kruskall Wallis test and Dunn’s correction. c, Frequency of lung IL-10+CD4+ T cells, one-way ANOVA and Holm-Sidak correction, and IL-17A+CD4+ T cells, Kruskal Wallis test with Dunn’s correction. d, Frequency of lung RORγt+CD4+ T cells, T-bet+CD4+ T cells, Kruskal Wallis test with Dunn’s correction, and FoxP3+CD4+ T cells, one-way ANOVA and Holm-Sidak correction. e-g, WT and Akita mice intratracheally administered UV-inactivated PR8, followed 20 h later, by DC sorting and trasnfer to WT recipients (receiving WT DC (n = 6), WT+Akita DC (n = 6)). 10 days later, recipients infected with 500pfu PR8. e, Lung CD4+ T cells and CD8+ T cells, two-sided unpaired t-test. f, Frequency of T-bet+ cells, unpaired t-test. g, PR8 viral RNA, Mann Whitney test, WT+WT DC (n = 15), WT+Akita DC (n = 13), pooled from 2 experiments. h-o, WT lung DC incubated with high (50mM)/normal (10mM) glucose and 2-DG/vehicle for 20h, two-way ANOVA and Holm-Sidak correction. h, lung DC viability (n = 3/group). i-k, cDC1 (n = 4/group). i, CD40 MFI. j, CD80 MFI. k, CD86 MFI. l-n, cDC2 (n = 4/group). l, CD40 MFI. m, CD80 MFI. n, CD86 MFI. o, IL-12+ cells (n = 4/group). p-r, WT lung cDC1 incubated for 20 h with high (50mM, n = 12)/normal (10mM, n = 12) glucose, and high (50mM) glucose+2-DG (n = 3)/normal (10mM) glucose+2-DG (n = 3), then co-cultured with OT-I-CD8+ T cells for 4 days in normal (10mM) glucose (in the absence of 2-DG), two-way ANOVA and Holm-Sidak correction. p, CD8+ T cells. q, TNF+ cells. r, IFNγ+ cells. s-u, WT Lung cDC2 incubated for 20 h with high (50mM, n = 12)/ normal (10mM, n = 12) glucose, and high (50mM) glucose+2-DG (n = 3)/normal (10mM) glucose+2-DG (n = 3), then co-cultured with OT-I-CD8+ T cells for 4 days in normal (10mM) glucose (in the absence of 2-DG), two-way ANOVA and Holm-Sidak correction. s, CD8+ T cells. t, TNF+ cells. u, IFNγ+ cells. v, Mice intraperitoneally administered 250 mg/kg 2-DG (n = 5) or PBS (n = 5). Blood glucose measured at indicated time-points, two-sided unpaired t-test for each time-point. All data mean+s.e.m.
Extended Data Fig. 11
Extended Data Fig. 11. Diabetes does not impact lung DC lipid metabolism or glucose uptake.
a, Mice infected with 200pfu PR8 and intraperitoneally administered 250 mg/kg 2-DG (n = 10) or PBS (n = 10) daily. Survival, log-rank Mantel-Cox test. b-k, Mice infected with 50pfu PR8 and intraperitoneally administered 250 mg/kg 2-DG (n = 7) or PBS (n = 10) daily. b, Lung PR8 viral RNA, two-sided Mann-Whitney U-test. c, Lung virus-specific NP34 Tetramer+CD8+ T cells, two-sided unpaired t-test. d, Lung CD8+ T cells and CD4+ T cells, two-sided unpaired t-test. e, Frequency of IFNγ+CD8+ T cells, two-sided unpaired t-test. f, Lung Ki-67+CD8+ T cells, two-sided unpaired t-test. g, B cells,two-sided unpaired t-test. h, GC B cells, two-sided unpaired t-test. i, Lung cDC1, two-sided unpaired t-test. j, Lung cDC2, two-sided Mann-Whitney U-test and CD64+ DC, two-sided unpaired t-test. k, Lung Ki-67+cDC1, Ki-67+cDC2 and Ki-67+CD64+ DC, two-sided unpaired t-test. l-n, Mice intraperitoneally administered 250 mg/KG 2-DG (n = 10) or PBS (n = 10) daily for 10 days, two-sided unpaired t-test. l, Lung cDC1. m, Lung cDC2 and Lung CD64+ DC. n, Lung T cells. o-p, Seahorse ECAR analysis of lung DC, WT (n = 8) and Akita (n = 6) mice, two-sided unpaired t-test. q, Seahorse OCR of lung DC, WT (n = 12) and Akita (n = 8) mice, AUC, two-sided Mann-Whitney U-test. r-s, scRNA-seq of lung DC of genes involved in beta-oxidation. Heatmap shows z-scores of mean scaled and log normalized gene expression of cells in different DC. t, Lung DC incubated with 11 mM 13C-glucose. Intracellular pyruvate measured after 6 h (isotopologue fractional enrichment), 3 pooled experiments, two-sided paired t-test. All data mean+s.e.m. AUC, area under the curve; OCR, oxygen consumption rate.
Extended Data Fig. 12
Extended Data Fig. 12. Diabetes-induced hyperacetylation impairs lung DC.
a-c, WT (n = 5) and Akita (n = 5) mice intravenously administered 5 mM 2-NBDG. Frequency of 2-NBDG+ cells within immune cell compartments, two-sided unpaired t-test. d, WT lung cDC1 incubated with high (50mM) or normal (10mM) glucose and BMS303141 for 20h, then co-cultured for 4 days with OT-I-CD8+ T cells in normal (10mM) glucose (in the absence of BMS303141): High glucose+DMSO (n = 12), normal glucose+DMSO (n = 9), high glucose+BMS303141 (n = 16), normal glucose+BMS303141 (n = 9). Frequency of Ki-67+CD8+ T cells, two-way ANOVA and Holm-Sidak correction. e-f, WT lung cDC2 incubated with high (50mM) or normal (10mM) glucose and BMS303141 for 20h, then co-cultured for 4 days with OT-I CD8+ T cells in normal (10mM) glucose (in the absence of BMS303141): High glucose+DMSO (n = 8), normal glucose+DMSO (n = 7), high glucose+BMS303141 (n = 8), normal glucose+BMS303141 (n = 8), two-way ANOVA and Holm-Sidak correction. e, CD8+ T cells. f, Ki-67+CD8+ T cells. g-h, WT lung DC incubated with 10 mM DCA (n = 12) or vehicle (n = 12) for 20h, then co-cultured for 4 days with OT-I-CD8+ T cells in normal (10mM) glucose. g, CD8+ T cells, co-cultured with cDC2, two-sided Mann-Whitney U-test. h, IFNγ+CD8+ T cells, co-cultured with cDC1, two-sided unpaired t-test, IFNγ+CD8+ T cells, co-cultured with cDC2, two-sided Mann-Whitney U-test. i-k, OT-I-CD8+ T cells, co-cultured for 4 days with lung WT cDC1 (n = 15), WT cDC2 (n = 15), Pdk2-4−/− cDC1 (n = 11) or Pdk2-4−/− cDC2 (n = 12), two-sided unpaired t-test. i, CD8+ T cells, co-cultured with cDC2. j, IFNγ+CD8+T cells, and k, Ki-67+CD8+ T cells, cocultured with cDC1 and cDC2. l-m, CUT&Tag chromatin profiling of lung DC from naïve WT and Akita mice. Scatter plots with mean normalized reads in peaks in WT and Akita, red lines x = y. l, H3K27ac. m, H3K27me3. n, Flow cytometry of lung DC, representative histograms of H3K27ac. o-s, WT Lung DC incubated with high (50mM) or normal (10mM) glucose and 10mM ANA for 20h, then co-cultured for 4 days with OT-I CD8+ T cells in normal (10mM) glucose (in the absence of inhibitor), two-way ANOVA and Holm-Sidak correction. o-p, cDC1 incubated with high (50mM) glucose+DM (n = 6), normal (10mM) glucose+DM (n = 8), high (50mM) glucose+ANA (n = 8), normal (10mM) glucose+ANA (n = 8). o, Ki-67+CD8+ T cells. p, IFNγ+CD8+ T cells. q-s, cDC2 incubated with high (50mM) glucose+DM (n = 9), normal (10mM) glucose+DM (n = 8), high (50mM) glucose+ANA (n = 8), normal (10mM) glucose+ANA (n = 8). q, CD8+ T cells. r, Ki-67+CD8+ T cells. s, IFNγ+CD8+ T cells. t-w, WT and Akita mice infected with 50pfu PR8 and administered 5 mg/kg ANA or DMSO daily from 3 days before infection, analyzed at 10 d.p.i.: WT+DMSO (n = 12), WT+ANA (n = 12), Akita+DMSO (n = 13), Akita+ANA (n = 14), pooled data from 2 experiments. t, cDC1, Kruskal Wallis with Dunn’s correction. u, cDC2, Kruskal Wallis test with Dunn’s correction. v, CD64+ DC, one-way ANOVA with Holm-Sidak. w, Ki-67+cDC1, one-way ANOVA with Holm-Sidak. x-z, Mice intraperitoneally administered STZ or PBS, then infected with 50pfu PR8 and administered 5 mg/kg ANA/vehicle (DM) daily from 3 days before infection, analyzed at 10 d.p.i.: PBS+DM (n = 13), PBS+ANA (n = 10), STZ+DM (n = 10), STZ+ANA (n = 11), pooled data from 2 experiments. x, cDC1, Kruskal Wallis with Dunn’s correction. y, cDC2, one-way ANOVA with Holm-Sidak. z, CD64+ DC, one-way ANOVA with Holm-Sidak. All data mean+s.e.m. AM, Alveolar macrophage.

Comment in

References

    1. Erener S. Diabetes, infection risk and COVID-19. Mol. Metab. 2020;39:101044. doi: 10.1016/j.molmet.2020.101044. - DOI - PMC - PubMed
    1. Mobasseri M, et al. Prevalence and incidence of type 1 diabetes in the world: a systematic review and meta-analysis. Health Promot. Perspect. 2020;10:98–115. doi: 10.34172/hpp.2020.18. - DOI - PMC - PubMed
    1. Katsarou A, et al. Type 1 diabetes mellitus. Nat. Rev. Dis. Primers. 2017;3:17016. doi: 10.1038/nrdp.2017.16. - DOI - PubMed
    1. Hu Y, et al. Prevalence and severity of corona virus disease 2019 (COVID-19): a systematic review and meta-analysis. J. Clin. Virol. 2020;127:104371. doi: 10.1016/j.jcv.2020.104371. - DOI - PMC - PubMed
    1. Barron E, et al. Associations of type 1 and type 2 diabetes with COVID-19-related mortality in England: a whole-population study. Lancet Diabetes Endocrinol. 2020;8:813–822. doi: 10.1016/S2213-8587(20)30272-2. - DOI - PMC - PubMed

Publication types

MeSH terms