. 2024 Jan;625(7994):366-376.
doi: 10.1038/s41586-023-06821-y. Epub 2023 Dec 13.

In vitro production of cat-restricted Toxoplasma pre-sexual stages

Affiliations

In vitro production of cat-restricted Toxoplasma pre-sexual stages

Ana Vera Antunes et al. Nature. 2024 Jan.

Abstract

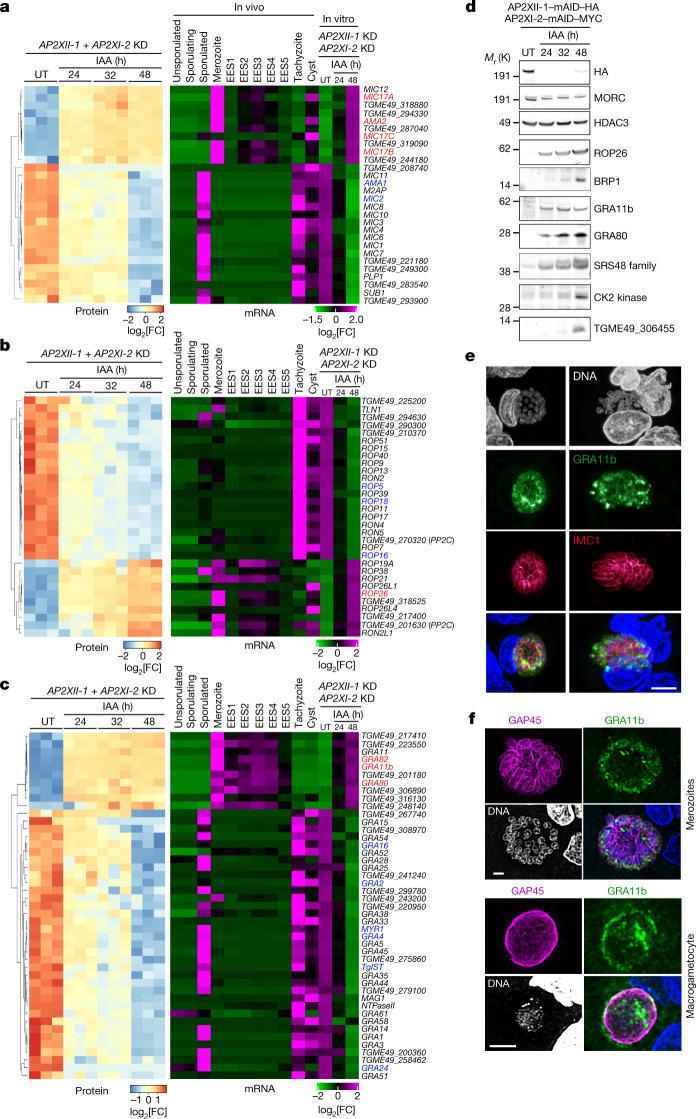
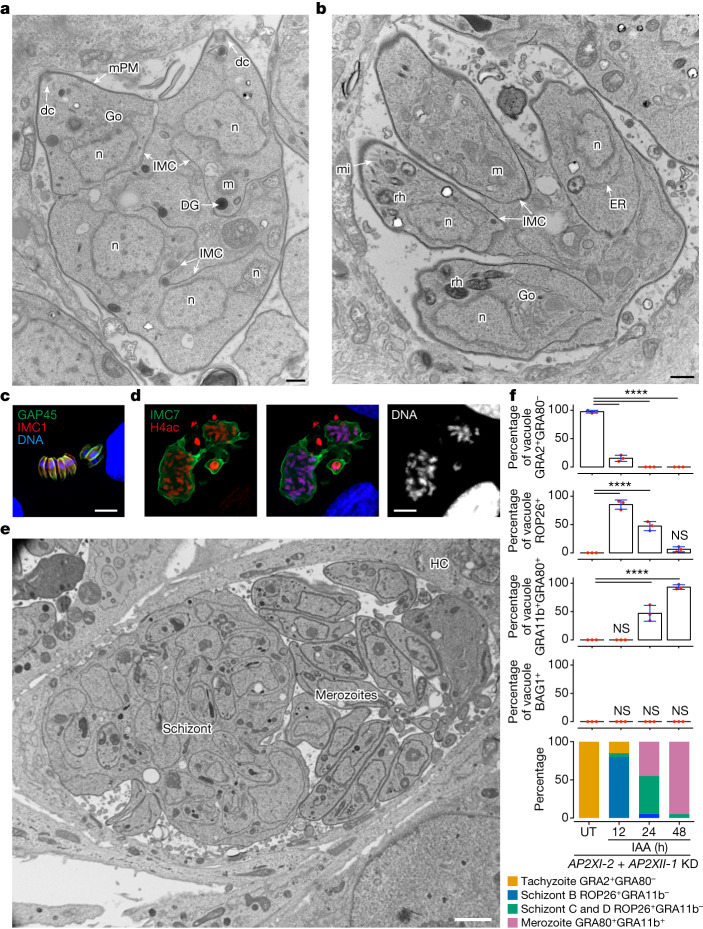
Sexual reproduction of Toxoplasma gondii, confined to the felid gut, remains largely uncharted owing to ethical concerns regarding the use of cats as model organisms. Chromatin modifiers dictate the developmental fate of the parasite during its multistage life cycle, but their targeting to stage-specific cistromes is poorly described1,2. Here we found that the transcription factors AP2XII-1 and AP2XI-2 operate during the tachyzoite stage, a hallmark of acute toxoplasmosis, to silence genes necessary for merozoites, a developmental stage critical for subsequent sexual commitment and transmission to the next host, including humans. Their conditional and simultaneous depletion leads to a marked change in the transcriptional program, promoting a full transition from tachyzoites to merozoites. These in vitro-cultured pre-gametes have unique protein markers and undergo typical asexual endopolygenic division cycles. In tachyzoites, AP2XII-1 and AP2XI-2 bind DNA as heterodimers at merozoite promoters and recruit MORC and HDAC3 (ref. 1), thereby limiting chromatin accessibility and transcription. Consequently, the commitment to merogony stems from a profound epigenetic rewiring orchestrated by AP2XII-1 and AP2XI-2. Successful production of merozoites in vitro paves the way for future studies on Toxoplasma sexual development without the need for cat infections and holds promise for the development of therapies to prevent parasite transmission.


Conflict of interest statement

The authors declare no competing interests.

Figures

Fig. 1
Fig. 1. Dual depletion of AP2XI-2 and AP2XII-1 induces merozoite-specific gene expression.
a, T. gondii has a multistage life cycle. The enteroepithelial cycle begins when a cat ingests tissue cysts, initiating asexual replication of merozoites (morphotypes A–E) leading to production of macro-gametes (MaG) and micro-gametes (MiG). These form oocysts that sporulate in an oxygen-rich environment. After ingestion, released sporozoites develop into tachyzoites causing acute infection. Later, owing to host immunity, they convert into bradyzoites forming tissue cysts. Created with BioRender.com. b, IFA images of infected cat intestine using GRA80 and GRA11b antibodies and rat serum; nuclei were counterstained with 4′,6-diamidino-2-phenylindole (DAPI). Scale bars, 25 μm (left column of images), 2 μm (top right four images) and 5 μm (bottom right three images). ce, Expression of the merozoite markers GRA11b (TGME49_237800; c), GRA80 (TGME49_273980; d) and GRA81 (TGME49_243940; e) was quantified in tachyzoites in which MORC, 1 of 14 MORC-associated AP2 proteins or AP2XII-1 and AP2XI-2 were genetically disrupted. Cas9–GFP measures genetic disruption efficacy (Extended Data Fig. 2f). Horizontal bars represent mean ± s.d. of vacuolar proteins intensity from n = 3 (c,d) and n = 4 (e) independent experiments (n = 50 GFP+ vacuoles per dot). The P values were determined using one-way analysis of variance (ANOVA) and Tukey’s test. PV, parasitophorous vacuole. f, Differential expression analysis was carried out with DESeq2 on raw rRNA-subtracted data, with Benjamini–Hochberg correction (P value threshold of 0.05). In the IAA (24 h)-induced double-KD parasites, 295 genes exhibited upregulation (log2[FC] > 2) and 195 genes exhibited downregulation (log2[FC] < −1), compared with untreated (UT) parasites. The heat map uses mean-centred data and k-means clustering (Pearson correlation) using iDEP.96, and shows log2-transformed data. Hierarchical clustering grouped genes and samples to elucidate expression patterns across different in vivo stages—merozoites, enteroepithelial stages (EESs) 1–5, tachyzoites, sporozoites and cysts—as documented in previous studies,,. We also examined these patterns in the context of in vitro MORC KD and HDAC3 inhibition with FR235222 (FR; ref. ). Transcript abundance is shown as log2[FC] based on the log-transformed mean transcripts per million kilobases (TPM) values from three biological replicates. Magenta indicates upregulation, and green indicates downregulation. Source Data
Fig. 2
Fig. 2. Co-depletion of AP2XI-2 and AP2XII-1 causes rewiring of organellar proteomes specialized in invasion and host–parasite interaction.
ac, Heat map showing hierarchical clustering analysis of selected microneme (a), rhoptry (b) and dense granule (c) mRNA transcripts and their corresponding proteins, which were significantly upregulated (log2[FC] > 2; P value < 0.05) or downregulated (log2[FC] < −1; P value < 0.05) following the simultaneous depletion of AP2XII-1 and AP2XI-2. The abundance of these transcripts is presented across different in vivo stages—merozoites, EES1–EES5 stages, tachyzoites, sporozoites and cysts—as documented in previous studies,,. Pertinent examples of tachyzoite and merozoite stage genes are highlighted in blue and red, respectively. Analysis parameters are those of Fig. 1f. d, Time-course western blot analysis of protein expression levels after depletion of AP2XII-1–mAID–HA and AP2XI-2–mAID–MYC. Samples were collected at the indicated time points after addition of IAA and probed with antibodies to HA, MORC, HDAC3, rhoptry proteins (ROP26 and BRP1), dense granule proteins (GRA11b and GRA80), the SRS48 family, a CK2 kinase (encoded by TGME49_307640) and the protein encoded by TGME49_306455. The experiment was repeated three times and a representative blot is shown. e,f, Maximum-intensity projection of a confocal microscopy z-stack from a meront in infected small intestine of a kitten. Antibodies to GRA11b (green) mark the dense granules and those to IMC1 (red) or GAP45 (magenta) mark the IMC of individual merozoites. Nuclei were counterstained with DAPI. Scale bars, 5 μm (e) and 2 μm (f). Source Data
Fig. 3
Fig. 3. Zoites depleted of AP2XI-2 and AP2XII-1 undergo endopolygeny with karyokinesis.
ac,eg, Electron micrographs of human foreskin fibroblast (HFF) cells infected with the RH (AP2XII-1 and AP2XI-2 KD) strain of T. gondii, untreated (f) or treated for 24 h (ac,e,g) with IAA. a, Emphasis on karyokinesis with fission. n1 to n3, nuclear profiles; a, apicoplast; m, mitochondrion; mIMC, mother IMC; HC, host cell. The arrowhead highlights an area of nuclear fission. b, Emphasis on apicoplast multiplication by growth and scission. c, Emphasis on Golgi multiplication from either side of the nucleus (n). Go1 and Go2, two Golgi apparatus. d, IFA of tachyzoites (untreated) and zoites depleted of AP2XII-1 and AP2XI-2 (12 h post-IAA). GAP45 staining marks the mother cell and its progeny. IMC7 staining specifically marks the diploid (left) and polyploid (right) mother cell. Cells were stained with Hoechst DNA-specific dye. Type B meronts are marked in yellow. e, Emphasis on appearance and role of the IMC segregating daughter buds in the mother cytoplasm. mc, mother conoid; rh, rhoptry. The arrowheads show areas devoid of the IMC and the asterisks highlight areas of nuclear fission. f, Emphasis on contrasting endodyogeny in tachyzoites (untreated condition). Two daughter buds formed apically and symmetrically (arrows). g, Emphasis on endopolygeny showing up to eight daughter buds and ultrastructure of rhoptries. mrh, mother rhoptry. h,i, Tachyzoites (untreated) and merozoites depleted of AP2XII-1 and AP2XI-2 (24 h post-IAA) were fixed and stained for ROP26 (TGME49_209985, in red) and IMC7 (green; h) or IMC1 (red) and GAP45 (green) along with Hoechst DNA-specific dye (i). Yellow arrows indicate IMC7 mature merozoites, and type C meronts are shown. Scale bars, 2 μm (a), 500 nm (b,c,eg), 5 μm (d,i) and 10 μm (h). G1, cell growth phase before DNA synthesis; S/M, DNA synthesis (S phase) and mitosis (M phase).
Fig. 4
Fig. 4. In vitro-induced merogony typified by the emergence of multiple zoite stages.
a,b,e, Electron micrographs of RH (AP2XII-1 and AP2XI-2 KD)-infected HFFs treated for 24 h (a,b) or 48 h (e) with IAA. a, Emphasis on protruding daughters sharing the mother plasma membrane (mPM). DG, dense granule; dc, daughter conoid. b, Emphasis on daughter cell emergence. mi, microneme; ER, endoplasmic reticulum. c, Representative image of neatly aligned elongated merozoites and forming fan-like structures as they hatch from the mother cell. Mature merozoites are co-stained with GAP45 (green), IMC1 (red) and Hoechst DNA-specific dye (blue). d, Image of a giant schizont delineated by IMC7 (green) showing polyploidy (n = 16). The nuclear structure is co-stained with Hoechst DNA-specific dye and hyperacetylated histone H4 (H4ac; red). e, Emphasis on a large parasitophorous vacuole containing a mega meront with many daughter buds residing with merozoites in the same parasitophorous vacuole. f, Time-course analysis of marker expression following AP2XII-1 and AP2XI-2 co-depletion. Data represent mean ± s.d. of vacuole staining for GRA2+GRA80, ROP26+, GRA11b+GRA80+ or BAG1+ from three experiments (n = 50 vacuoles per dot). Statistical evaluation was conducted using one-way ANOVA, followed by Tukey’s multiple comparison test. Graph at bottom: longitudinal tracking of tachyzoites and developmental morphotypes within vacuoles post-IAA treatment, integrating stage-specific aforementioned markers and parasite nuclei count (Hoechst and histone staining). Scale bars, 500 nm (a,b), 5 μm (c), 10 μm (d) and 2 μm (e).
Fig. 5
Fig. 5. AP2XII-1 and AP2XI-2 heterodimerize and interact with HDAC3 and MORC to form a repressive core complex.
a, Flag immunoprecipitation (IP) eluates in HFF cells infected with wild-type parasite (mock) or parasites stably expressing HA–Flag-tagged AP2XII-1 or AP2XI-2 protein were examined through label-free quantitative proteomics using MS (three replicates per condition) and are represented as a volcano plot. Each dot represents a protein. Black dashed lines show −log10[P value] < 7 and log2[FC] = 2.5 cutoffs; proteins above these thresholds are coloured in orange, with specific proteins in blue, purple and green as indicated. Raw data and a detailed statistical analysis are shown in Supplementary Table 4. b, Flag affinity eluates were analysed by western blot to detect MORC and HDAC3. This was repeated three times, and a representative blot is shown. c, Purification scheme for AP2XI-2–Strep and AP2XII-1–Flag or (Strep)2–AP2XI-2 and AP2IX-6–Flag coexpressed in Trichoplusia ni (Hi-5) insect cells. Created with BioRender.com. d, Co-purification of AP2XII-1–Flag through the pulldown of (Strep)2–AP2XI-2 by Strep-Tactin purification. e, AP2IX-6–Flag is not co-purified by (Strep)2–AP2XI-2. In d,e, (Strep)2–AP2XI-2 was detected using an in-house anti-AP2XII-2 antibody (Ab) and AP2XII-1–Flag or AP2IX-6–Flag was detected using an anti-Flag antibody. Input, soluble fraction (SF), flow-through (FT), high-salt wash (W2) and final wash (W3) deposits were deposited using 8 μl whereas eluted fractions (E1 to E8), separated by the protein molecular weight marker (PW) were deposited using 15 μl. Experiments were carried out at least twice for d,e. f, Strep-Tactin XT-purified (Strep)2–AP2XI-2 and AP2XII-1–Flag proteins were fractionated on a Superose 6 Increase gel filtration column. Input (concentrated Strep-Tactin elution) and gel filtration fractions were separated by SDS–polyacrylamide gel electrophoresis and analysed by both western blots using anti-Flag and in-house anti-AP2XII-2 antibodies and colloidal blue staining. Fraction numbers are indicated at the top of the gel. A.U. at 280 nm, absorbance units at 280 nm. g, MS-based proteomic analyses of fraction (F) 10 and fraction 14. Number of identified peptides (Pept.) and intensity-based absolute quantification (iBAQ) values are indicated (Supplementary Table 5). Source Data
Fig. 6
Fig. 6. Chromatin recruitment of HDAC3 and MORC by AP2XII-1 and AP2XI-2.
a, Heat map and profile analysis of the ChIP peak intensity for AP2XII-1 in parasites, either untreated or following co-depletion of AP2XII-1 and AP2XI-2. k-means clustering applied to the untreated sample shows a centred enrichment of AP2XII-1 at the TSS in genes from cluster 2. b, Profile comparison of AP2XII-1 ChIP peaks in untreated single- or double-KD strains, centred at the TSS (±8 kb) within cluster 2 genomic loci. c, Superposed profile plots indicate AP2XII-1, AP2XI-2, HDAC3 and MORC co-enrichment around the TSS of cluster 2 genes in the untreated state. The profile plots in ac were generated by Deeptools using summed occupancies over a bin size of 10. d, Integrated Genome Browser view illustrates AP2XII-1, AP2XI-2, MORC and HDAC3 enrichment and ATAC–seq chromatin accessibility before and after simultaneous AP2XII-1 and AP2XI-2 KD. The y axis shows the read density. e, HOMER analysis reveals global distribution of significant peaks within genomic features for AP2XI-2, AP2XII-1, HDAC3 and MORC ChIP experiments. TTS, transcription termination site. f, Profile and heat maps of summed occupancy using bin sizes of 10 show Tn5 transposase accessibility (ATAC–seq) for parasite genes centred at the TSS (±1 kb) in untreated and IAA-treated samples. High read intensity is in blue, with average signal profiles plotted above. g,h, The Tn5 transposase accessibility plot predicts nucleosomal occupancy. Mean occupancy profiles with a bin size of 10 of untreated and IAA-treated ATAC–seq signals across downregulated (n = 226) and upregulated genes (n = 281) show a nucleosome-depleted region (NDR) at the TSS and enriched, phased mono-nucleosome fragments at surrounding regions. i, Integrated Genome Browser screenshots of representative merozoite and tachyzoite genes highlight ChIP–seq signal occupancy for HA, MYC, MORC and HDAC3, in untreated and post-depletion conditions. RNA-seq data at different induction times and Tn5 transposase accessibility profiles for both conditions are also shown.
Extended Data Fig. 1
Extended Data Fig. 1. MORC binds to telomere and its depletion leads to subtelomeric non-coding RNAs reactivation and cell cycle disruption.
a, IGB views of MORC and HDAC3 ChIP-seq enrichment at chromosomal ends following MORC or AP2XII-1/AP2XI-2 depletion. Read density is on the y-axis, with telomeric repeats (TTTAGGG) marked. b, Nanopore direct RNA sequencing (DRS) read alignment of initially suppressed non-coding RNAs, observable post-MORC knockdown via IAA on the subtelomeric ends of chromosome III and XII. The y-axis shows read-depth. Positive strand reads are colored in magenta while negative strand reads are colored in blue. c, Expression levels of MORC over time are presented through IFA on cells infected with RH MORC–mAID–HA. Cells were fixed, permeabilized, and probed with HA antibodies (green) and Hoechst DNA-specific dye.
Extended Data Fig. 2
Extended Data Fig. 2. Evaluating stage-specific markers both in vitro and in vivo across varied genetic backgrounds.
a, Domain architectures of MORC AP2 partners, originally identified via immunoprecipitation and MS-proteomics, showcasing the AP2 (APETALA2) and ACDC (AP2-Coincident Domain primarily at the Carboxy-terminus) domains, as predicted by SMART and PFAM. b, Representative vacuoles of ΔBFD1/DD-BFD1-Ty parasites grown for 48 h with vehicle or 3 μM Shield-1, stained for Ty or DBA (red) and GRA80 (green). The graph on the right quantifies results (n = 50 vacuoles/dot), statistical analysis performed using one-tailed Student’s t-test. Data are presented as mean values ± s.d. c, DBA staining (red) highlighted the glycosylated cyst wall in brain sections of mice chronically infected with ME49 type II strain. The sections were counterstained against GRA80 (green) and Hoechst DNA-specific dye. d, IFA on HFFs infected with RH MORC KD lineage harboring mCherry-tagged GRA81 (TGME49_243940), a merozoite protein. UT and IAA-treated zoites were probed for GRA11b (green) and mCherry (red), and stained with Hoechst DNA-specific dye. e, Confocal microscopy of a meront in infected small intestine of a kitten co-stained with anti-GRA11b (cyan) and anti-GRA82 (red) antibodies, with DAPI employed for nuclear counterstaining. f, Representative images of intracellular parasites with disrupted AP2 genes due to transient CRISPR/Cas9 plasmid transfection. Cas9-GFP expression (green) indicates disruption, while merozoite marker GRA80 (red) is monitored in AP2 inactivated (GFP-positive) zoites. g, Expression levels of AP2XII-1 and AP2XI-2 in the single and double KD strains were monitored over time using Western blot. Post-IAA addition, samples were collected at the indicated time points and probed with HA, MYC, and HDAC3 antibodies. This was repeated three times, and a representative blot is displayed. Source Data
Extended Data Fig. 3
Extended Data Fig. 3. Quantification of stage-specific markers expression levels in the context of AP2XII-1/AP2XI-2 co-depletion, MORC depletion and BDF1 overexpression.
a-b, MORC and single or double AP2XII-1/AP2XI-2 KD parasites, untreated or IAA-treated (24 and 48 h), were compared with ΔBFD1/DD-BFD1-Ty parasites treated with vehicle or 3 μM Shield-1 (48 h). Parasites were stained with GRA11b (red) and GRA80 (green) antibodies, and Hoechst DNA-specific dye. Representative images of double KD vacuoles are shown on the left (a) the right graph (b) displays quantified results (n = 50 vacuoles/dot), analyzed using one-way ANOVA and Tukey’s test. Data are presented as mean values ± s.d. c, Levels of merozoite markers after AP2VIIa-3, AP2VIII-4, and AP2VIII-7 depletion were compared with those after AP2XII-1/AP2XI-2 co-depletion (48 h). Displayed data represent mean ± s.d. of GRA11b(+)/GRA80(+) vacuole staining from three experiments (n = 50 vacuoles/dot). Statistics involved one-way ANOVA and Tukey’s multiple comparison test. d-e, MORC and single or double AP2XII-1/AP2XI-2 KD parasites, untreated or IAA-treated (24 and 48 h) were co-stained with GRA11b (red) and GRA82 (green) antibodies. Representative images of double KD vacuoles are shown on the left (d) the right graph (e) displays quantified results (n = 50 vacuoles/dot), analyzed using one-way ANOVA and Tukey’s test. Data are presented as mean values ± s.d. f-g, Representative vacuoles of AP2XII-1/AP2XI-2 KD parasites, untreated or IAA-treated (48 h) (f), stained for GRA2 (red) and GRA80 (green); the graph on the right (g) quantifies results (n = 50 vacuoles/dot, 3 replicates/conditions), using one-tailed Student’s t-test. h-j, Representative images of MORC, double AP2XII-1/AP2XI-2 KD, and ΔBFD1/DD-BFD1-Ty treated with respective inducers and stained with DBA and bradyzoite markers BAG1 (red) or BCLA (green) (h). Graphs show % of BAG1 (i) or BCLA (j) positive vacuoles across three experiments (n = 50 vacuoles/dot), statistical analysis by one-way ANOVA and Tukey’s test. Data are presented as mean values ± s.d. k, IAA-induced (24 h) vacuoles of MORC KD parasites containing GRA81 tagged with mCherry (in red), co-stained with a bradyzoite marker (BCLA, green), and Hoechst DNA-specific dye.
Extended Data Fig. 4
Extended Data Fig. 4. Co-depletion of AP2XI-2 and AP2XII-1 induces the expression of merozoite proteins, including a large repertoire of parasite surface proteins.
a, Principal Component Analysis (PCA) of mRNA sequencing data from biological triplicates of single KD or double KD parasites. Samples were collected from untreated conditions or after 24 or 48 h of IAA treatment. b, Venn diagram illustrating the overlapping genes that were upregulated in the three IAA-treated knockdown strains. Significant genes (FC > 8) were identified using DESeq2 with an independent-hypothesis-weighted approach and Benjamini–Hochberg false discovery rate (FDR) < 0.1. c, M-pileup representation of aligned Nanopore DRS reads at genes differentially expressed following IAA-induced knockdown of AP2XII-1 and AP2XI-2 individually or in combination. d, PCA illustrates the biological and technical variance between triplicate proteome samples extracted after 24-, 32-, and 48-hours post AP2XII-1/AP2XI-2 knockdown induction, juxtaposed with the untreated sample (UT). e, Histogram delineating the distribution of up- and down-regulated proteins (n = 276 and 285, respectively) post AP2XII-1 and AP2XI-2 knockdown, categorized by their life stage association. f, Representative vacuoles of ΔBFD1/DD-BFD1-Ty parasites grown for 48 h with vehicle or 3 μM Shield-1, stained for ROP26 (green), DBA (red) and Hoechst DNA-specific dye (blue). g-h, Heat map showing hierarchical clustering analysis of selected SRS (g) and Family A (h) mRNA transcripts and their corresponding proteomic enrichments, which were significantly upregulated (Log2 FC > 2; P-value < 0.01) or downregulated (Log2 FC < −1; P-value < 0.01) following the simultaneous depletion of AP2XII-1 and AP2XI-2. The abundance of these transcripts is presented across different in vivo stages - merozoites, EES1-EES5 stages, tachyzoites, sporozoites, and cysts, as documented in prior studies,,. Analysis parameters are those of Fig. 1f. g, Created with BioRender.com.
Extended Data Fig. 5
Extended Data Fig. 5. In vitro development of pre-gametes stages.
a, Infectivity of the RH_AP2XII-1-mAID-HA/AP2XI-2-mAID-MYC strain was assessed using plaque assays, comparing untreated to IAA-treated for 7 days. Statistical significance was evaluated using Mann-Whitney. n.d. = not detected. b-d, IFA of tachyzoites (UT) and AP2XII-1/AP2XI-2-depleted zoites (at indicated time post-IAA) were fixed and stained with (b) antibodies of AtRX clone 11G8 (red) and IMC7 (green), (c) IMC7 or pan-acetylated histone H4 (red) and GAP45 or IMC7 (green), (d) IMC1 (red) and GAP45 (green). The cells were co-stained with DNA-specific Hoechst dye (white or blue). Morphotypes B, C and D meronts are highlighted in yellow. e, An electron micrograph of RH (AP2XII-1 KD/AP2XI-2 KD)-infected HFFs treated with IAA for 24 h shows an advanced stage of daughter individualization, characterized by polarized inner membrane complex (IMC) and apical conoid. f, Untreated tachyzoites (UT) and merozoites depleted of AP2XII-1/AP2XI-2 (24 h post-IAA) were marked with H3K9me3 (red), IMC7 (green), and Hoechst DNA-specific dye. Yellow and white arrows respectively highlight mother and daughter conoids. g, Fully formed merozoites (24 h post-IAA) were stained with GAP45 (green) and DNA-specific Hoechst dye. h, An electron micrograph of IAA-treated parasites shows fully formed merozoites aligned in the PV with apex directed towards the PV membrane. Go: Golgi apparatus, rh: rhoptry, mi: microneme, n: nucleus (plus posterior that in tachyzoite), PLVAC: plant-like vacuolar compartment, dc: daughter conoid, IMC: inner membrane complex, DG: dense granule, Ac: acidocalcisome, LD: lipid droplet, ER: endoplasmic reticulum, hER: host endoplasmic reticulum, m: mitochondrion, hm: host mitochondrion.
Extended Data Fig. 6
Extended Data Fig. 6. Mature merozoites and their special substructural features.
a, AP2XII-1/AP2XI-2-depleted meronts (24 h post-IAA) were fixed and stained with ROP26 (red), GRA11b (green) and Hoechst DNA-specific dye. Yellow arrows indicate fully developed merozoites. (b, d, e, g, h) Electron micrograph images of RH (AP2XII-1 KD/AP2XI-2 KD)-infected HFFs treated for 48 h with IAA. b, Emphasis on changes in body shape of merozoite (sausage). c, AP2XII-1/AP2XI-2-depleted type E meronts (48 h post-IAA) were fixed and stained with IMC7 (red), GAP45 (green) and Hoechst DNA-specific dye. d, Emphasis on conoid extrusion and same organelle content as in tachyzoite. n: nucleus, Go: Golgi apparatus, rh: rhoptry, m: mitochondrion, mi: microneme, DG: dense granule, LD: lipid droplet, mp: micropore, PLVAC: plant-like vacuolar compartment. Red circles showing extruded conoid. e, Emphasis on two other morphological transformations of merozoites, either very large (asterisks) or tubular (arrows) in PV with large lumen. f, AP2XII-1/AP2XI-2-depleted type E meronts (48 h post-IAA) were fixed and stained with IMC1 (red), GAP45 (green) and Hoechst DNA-specific dye. (g and h) Emphasis on thin parasitic forms (arrows) containing mitochondria and ribosomes. m: mitochondrion.
Extended Data Fig. 7
Extended Data Fig. 7. Microscopic analysis of endopolygeny post-AP2XII-1/AP2XI-2 co-depletion.
a, Untreated tachyzoites (UT) and zoites depleted of AP2XII-1/AP2XI-2 (24 h post-IAA) are stained with HA (red) and MYC (green) to identify AP2XII-I-mAID-HA and AP2XI-2-mAID-MYC respectively. DNA staining was accomplished using Hoechst dye. Polyploid meronts are indicated by a yellow arrow. b, Centrin distribution (red) within the dividing mother fibroblast cell. c, Untreated tachyzoites (UT) and AP2XII-1/AP2XI-2-depleted polyploid zoites, 24 h post-IAA treatment, stained with centrin (red), GAP45 (green), and Hoechst DNA-specific dye. d, Detailed observation of the diversity in pre-gamete stages 16 h after simultaneous depletion of AP2XII-1 and AP2XI-2. Both zoite and host cell nuclei are marked with pan-acetylated histone H4 (red) and Hoechst DNA-specific dye (blue), whereas polyploid meronts are identified by IMC7 staining. Red arrows designate completely developed merozoites, while morphotypes A and B are highlighted in orange and red, respectively.
Extended Data Fig. 8
Extended Data Fig. 8. Contribution of AP2XII-1 and AP2XI-2 to MORC and HDAC3 recruitment on chromatin.
a, Heatmap and profile analysis of APXII-1 (HA), AP2XI-2 (MYC), HDAC3, and MORC ChIP-seq peak intensity in double KD parasites, comparing untreated (UT) to co-depleted (24 h post-IAA) conditions. Density profiles centered at TSS (± 8 kb) and heat maps of peak density are shown, with color scales indicating signal intensity. b-d, Comparison of chip peak profiles in cluster 2 genomic loci (as defined in Fig. 6a), centered at TSS (± 8 kb), for (b) AP2XI-2 (HA or MYC antibody) in single AP2XI-2 KD or double knockdown in absence of auxin treatment; (c) AP2XII-1 (HA), HDAC3, and MORC in AP2XII-1 KD; (d) AP2XI-2 (HA), HDAC3, and MORC in AP2XI-2 KD. e, Heatmap and profile analysis of APXII-1 (HA), AP2XI-2 (MYC), HDAC3, and MORC ChIP-seq peak intensity in single KD parasites, comparing untreated (UT) to depleted (24 h post-IAA) conditions. Average signal profiles centered at TSS (± 8 kb) and heat maps of peak density are shown, with color scales indicating signal intensity. For all panels, Deeptools analysis used summed occupancies within a bin size of 10.
Extended Data Fig. 9
Extended Data Fig. 9. Representative merozoite genes and their regulation by AP2XII-1 and AP2XI-2 and their repressive partners MORC and HDAC3.
a, HOMER analysis reveals global distribution of significant Tn5 accessibility peaks across all genomic features in the AP2XII-1/AP2XI-1 double knockdown strain. Similar profiles were observed between untreated and treated conditions. b, Comparison profile of ChIP-seq summed occupancies over a bin size of 10 for AP2XI-2 (HA) and Tn5 accessibility density at all gene loci centered at TSS (± 3 kb) in the AP2XII-1/AP2XI-2 double knockdown strain without auxin treatment. (c-e), IGB screenshots illustrate representative genomic regions containing merozoite genes, displaying ChIP-seq signal occupancy, ATAC-seq chromatin accessibility profiles, and nanopore DRS data, similar to Fig. 6i.
Extended Data Fig. 10
Extended Data Fig. 10. AP2XI-2 can bind to chromatin even in the absence of AP2XII-1.
a, AP2XII-1 (HA) and AP2XI-2 (MYC) expression levels and subcellular localization were assessed using IFA following AP2XII-1 depletion. Hoechst DNA-specific dye was used for counterstaining. b, Heatmap and profile analysis of APXII-1 (HA) and AP2XI-2 (MYC) ChIP-seq mean occupancy over a bin size of 10 in APXII-1 KD parasites with AP2XI-2-MYC knock-in (KI), comparing untreated (UT) and co-depleted (24 h post-IAA) conditions. Average signal profiles centered at TSS ( ± 8 kb) and heat maps of peak density display signal intensity. c, IGB screenshots depict the enrichment of AP2XII-1 and AP2XI-2 at the GRA80 and GRA81 loci in the context of AP2XII-1 single knockdown. d, M-pileup representation of aligned Nanopore DRS reads at genes up-regulated following IAA-induced knockdown of AP2XII-1 and AP2XI-2 individually or in combination. e, IGB screenshot highlighting the genomic region of the merozoite-specific purine nucleoside phosphorylase (PNP) gene, which is up-regulated upon IAA treatment independently of MORC and HDAC3. f, IGB screenshots displaying the genomic regions of the rhoptry genes (ROP16, ROP18) and the microneme gene (MIC1), demonstrating their repression in IAA-treated parasites. g, IGB screenshots showcasing the AMA1 gene family. (e-g) ChIP-seq signal occupancy, ATAC-seq chromatin accessibility profiles, and nanopore DRS are visualized in a manner consistent with Fig. 6i.
Extended Data Fig. 11
Extended Data Fig. 11. AP2XII-1 and AP2XI-2 co-depletion induces a downstream network of secondary transcription factors to guide merogony.
a, IGB screenshots displaying the genomic regions of the rhoptry genes (RON4, ROP39, ROP5) repressed in IAA-treated parasites in an AP2XII-1/AP2XI-2-independent manner. ChIP-seq signal occupancy, ATAC-seq chromatin accessibility profiles, and nanopore DRS are visualized in a manner consistent with Fig. 6i. b, Heat map showing hierarchical mRNA clustering analysis (Pearson correlation) of AP2 TFs regulated by simultaneous depletion of AP2XII-1 and AP2XI-2. Shown is the abundance of their transcripts at different developmental stages, namely merozoites, EES, tachyzoites, and cysts. The color scale indicates the log2-transformed fold changes. c-d, IGB screenshots of genomic regions with secondary transcription factors, including C2H2 Zinc Finger and AP2s, exhibiting activated expression in IAA-treated parasites. Displayed are ChIP-seq signal occupancy, ATAC-seq chromatin accessibility profiles, and nanopore DRS data, following the same representation as in Fig. 6i.
Extended Data Fig. 12
Extended Data Fig. 12. Modeling of the modus operandi of AP2XII-1/AP2XI-2.
a, Inspired by a 2.2 A crystal structure (pdb: 3IGM), the model shows that AP2XII-1 and AP2XI-2 can interact with DNA through either homodimeric or heterodimeric forms. These configurations influence DNA looping by stabilizing or forming domain-swapped dimers. b, AP2XI-2 and AP2XII-1 together fully silence merozoite gene expression (red light). A single KD only partially represses gene expression (orange light). When both are knocked down, genes are fully expressed (green light). Even with one AP2 missing, the remaining one can form a homodimer to partially repress transcription (Extended Data Fig. 10c, d). We hypothesize that each AP2 forms a fragile but stable homodimer, allowing mild gene expression due to easy disassociation from DNA. In contrast, heterodimers bind strongly to DNA, resulting in complete gene silencing. c, MORC/HDAC3 forms multiple partnerships with primary AP2, keeping chronic and sexual-stage genes in a persistently repressed chromatin state. The repressor complex drive the hierarchical expression of secondary AP2s, which may enforce the unidirectionality of the life cycle by influencing the gene expression of their respective stages. In tachyzoites, genes specific to this stage (SAG1) are expressed, while those related to merozoites (GRA11b) are repressed by AP2XII-1/AP2XI-2. Other primary AP2s help in recruiting MORC to other stage-specific genes, such as those for sporozoites and bradyzoites, to silence their expression. Additionally, MORC has a non-genic function where it binds to telomeric repeats, possibly facilitating silencing at the chromosome ends (Extended Data Fig. 1). Co-depletion of AP2XII-1/AP2XI-2 trigger merozoite gene activation, speeding up merogony. Secondary AP2s like AP2IX-1 then emerge, repressing tachyzoite-specific genes like SAG1. This second wave of TFs could also act as activators for pre-sexual genes not directly controlled by the primary AP2s (e.g., PNP; Extended Data Fig. 10e), offering an alternative route to merozoite development. The MORC/HDAC3-containing complexes maintain stage-specific and telomeric gene silencing, demonstrating their selective roles. ac, Created with BioRender.com.

Update of

References

    1. Farhat DC, et al. A MORC-driven transcriptional switch controls Toxoplasma developmental trajectories and sexual commitment. Nat. Microbiol. 2020;5:570–583. doi: 10.1038/s41564-020-0674-4. - DOI - PMC - PubMed
    1. Bougdour A, et al. Drug inhibition of HDAC3 and epigenetic control of differentiation in Apicomplexa parasites. J. Exp. Med. 2009;206:953–966. doi: 10.1084/jem.20082826. - DOI - PMC - PubMed
    1. Kim K. The epigenome, cell cycle, and development in Toxoplasma. Annu. Rev. Microbiol. 2018;72:479–499. doi: 10.1146/annurev-micro-090817-062741. - DOI - PubMed
    1. Farhat DC, Hakimi MA. The developmental trajectories of Toxoplasma stem from an elaborate epigenetic rewiring. Trends Parasitol. 2022;38:37–53. doi: 10.1016/j.pt.2021.07.016. - DOI - PubMed
    1. Davoli T, et al. Persistent telomere damage induces bypass of mitosis and tetraploidy. Cell. 2010;141:81–93. doi: 10.1016/j.cell.2010.01.031. - DOI - PMC - PubMed

MeSH terms