Randomized Controlled Trial
. 2024 Jan;625(7993):157-165.
doi: 10.1038/s41586-023-06838-3. Epub 2023 Dec 13.

Bioactive glycans in a microbiome-directed food for children with malnutrition

Affiliations
Randomized Controlled Trial

Bioactive glycans in a microbiome-directed food for children with malnutrition

Matthew C Hibberd et al. Nature. 2024 Jan.

Abstract

Evidence is accumulating that perturbed postnatal development of the gut microbiome contributes to childhood malnutrition1-4. Here we analyse biospecimens from a randomized, controlled trial of a microbiome-directed complementary food (MDCF-2) that produced superior rates of weight gain compared with a calorically more dense conventional ready-to-use supplementary food in 12-18-month-old Bangladeshi children with moderate acute malnutrition4. We reconstructed 1,000 bacterial genomes (metagenome-assembled genomes (MAGs)) from the faecal microbiomes of trial participants, identified 75 MAGs of which the abundances were positively associated with ponderal growth (change in weight-for-length Z score (WLZ)), characterized changes in MAG gene expression as a function of treatment type and WLZ response, and quantified carbohydrate structures in MDCF-2 and faeces. The results reveal that two Prevotella copri MAGs that are positively associated with WLZ are the principal contributors to MDCF-2-induced expression of metabolic pathways involved in utilizing the component glycans of MDCF-2. The predicted specificities of carbohydrate-active enzymes expressed by their polysaccharide-utilization loci are correlated with (1) the in vitro growth of Bangladeshi P. copri strains, possessing varying degrees of polysaccharide-utilization loci and genomic conservation with these MAGs, in defined medium containing different purified glycans representative of those in MDCF-2, and (2) the levels of faecal carbohydrate structures in the trial participants. These associations suggest that identifying bioactive glycan structures in MDCFs metabolized by growth-associated bacterial taxa will help to guide recommendations about their use in children with acute malnutrition and enable the development of additional formulations.


Conflict of interest statement

A.L.O. and D.A.R. are co-founders of Phenobiome, a company pursuing development of computational tools for predictive phenotype profiling of microbial communities. C.B.L. is a co-founder of Infinant Health, interVenn Bio and BCD Bioscience—companies involved in the characterization of glycans and developing carbohydrate applications for human health. A joint patent application between Washington University in St Louis and icddr,b has been filed, entitled “Synbiotic combination of selected strains of P. copri and dietary glycans to treat malnutrition”, with J.I.G., M.C.H., D.M.W., H.-W.C., Y.W., M.J.B. and T.A. listed as co-inventors (PCT/US2023/018738). The authors are committed to the principle of Global Access; patented technologies will be made available and accessible at an affordable price to those in need throughout the world.

Figures

Fig. 1
Fig. 1. Identification of WLZ-associated MAGs.
a, The human study design. b, The results of linear mixed-effects modelling of the relationship (indicated by a ~) between MAG abundance and WLZ scores for all of the trial participants, irrespective of treatment. Bacterial genera that are prevalent in the list of MAGs significantly associated with WLZ are coloured by their taxonomic classification. PID, participant identifier. c, The results of GSEA of WLZ-associated MAGs ranked according to the magnitude of the difference in their rate of change in abundance over time in response to MDCF-2 versus RUSF treatment. The plotted values indicate the mean ± s.e.m. log2-transformed fold change in the β3(treatment group × study week) coefficient for 589 biologically independent samples across the n = 59 participants assigned to each of the two treatment groups. The statistical significance of enrichment (q value, GSEA) of MAGs that are positively or negatively associated with WLZ is shown.
Fig. 2
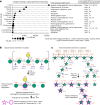
Fig. 2. Polysaccharides in MDCF-2, RUSF and their component food ingredients.
a, The principal polysaccharides in MDCF-2, RUSF and their component food ingredients. Data are mean ± s.d. n = 3 measurements of each food sample. Statistical analysis was performed using two-sided t-tests; *P < 0.05, ***P < 0.001. Points depict technical replicates. b,c, The structures of galactans (b) and mannans (c) in MDCF-2. f, furanose.
Fig. 3
Fig. 3. Principal taxonomic features and expressed functions of the faecal microbiomes of MDCF-2- and RUSF-treated individuals.
a, Significant enrichment of taxa (q < 0.1; GSEA) along PC1 of MAG abundance or transcript abundance. NES, normalized enrichment score. b, Carbohydrate-utilization pathways significantly enriched (q < 0.1; GSEA) by treatment group (β1, circles) or the interaction of treatment group and study week (β3, squares). Right, each point represents a MAG transcript assigned to each of the indicated functional pathways (rows), ranked according to the direction and statistical significance of their differential expression in MDCF-2 versus RUSF treated participants (defined as the direction of the fold change × −log10[P]). Transcripts are coloured by their MAGs of origin. The larger, black outlined circles indicate leading-edge transcripts assigned to the pathway described on the left. c, Carbohydrate-utilization pathways significantly enriched (q < 0.1; GSEA) in upper- versus lower-quartile WLZ responders (β1, diamonds), or the interaction between WLZ-response quartile and study week (β3, triangles) (see linear mixed-effects model in the Methods section ‘Microbial RNA-seq analysis of MAG gene expression’). Right, transcripts assigned to each functional pathway. The colouring and outlining of circles have the same meaning as in b. The enrichment of glucuronate and galacturonate pathways was driven by the same transcripts; these pathways were therefore considered to be a single unit. Supporting information is provided in Supplementary Tables 10–14.
Fig. 4
Fig. 4. Conservation and expression of PULs in P. copri MAGs and isolates.
a, PUL conservation in P. copri MAGs identified in study participants (blue font) and in P. copri isolates cultured from Bangladeshi children (red font). The marker-gene-based phylogenetic tree (left) indicates the relatedness of P. copri MAGs and isolates. The β1(WLZ) coefficient for each MAG is shown on the right; significant associations (q < 0.05) are indicated by asterisks. The matrix in the centre depicts PUL conservation among P. copri MAGs and cultured isolates relative to Bg0019. The number of differentially expressed PUL transcripts in MAGs Bg0018 and Bg0019 are shown within the coloured cells (identified from comparisons of MDCF-2- versus RUSF-treated participants, and/or from MDCF-2-treated participants in the WLZ-response upper versus lower quartiles; transcript annotations are shown in Supplementary Table 15). b, The relationship between PUL conservation in the 11 P. copri MAGs identified in study participants and the association of each MAG abundance with WLZ. The grey ribbon indicates the 95% confidence interval. c,d, In vitro growth assays for five P. copri isolates in defined medium supplemented with individual purified glycans representative of those in MDCF-2. n = 3 replicates per condition; two independent experiments were performed; representative results from one are shown. c, The results obtained with P. copri BgF5_2, the isolate of which the PUL profile is most similar to MAGs Bg0019/Bg0018. Data are the mean ± s.d. (grey ribbons) optical density at 600 nm (OD600). d, Summary of PUL conservation and growth rates for the five P. copri strains tested (Extended Data Fig. 5a). Each coloured box lists PULs in each strain (rows) that are predicted to metabolize each carbohydrate. PULs are denoted as functionally conserved (black, bold), structurally distinct but functionally similar (black, not bold) or not conserved (grey) according to the scheme shown in a. The colour intensity surrounding each box indicates the mean maximum growth rate for each isolate in the presence of each glycan.
Fig. 5
Fig. 5. Treatment-responsive glycosidic linkages, structures of their polysaccharide sources, cleavage sites and predicted products of CAZyme activity.
a, Significant changes in faecal glycosidic linkage levels (q < 0.05) over time in upper- compared with lower-quartile WLZ responders. Probable polysaccharide sources for each of the 14 glycosidic linkages are noted in the middle (Supplementary Fig. 3). PULs present in P. copri MAGs Bg0018 and Bg0019 with known or predicted cleavage activity for the listed polysaccharide sources are noted on the right. b,c, The structures of the MDCF-2 polysaccharides galactomannan (b) and branched arabinan (c), plus glycan fragments and their constituent glycosidic linkages predicted to be liberated by PULs conserved between P. copri MAGs Bg0019 and Bg0018 (the results of PUL conservation analysis are shown in Fig. 4a). The arrows indicate putative sites of cleavage by CAZymes according to their known or predicted enzyme activities. The size of each arrow (large versus small) denotes the relative likelihood (high versus low, respectively) of glycosidic linkage cleavage by the indicated CAZymes, considering steric hindrance at glycan branch points.
Extended Data Fig. 1
Extended Data Fig. 1. Bioinformatic workflow for MAG assembly, refinement, and quantitation.
(a) Pipeline for MAG assembly from short-read only or short-read plus long-read shotgun sequencing data. Steps are indicated alongside the boxes, while the bioinformatic tools employed to accomplish each step are described within each box. (b) Comparison of MAG assembly summary statistics derived from CheckM (completeness, contamination) or Quast (number, length and N50 of contigs) for n = 82 high-quality MAGs obtained from short- plus long-read hybrid assemblies versus n = 918 high-quality MAGs from short-read only assembly methods. MAGs were assembled from shotgun sequencing data obtained from n = 942 biologically independent faecal samples as described in Methods. Boxplots show the median, first and third quartiles; whiskers extend to the largest value no further than 1.5 × the interquartile range. ***, P < 0.001 (Wilcoxon test, two-sided).
Extended Data Fig. 2
Extended Data Fig. 2. Taxonomy and functional characteristics of WLZ-associated MAGs.
(a) Left subpanel, density plot showing WLZ-associated MAGs tabulated based on their genus-level classification. β1 refers to the coefficient in the linear mixed effects model presented at the bottom of the figure. Genera containing >3 significantly WLZ-associated MAGs are shown. Right subpanel, number of statistically significant WLZ-associated MAGs assigned to each genus depicted in the left subpanel. (b) Enrichment of metabolic pathways in WLZ- and treatment-associated MAGs. MAGs were ranked by their WLZ association (negative to positive) or treatment association (RUSF-associated to MDCF-2-associated) and GSEA was employed to determine overrepresentation of pathways in MAGs at the extremes of each ranked list. The results (Normalized Enrichment Score, NES) only include pathways that display a statistically significant enrichment (q<0.05, GSEA) in both the WLZ-associated MAG and treatment-associated MAG analyses. For carbohydrate utilization pathways, disaccharides and oligosaccharides are indicated with an asterisk.
Extended Data Fig. 3
Extended Data Fig. 3. LC-MS analysis of glycans present in MDCF-2, RUSF and their component ingredients.
(a, b) Analysis of monosaccharides (panel a) and glycosidic linkages (panel b) liberated by hydrolysis of glycans present in MDCF-2 and RUSF, and in the food ingredients used to formulate them. Mean±SD are plotted for n = 4 independent samples. *, P < 0.05, **, P < 0.01 (t-test, two-sided). Points depict individual samples.
Extended Data Fig. 4
Extended Data Fig. 4. Principal components analysis of transcript and MAG abundances in faecal specimens.
(a, b) Percent variance explained by the top 10 principal components of a PCA analysis including abundance of MAGs (panel a) at the 0, 2, 4, 8, 12, and 16 week time points in Fig. 1a, or transcripts (panel b) at 0, 4, and 12 weeks. (c) Significantly enriched taxa (q < 0.05, GSEA) along the first three principal components (PC1-PC3) of the faecal microbiome or meta-transcriptome PCA.
Extended Data Fig. 5
Extended Data Fig. 5. Growth of Bangladeshi P. copri strains in defined medium supplemented with purified polysaccharides.
(a) Growth curves in defined medium containing individual purified polysaccharides similar to those that are abundant in or unique to MDCF-2 compared to RUSF. Curves describe mean values ± sd for OD600 measurements (n = 3 replicates/growth condition). (b) Growth of P. copri strains versus a PUL-based prediction of their growth phenotypes. Growth is expressed as ‘+’ or ‘-’ for each of the triplicate cultures according to whether a threshold OD600 > 0.25 was attained. The colour key expresses ‘prediction’ as the fraction of possible cleavage sites in each polysaccharide that are known or predicted to be targeted by the PUL-associated CAZymes of a given strain. (c) CAZymes present in the PULs of each strain and their predicted activities against glycosidic linkages in each purified polysaccharide. Linkages in a polysaccharide that are predicted to be targeted by PUL-associated CAZymes are labelled ‘a,b…y’ in both panels b and c. All CAZyme family assignments for a given enzymatic activity are shown; the family that displays this activity most commonly is noted in bold font.
Extended Data Fig. 6
Extended Data Fig. 6. LC-MS analysis of monosaccharide consumption during growth of cultured Bangladeshi P. copri strains in defined medium supplemented with purified polysaccharides.
Heatmaps representing bacterial consumption of monosaccharides present in the different polysaccharides. UHPLC-QqQ-MS-based monosaccharide analysis was performed using defined medium harvested from monocultures of the P. copri stains. Control incubations did not contain added bacteria. Cells in each matrix show the mean difference (at the end of the 189 hour-long incubation) between the concentration of each monosaccharide in three technical replicates of each strain/polysaccharide combination compared to the corresponding uninoculated control.
Extended Data Fig. 7
Extended Data Fig. 7. Changes in levels of faecal glycosidic linkages and expression of P. copri CAZyme genes after MDCF-2 treatment.
(a) Boxplot of changes in the levels of faecal glycosidic linkages relative to initiation of treatment among upper and lower WLZ quartile responders. Levels of these 14 linkages increased to a significantly greater extent over time in the upper vs lower WLZ response quartiles (Model: linkage abundance ~ WLZ-response quartile × study week + (1|PID)). Boxplots indicate the median, first and third quartiles; whiskers extend to the largest value no further than 1.5 × the interquartile range for 90 biologically independent faecal samples obtained from n = 15 participants assigned to the upper quartile and n = 15 participants assigned to the lower quartile of WLZ-responses (n = 3 samples/participant). (b) The β3 coefficient for the interaction of WLZ-response quartile and study week is shown for CAZymes in consensus PULs in Bg0018 and Bg0019. Predicted PUL substrates and potential glycosidic linkages in each of these substrates are shown on the right. Glycosidic linkages whose abundances were significantly different in faecal samples from the upper versus lower WLZ quartile responders are highlighted in bold font (see Fig. 5a).
Extended Data Fig. 8
Extended Data Fig. 8. Treatment-responsive glycosidic linkages and corresponding polysaccharide sources and structures, cleavage sites, and predicted products of CAZyme activity.
(a,b) Predicted activities and expression of P. copri PUL CAZymes. Panel a depicts CAZymes assigned to PUL17b, including (i) the GH51 family CAZyme (blue) expected to cleave α-1,2- and α-1,3-linked arabinofuranose (Araf) side chains and (ii) GH43_4 and GH43_5 subfamily members (brown) predicted to cleave α-1,5-Araf-linked backbone of branched arabinan, yielding products containing t-Araf, 2-Araf, 2,3 Araf and 5-Araf linkages. Panel b depicts CAZymes assigned to PUL7, including GH26 and GH5_4 CAZymes (magenta) predicted to cleave β-1,4 linked mannose residues of galactomannan, yielding products containing 4,6-mannose which is the most significantly differentially abundant linkage in the upper quartile WLZ responders (see Fig. 5a). The CAZyme colouring scheme matches that used in Fig. 5b, c.
Extended Data Fig. 9
Extended Data Fig. 9. Polysaccharide structures, cleavage sites, and predicted products of CAZyme activity.
Glycosidic linkages highlighted with arrows are those predicted as sites of cleavage by CAZymes expressed by the set of PULs, described in Fig. 4a, that are present in P. copri MAG Bg0019 and/or Bg0018. Consensus PUL numbers are listed except in the case of Bg0019 PUL3, which is not represented in Bg0018 (see Supplementary Table 15). The size of the arrows (large versus small) denotes the relative likelihood (high versus low, respectively) of cleavage of glycosidic linkages by P. copri CAZymes when considering steric hindrance at branch points.
Extended Data Fig. 10
Extended Data Fig. 10. Validation of the MAG assembly pipeline.
(a) Bioinformatic workflow for comparing the fidelity of MAG assembly from alignment-based (bowtie2) versus pseudoalignment-based (kallisto) contig quantitation. (b) A detailed description of the workflow is described in panel a. Each box includes a summary of the computational task plus the name of the program and, where relevant, the command used to complete the task (in parentheses). Colour of the text in parentheses: brown, default code from kallisto; purple, default code from bowtie2; blue, custom script written to achieve tasks described; black, default code used for programs to assemble MAGs and dereplicate contigs. Boxes with a black outline and the thick black arrows emanating from them indicate that binned contigs were used as input to AMBER for MAG assembly comparisons across methods. (c) Boxplot describing summary statistics (completeness and purity) for MAG assembly approaches. Boxplots indicate the median, first and third quartiles; whiskers extend to the largest value no further than 1.5 × the interquartile range. The number of individual MAGs generated using each MAG assembly tool-quantitation method was 671 for DAS tool-kallisto, 723 for MaxBin2-kallisto, 925 for MetaBAT2-kallisto, 362 for CONCOCT-kallisto, 540 for DAS tool-bowtie2, 780 for MaxBin2-bowtie2, 578 for MetaBAT2-bowtie2 and 340 for CONCOCT-bowtie2. (d) Number of MAGs, obtained from each assembly and quantitation strategy, that are distributed across two quality metrics (completeness, contamination). The number of ‘gold standard’ MAGs (theoretical maximum) in the simulated metagenomic dataset is indicated by a horizontal dashed line. *, P < 0.05; **, P < 0.01; ***, P < 0.001 (two-tailed, unpaired Wilcoxon test for panel c; two-tailed Fisher’s exact test for panel d).

Update of

References

    1. Smith MI, et al. Gut microbiomes of Malawian twin pairs discordant for kwashiorkor. Science. 2013;339:548–554. doi: 10.1126/science.1229000. - DOI - PMC - PubMed
    1. Blanton LV, et al. Gut bacteria that prevent growth impairments transmitted by microbiota from malnourished children. Science. 2016;351:aad3311. doi: 10.1126/science.aad3311. - DOI - PMC - PubMed
    1. Gehrig JL, et al. Effects of microbiota-directed foods in gnotobiotic animals and undernourished children. Science. 2019;365:eaau4732. doi: 10.1126/science.aau4732. - DOI - PMC - PubMed
    1. Chen RY, et al. A microbiota-directed food intervention for undernourished children. N. Engl. J. Med. 2021;384:1517–1528. doi: 10.1056/NEJMoa2023294. - DOI - PMC - PubMed
    1. Levels and Trends in Child Malnutrition: UNICEF/WHO/The World Bank Group Joint Child Malnutrition Estimates: Key Findings of the 2021 Edition (WHO, 2021).

Publication types

Substances