. 2023 Dec 13;21(1):496.
doi: 10.1186/s12916-023-03208-8.

Functional connectivity of cognition-related brain networks in adults with fetal alcohol syndrome

Affiliations

Functional connectivity of cognition-related brain networks in adults with fetal alcohol syndrome

Benedikt Sundermann et al. BMC Med. .

Abstract

Background: Fetal alcohol syndrome (FAS) can result in cognitive dysfunction. Cognitive functions affected are subserved by few functional brain networks. Functional connectivity (FC) in these networks can be assessed with resting-state functional MRI (rs-fMRI). Alterations of FC have been reported in children and adolescents prenatally exposed to alcohol. Previous reports varied substantially regarding the exact nature of findings. The purpose of this study was to assess FC of cognition-related networks in young adults with FAS.

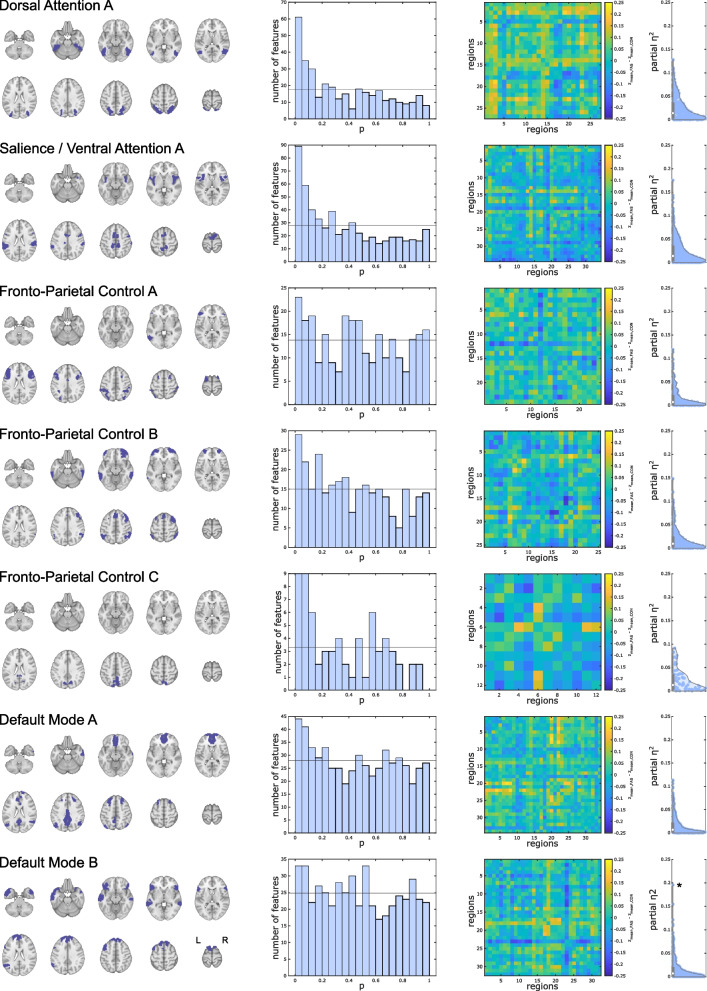
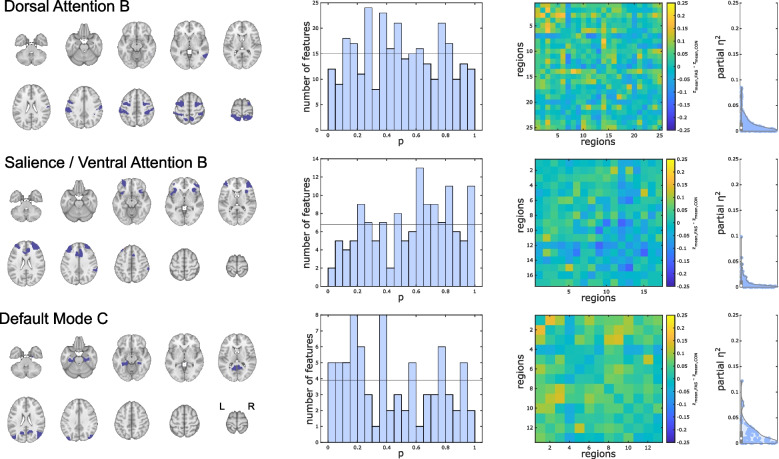
Methods: Cross-sectional rs-fMRI study in participants with FAS (n = 39, age: 20.9 ± 3.4 years) and healthy participants without prenatal alcohol exposure (n = 44, age: 22.2 ± 3.4 years). FC was calculated as correlation between cortical regions in ten cognition-related sub-networks. Subsequent modelling of overall FC was based on linear models comparing FC between FAS and controls. Results were subjected to a hierarchical statistical testing approach, first determining whether there is any alteration of FC in FAS in the full cognitive connectome, subsequently resolving these findings to the level of either FC within each network or between networks based on the Higher Criticism (HC) approach for detecting rare and weak effects in high-dimensional data. Finally, group differences in single connections were assessed using conventional multiple-comparison correction. In an additional exploratory analysis, dynamic FC states were assessed.

Results: Comparing FAS participants with controls, we observed altered FC of cognition-related brain regions globally, within 7 out of 10 networks, and between networks employing the HC statistic. This was most obvious in attention-related network components. Findings also spanned across subcomponents of the fronto-parietal control and default mode networks. None of the single FC alterations within these networks yielded statistical significance in the conventional high-resolution analysis. The exploratory time-resolved FC analysis did not show significant group differences of dynamic FC states.

Conclusions: FC in cognition-related networks was altered in adults with FAS. Effects were widely distributed across networks, potentially reflecting the diversity of cognitive deficits in FAS. However, no altered single connections could be determined in the most detailed analysis level. Findings were pronounced in networks in line with attentional deficits previously reported.

Keywords: Connectivity; Executive functions; Fetal alcohol syndrome; Higher criticism; Prenatal alcohol; Resting-state fMRI.


Conflict of interest statement

Christian Mathys: consulting and lecturing for Siemens on behalf of the employer (Evangelisches Krankenhaus Oldenburg). The other authors declare that they have no competing interests.

Figures

Fig. 1
Fig. 1
Global analysis of static functional connectivity of cognition-related brain networks. A Full atlas-based selection of 243 individual brain regions in cognition-related networks (redundant color coding for illustration of atlas resolution only). B P-value histogram of multiple individual linear models (main effect of group) comparing functional connectivity among all these brain regions between FAS patients and control participants. Under the null hypothesis of equal functional connectivity in both groups, equal numbers of p-values are expected in each histogram bin. The histogram shows an excess of low p-values. The existence of at least rare and/or weak effects visualized in the histogram is confirmed by a quantitative test of the joint hypothesis based on higher criticism statistics, following the same rationale. This means that regarding a significant number of functional connections, FAS patients differ from healthy controls. C Unthresholded matrix of connectivity group differences describing the full connectome of cognition-related brain regions. Yellow: mean z-transformed correlation coefficients relatively increased in FAS compared with controls. Blue: relatively decreased functional connectivity in FAS. Color coding of networks identical with Fig. 4. D Standardized effect size estimates (partial η2 from linear models)
Fig. 2
Fig. 2
Within-network static functional connectivity differences in cognition-related brain networks. Seven (out of ten) sub-networks exhibiting altered functional connectivity in FAS patients compared with controls. First column: Overview of the networks’ overall extent. Second column: P-value histograms (different scaling reflecting different numbers of regions in each network) of multiple linear models (main effect of group) comparing functional connectivity within these sub-networks between FAS patients and control participants. Under the null hypothesis of equal functional connectivity in both groups, equal numbers of p-values are expected in each histogram bin. The histograms show an excess of low p-values, quantitatively confirmed by a test of the joint hypothesis based on higher criticism statistics. This means that FAS patients differ from healthy controls regarding at least rare and/or weak effects. Third column: Unthresholded matrices of connectivity group differences describing the full connections of cognition- related brain regions within each network. Yellow: mean z-transformed correlation coefficients relatively increased in FAS compared with controls. Blue: relatively decreased functional connectivity in FAS. Fourth column: Standardized effect size estimates (partial η2 from linear models, * single connection with significant group difference, false-discovery-rate-corrected p < 0.05 within the network but not significant when correcting across all connections). The remaining three networks without significant results are presented in Fig. 3
Fig. 3
Fig. 3
Within-network static functional connectivity of cognition-related brain networks (networks without significant group differences). Three (out of ten) sub-networks not exhibiting altered functional connectivity in FAS patients compared with controls. First column: Overview of the networks’ overall extent. Second column: P-value histograms of multiple linear models (main effect of group) comparing functional connectivity within these sub-networks between FAS and control participants (global null hypothesis not rejected based on HC test statistic). Third column: Unthresholded matrix of connectivity group differences describing the full connections of cognition-related brain regions within each network. Yellow: mean z-transformed correlation coefficients relatively increased in FAS compared with controls. Blue: relatively decreased functional connectivity in FAS. Fourth column: Standardized effect size estimates (partial η2 from linear models)
Fig. 4
Fig. 4
Between-network static functional connectivity of cognition-related brain networks. A 10 cognition-related networks. Each color represents an individual sub-network (network-wise concatenation of individual regions based on atlas labels). B P-value histogram of multiple linear models (main effect of group) comparing functional connectivity among these sub-networks between FAS patients and control participants. Under the null hypothesis of equal functional connectivity in both groups, equal numbers of p-values are expected in each histogram bin. The histogram shows an excess of low p-values quantitatively confirmed by a test of the joint hypothesis based on higher criticism statistics. This means that regarding a significant number of functional connections, FAS patients differ from healthy controls. C Unthresholded matrix of connectivity group differences describing the full connectome of cognition- related brain regions. Yellow: mean z-transformed correlation coefficients relatively increased in FAS compared with controls. Blue: relatively decreased functional connectivity in FAS. D Standardized effect size estimates (partial η2 from linear models)

References

    1. Davis KM, Gagnier KR, Moore TE, Todorow M. Cognitive aspects of fetal alcohol spectrum disorder. Wiley Interdiscip Rev Cogn Sci. 2013;4(1):81–92. doi: 10.1002/wcs.1202. - DOI - PubMed
    1. Popova S, Charness ME, Burd L, Crawford A, Hoyme HE, Mukherjee RAS, Riley EP, Elliott EJ. Fetal alcohol spectrum disorders. Nat Rev Dis Primers. 2023;9(1):11. doi: 10.1038/s41572-023-00420-x. - DOI - PubMed
    1. Kodituwakku P, Coriale G, Fiorentino D, Aragon AS, Kalberg WO, Buckley D, Gossage JP, Ceccanti M, May PA. Neurobehavioral characteristics of children with fetal alcohol spectrum disorders in communities from Italy: Preliminary results. Alcohol Clin Exp Res. 2006;30(9):1551–1561. doi: 10.1111/j.1530-0277.2006.00187.x. - DOI - PubMed
    1. Dorrie N, Focker M, Freunscht I, Hebebrand J. Fetal alcohol spectrum disorders. Eur Child Adolesc Psychiatry. 2014;23(10):863–875. doi: 10.1007/s00787-014-0571-6. - DOI - PubMed
    1. Day NL, Helsel A, Sonon K, Goldschmidt L. The association between prenatal alcohol exposure and behavior at 22 years of age. Alcohol Clin Exp Res. 2013;37(7):1171–1178. doi: 10.1111/acer.12073. - DOI - PubMed

Publication types